Managing health tenders involves strict compliance, detailed evaluation, and continuous monitoring. Therefore, healthcare organizations need a reliable and data-driven system to track tender performance accurately. A Health Tender KPI Dashboard in Power BI solves this challenge by converting complex tender data into clear, actionable insights.
This article explains everything you need to know about the Health Tender KPI Dashboard in Power BI, including its features, working process, advantages, best practices, and frequently asked questions. Moreover, you will learn how this dashboard helps healthcare organizations improve decision-making and tender efficiency.
Click to buy Health Tender KPI Dashboard in Power BI
What Is a Health Tender KPI Dashboard in Power BI?
A Health Tender KPI Dashboard in Power BI is a visual reporting tool that helps healthcare organizations track tender-related key performance indicators (KPIs) in real time.
Instead of managing scattered Excel files and manual reports, this dashboard centralizes all tender KPIs in one interactive Power BI report. As a result, decision-makers gain instant visibility into performance, targets, and trends.
Furthermore, this dashboard uses Excel as a data source, which makes data entry simple and flexible. Users only need to update numbers in Excel, and Power BI automatically refreshes the visuals.
Why Do Healthcare Organizations Need a Tender KPI Dashboard?
Healthcare tenders involve multiple vendors, strict compliance rules, budget limits, and timelines. Therefore, organizations must track every KPI carefully.
A Health Tender KPI Dashboard helps because:
- It improves transparency in tender performance
- It tracks MTD and YTD performance clearly
- It reduces manual reporting effort
- It supports data-driven decision-making
- It highlights risks and performance gaps early
As a result, management teams can take timely action and improve tender efficiency.
Overview of Health Tender KPI Dashboard in Power BI
This dashboard comes as a ready-to-use Power BI file connected to an Excel data source. It includes three interactive pages, each designed to serve a specific analytical purpose.
Dashboard Structure Overview
Summary Page
KPI Trend Page
KPI Definition Page
Each page plays a vital role in analyzing health tender performance.
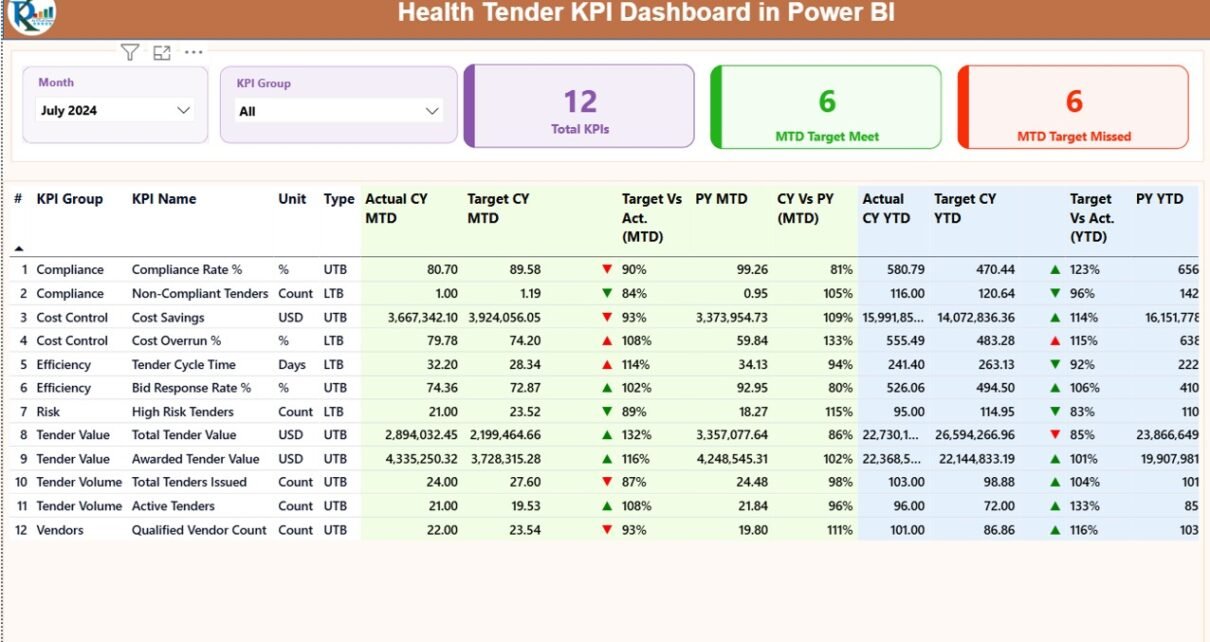
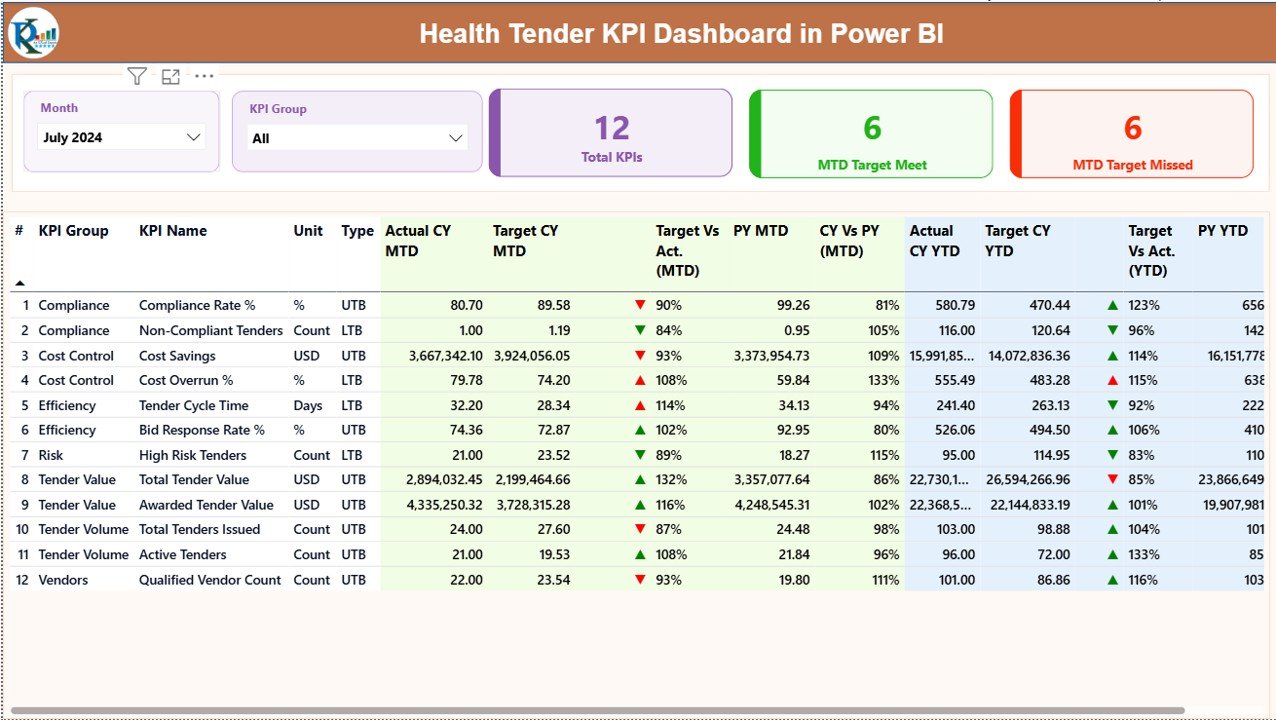
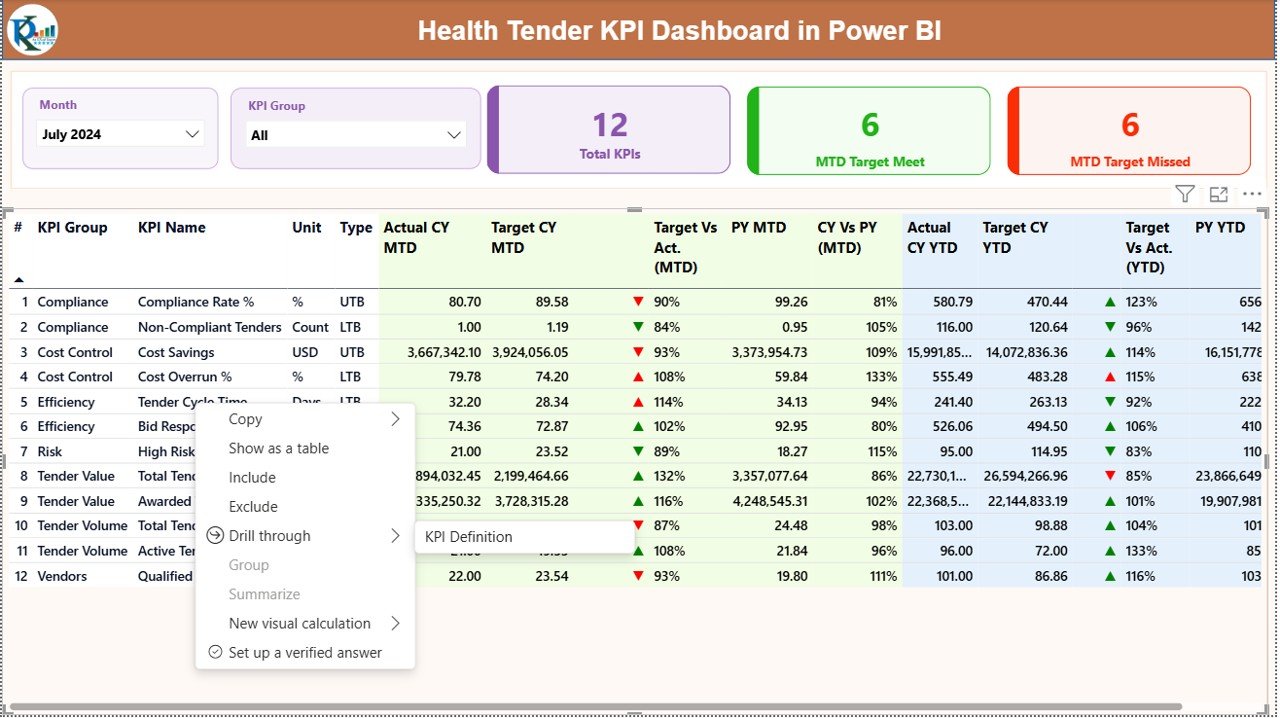
Summary Page – Complete KPI Overview
The Summary Page acts as the main dashboard. It provides a high-level view of all tender KPIs in one place.
Key Elements of the Summary Page
Slicers
- Month Selector
- KPI Group Selector
These slicers help users filter data dynamically and analyze specific periods or KPI categories.
KPI Cards
At the top of the dashboard, three KPI cards display:
- Total KPIs Count
- MTD Target Met Count
- MTD Target Missed Count
These cards give an instant performance snapshot.
Detailed KPI Table
The detailed table shows all KPI metrics clearly. Below are the columns included:
KPI Number
Shows the sequence number of each KPI.
KPI Group
Displays the category of the KPI.
KPI Name
Shows the name of the performance indicator.
Unit
Defines the measurement unit such as %, days, or count.
KPI Type
Indicates:
- LTB (Lower the Better)
- UTB (Upper the Better)
Actual CY MTD
Shows the actual performance for the current month.
Target CY MTD
Displays the target value for the current month.
MTD Status Icon
Shows:
- Green arrow for target achieved
- Red arrow for target missed
Target vs Actual (MTD)
Calculates performance using:
Actual MTD / Target MTD
PY MTD
Shows previous year’s MTD value.
CY vs PY (MTD)
Compares current MTD with previous year MTD.
Actual CY YTD
Shows year-to-date actual values.
Target CY YTD
Shows year-to-date target values.
YTD Status Icon
Displays performance status with arrows.
Target vs Actual (YTD)
Calculated using:
Actual YTD / Target YTD
PY YTD
Displays last year’s YTD values.
CY vs PY (YTD)
Compares current year and previous year YTD performance.
Click to buy Health Tender KPI Dashboard in Power BI
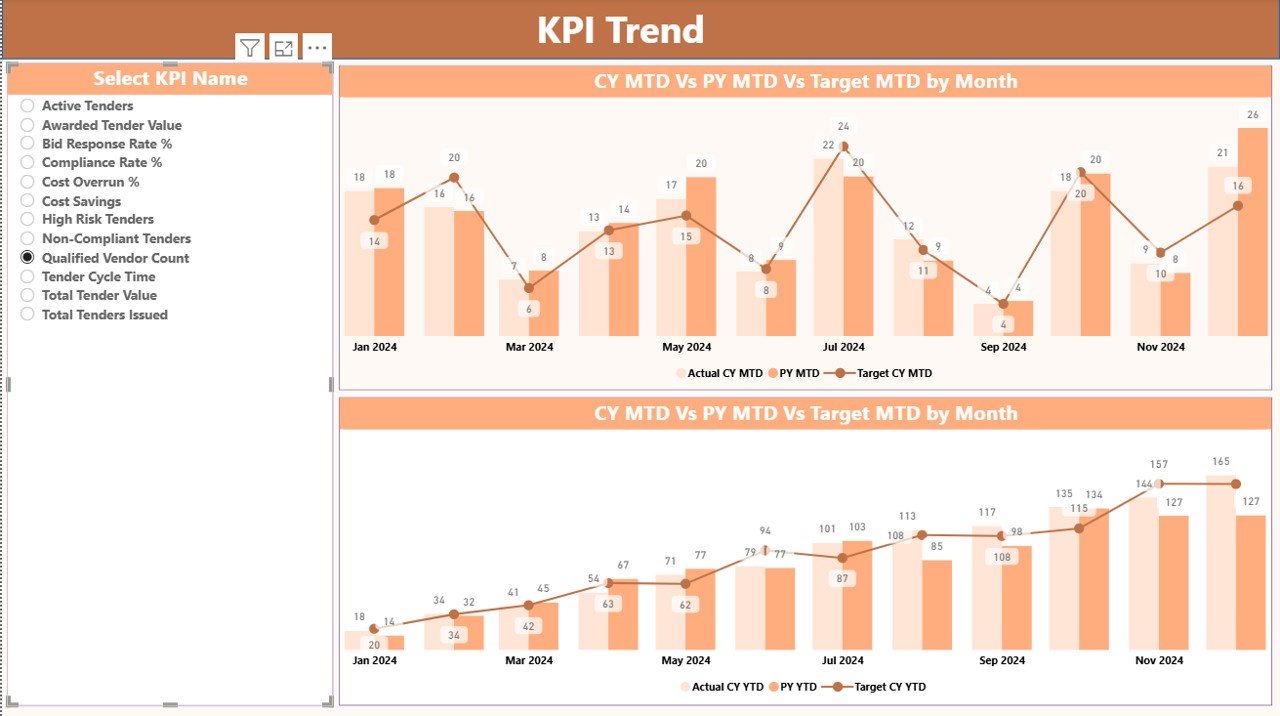
KPI Trend Page – Performance Visualization
The KPI Trend Page focuses on trend analysis.
Key Features of KPI Trend Page
Two combo charts
Displays Current Year, Previous Year, and Target values
Supports MTD and YTD analysis
KPI selection slicer available
This page helps users identify trends, growth patterns, and performance gaps over time.
Click to buy Health Tender KPI Dashboard in Power BI
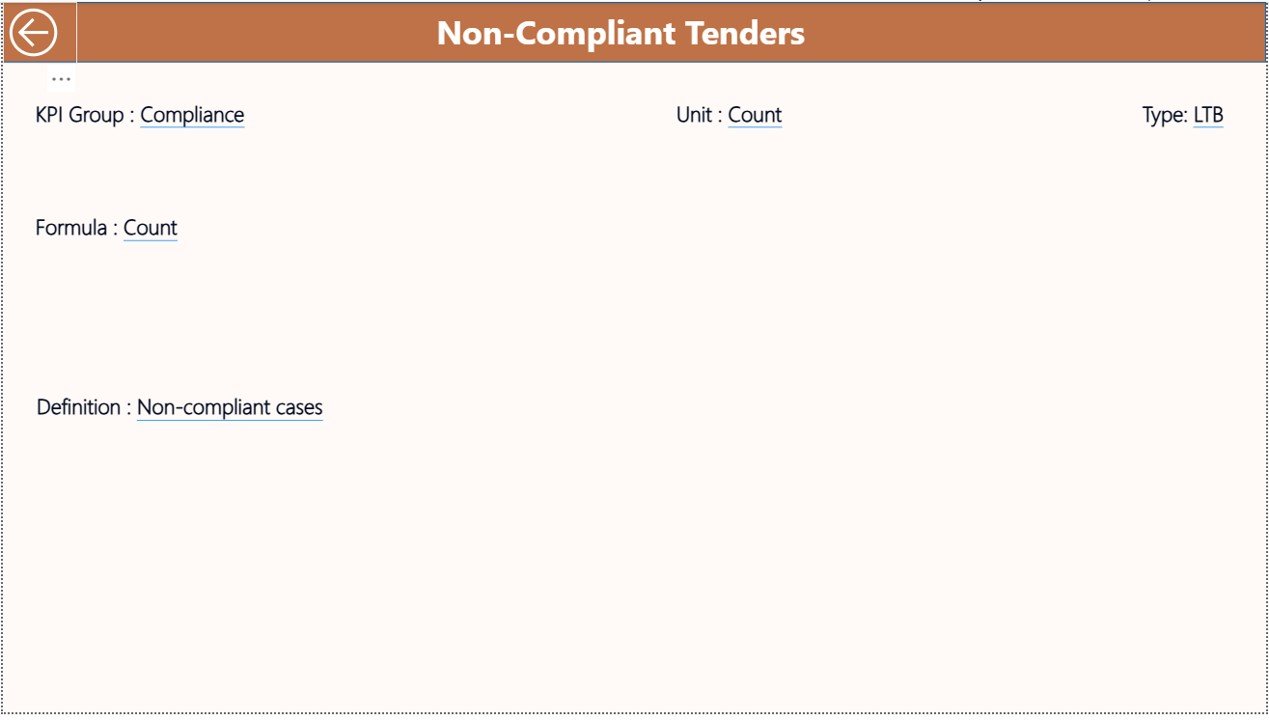
KPI Definition Page – Detailed KPI Explanation
The KPI Definition Page serves as a drill-through page.
What This Page Shows
- KPI Name
- KPI Formula
- KPI Definition
- KPI Type (LTB or UTB)
Users can access this page by clicking on any KPI from the Summary Page. Moreover, a Back Button allows smooth navigation to the main dashboard.
Click to buy Health Tender KPI Dashboard in Power BI
Excel Data Structure Used in the Dashboard
The dashboard connects to an Excel file with three structured worksheets.
Input_Actual Sheet
This sheet stores actual performance data.
Columns include:
- KPI Name
- Month (First date of month)
- MTD Value
- YTD Value
Users must update this sheet regularly to keep reports accurate.
Input_Target Sheet
This sheet stores target values.
Columns include:
- KPI Name
- Month
- Target MTD
- Target YTD
This structure ensures clear target tracking.
Click to buy Health Tender KPI Dashboard in Power BI
KPI Definition Sheet
This sheet defines each KPI clearly.
Fields include:
- KPI Number
- KPI Group
- KPI Name
- Unit
- Formula
- Definition
- Type (LTB or UTB)
Advantages of Health Tender KPI Dashboard in Power BI
Centralized Performance Tracking
The dashboard brings all KPIs into one place, which saves time and reduces errors.
Real-Time Decision Making
Since Power BI updates data instantly, teams can act quickly.
Easy Data Entry
Excel-based input makes data handling simple and user-friendly.
Improved Transparency
All stakeholders can view performance clearly.
Strong Visual Representation
Charts, icons, and color indicators improve understanding.
Time-Saving Reporting
The dashboard eliminates manual reporting efforts.
Scalability
Organizations can add more KPIs without redesigning the dashboard.
Best Practices for Using Health Tender KPI Dashboard
Maintain Clean Data
Always enter accurate and validated data in Excel.
Update Data Regularly
Update MTD and YTD values monthly for accuracy.
Use KPI Definitions Clearly
Define KPIs clearly to avoid confusion.
Monitor Trends Weekly
Review trend charts regularly to identify risks early.
Train Users
Ensure team members understand dashboard usage.
Standardize KPI Units
Maintain consistency in units across KPIs.
Review Performance Monthly
Conduct monthly reviews using dashboard insights.
Who Can Use This Dashboard?
This dashboard suits:
- Healthcare administrators
- Tender management teams
- Procurement departments
- Finance teams
- Compliance officers
- Hospital management
- Healthcare consultants
Why Power BI Is Ideal for Health Tender Reporting
Power BI offers:
Interactive visuals
Easy Excel integration
Fast data refresh
Secure data handling
Scalability
Professional dashboards
Therefore, Power BI becomes the perfect choice for healthcare tender analysis.
Conclusion
The Health Tender KPI Dashboard in Power BI provides a powerful, structured, and user-friendly solution for monitoring tender performance. It simplifies complex data, improves transparency, and supports faster decision-making.
Moreover, its Excel-based design ensures ease of use, while Power BI visuals ensure clarity and accuracy. By using this dashboard, healthcare organizations can improve tender success rates, reduce risks, and achieve better operational efficiency.
If your organization handles multiple health tenders, this dashboard becomes an essential performance management tool.
Frequently Asked Questions (FAQs)
- What is a Health Tender KPI Dashboard?
A Health Tender KPI Dashboard tracks tender performance using key metrics like targets, actuals, MTD, and YTD values.
- Which tool is used to build this dashboard?
The dashboard uses Microsoft Power BI with Excel as the data source.
- Can I customize the KPIs?
Yes, you can add or modify KPIs easily by updating the Excel sheets.
- Does this dashboard support MTD and YTD analysis?
Yes, it supports both MTD and YTD performance tracking.
- Can non-technical users use this dashboard?
Yes, the dashboard uses simple Excel inputs and interactive visuals.
- Does it support trend analysis?
Yes, the KPI Trend page displays trends using combo charts.
- Is this dashboard suitable for large hospitals?
Yes, it works for both small clinics and large healthcare organizations.
- Can I track previous year performance?
Yes, the dashboard includes CY vs PY comparisons.
- Does it require coding knowledge?
No, users only need basic Excel and Power BI knowledge.
- How often should data be updated?
You should update data monthly or as per business needs.
Visit our YouTube channel to learn step-by-step video tutorials
Watch the step-by-step video tutorial:
Click to buy Health Tender KPI Dashboard in Power BI