Managing healthcare procurement without accurate performance tracking creates delays, overspending, and compliance risks. Therefore, healthcare organizations now rely heavily on data-driven dashboards to monitor procurement efficiency and control costs. One of the most effective tools available today is the Health Procurement KPI Dashboard in Power BI.
This comprehensive article explains everything you need to know about the Health Procurement KPI Dashboard in Power BI, including its structure, features, benefits, best practices, and FAQs. Moreover, this guide helps you understand how to use the dashboard effectively for better procurement decisions.
Click to buy Health Procurement KPI Dashboard in Power BI
What Is a Health Procurement KPI Dashboard in Power BI?
A Health Procurement KPI Dashboard in Power BI is a visual analytics tool that helps healthcare organizations track, analyze, and improve procurement performance using key performance indicators (KPIs).
Instead of managing scattered Excel sheets, emails, and reports, this dashboard consolidates procurement data into one interactive Power BI report. As a result, decision-makers gain complete visibility into spending, performance, and efficiency.
Moreover, the dashboard connects directly with Excel files, which makes data entry simple and flexible. You only need to update the Excel sheets, and Power BI automatically refreshes all visuals.
Why Do Healthcare Organizations Need a Procurement KPI Dashboard?
Healthcare procurement involves large budgets, multiple vendors, strict regulations, and continuous monitoring. Therefore, organizations must track procurement performance accurately and consistently.
Here’s why a Health Procurement KPI Dashboard becomes essential:
- Improves procurement transparency
- Tracks performance against targets
- Identifies cost-saving opportunities
- Supports data-driven decision-making
- Enhances accountability
- Reduces manual reporting effort
Moreover, the dashboard helps leadership teams monitor trends and take corrective actions before issues escalate.
Overview of Health Procurement KPI Dashboard in Power BI
This ready-to-use Power BI dashboard consists of three powerful pages, each designed to provide deep insights into procurement performance.
Dashboard Structure at a Glance
- Summary Page
- KPI Trend Page
- KPI Definition Page
- Excel-Based Data Source
Each section plays a crucial role in delivering accurate and actionable insights.
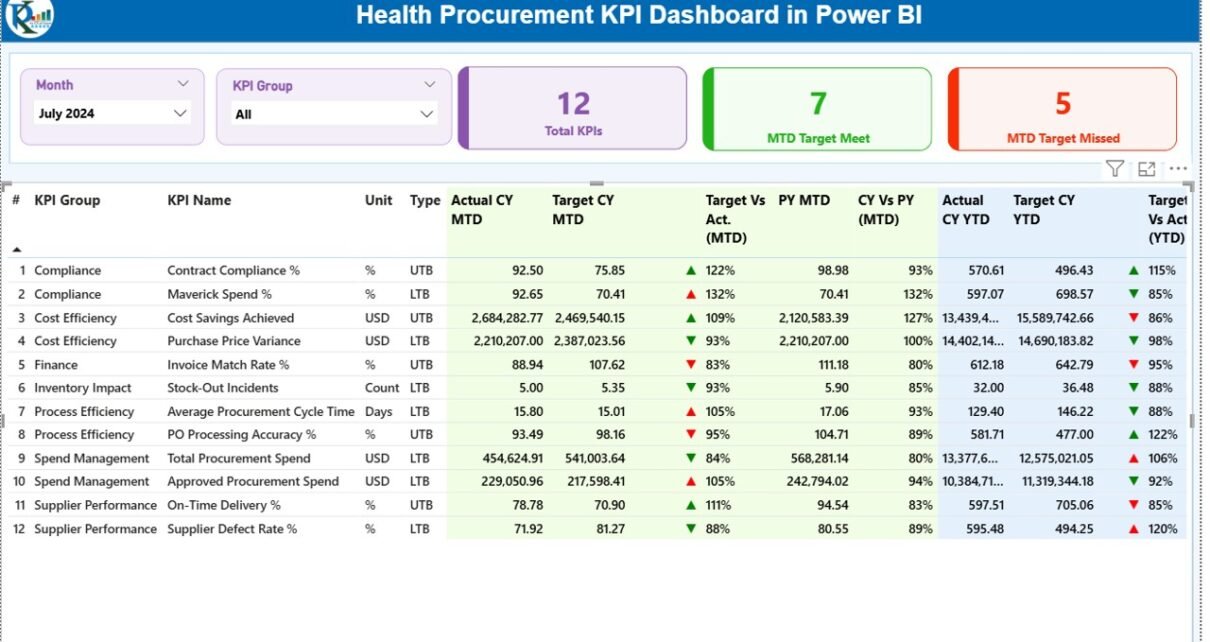
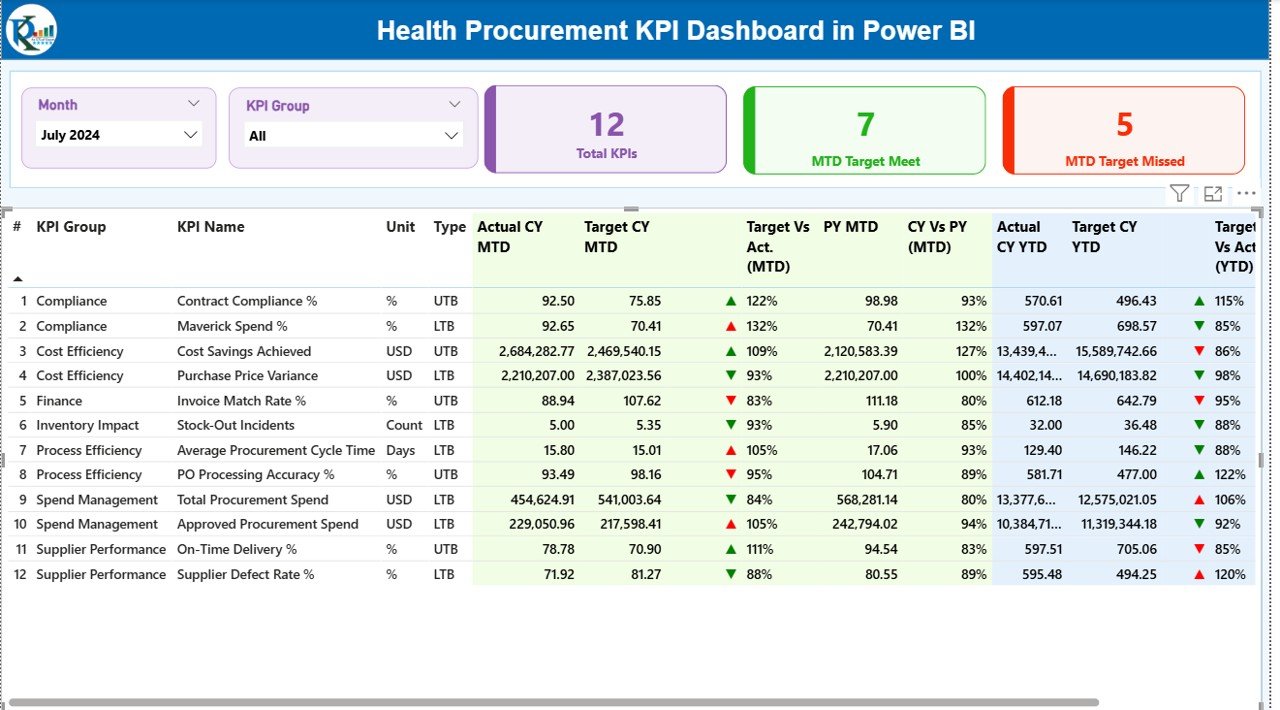
Summary Page – Central Performance Overview
The Summary Page serves as the heart of the dashboard. It provides a consolidated view of all procurement KPIs in one place.
Key Features of the Summary Page
Interactive Filters
- Month Slicer
- KPI Group Slicer
These slicers allow users to filter data dynamically and analyze performance for specific time periods or KPI categories.
KPI Summary Cards
At the top of the dashboard, you will find three important KPI cards:
- Total KPIs Count
- MTD Target Met Count
- MTD Target Missed Count
These cards provide a quick snapshot of overall performance.
Detailed KPI Table
The dashboard displays a comprehensive KPI table with the following fields:
- KPI Number
- Defines the category or group of the KPI.
- KPI Name
- Displays the name of the procurement KPI.
- Unit
- Indicates the measurement unit such as %, Amount, or Count.
- KPI Type
- LTB (Lower is Better)
- UTB (Upper is Better)
This helps users understand performance direction clearly.
MTD (Month-to-Date) Performance Metrics
- Actual CY MTD – Current year actual value
- Target CY MTD – Target value for the current month
- MTD Icon – Visual indicator using green ▲ or red ▼
- Target vs Actual (MTD) – Percentage comparison
- PY MTD – Previous year MTD value
- CY vs PY (MTD) – Growth or decline percentage
These metrics help evaluate short-term procurement performance effectively.
YTD (Year-to-Date) Performance Metrics
- Actual CY YTD – Current year cumulative value
- Target CY YTD – Target YTD value
- YTD Icon – Performance indicator
- Target vs Actual (YTD) – Performance ratio
- PY YTD – Previous year YTD value
- CY vs PY (YTD) – Year-over-year comparison
Together, these KPIs help organizations track long-term trends and performance stability.
Click to buy Health Procurement KPI Dashboard in Power BI
KPI Trend Page – Visual Performance Analysis
The KPI Trend Page focuses on visual trend analysis.
Key Features
- Two interactive combo charts
- Displays:
Current Year Actual
Previous Year Actual
Target Values
Covers both MTD and YTD analysis
Dynamic KPI Selection
A slicer on the left allows users to select any KPI. Once selected, the charts update automatically.
This feature helps in:
- Identifying performance trends
- Comparing year-over-year results
- Monitoring seasonal fluctuations

Click to buy Health Procurement KPI Dashboard in Power BI
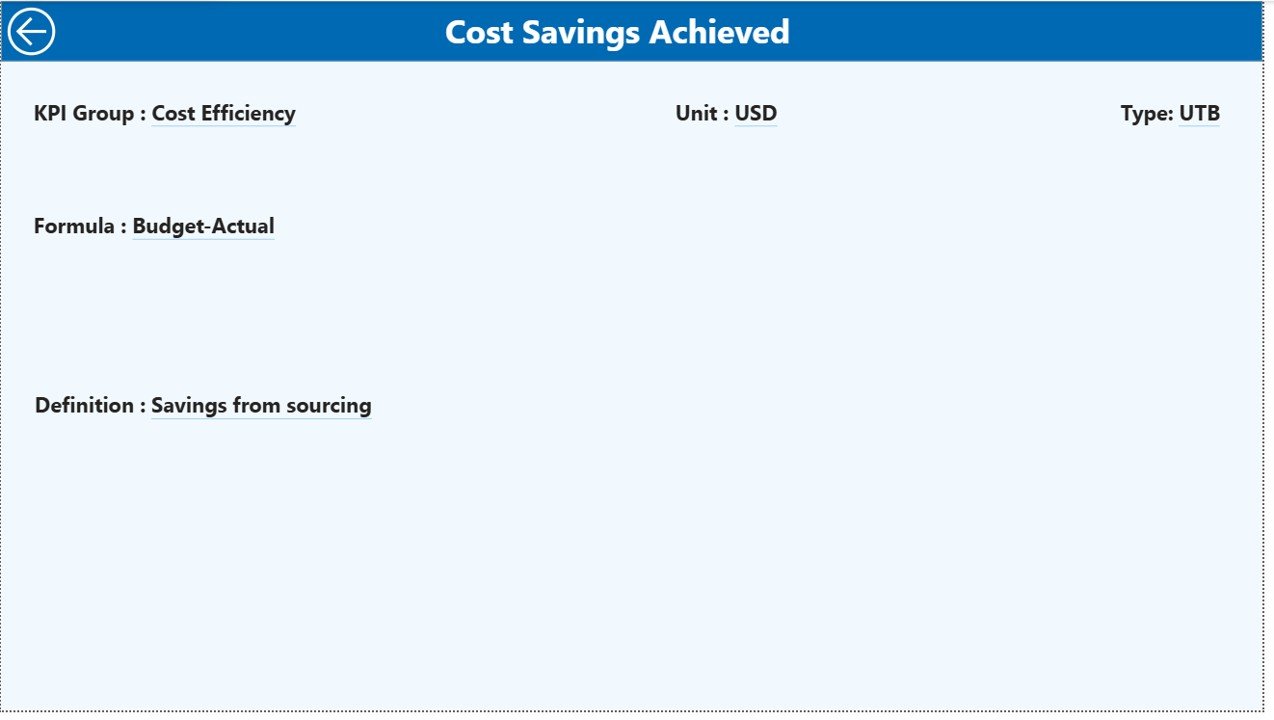
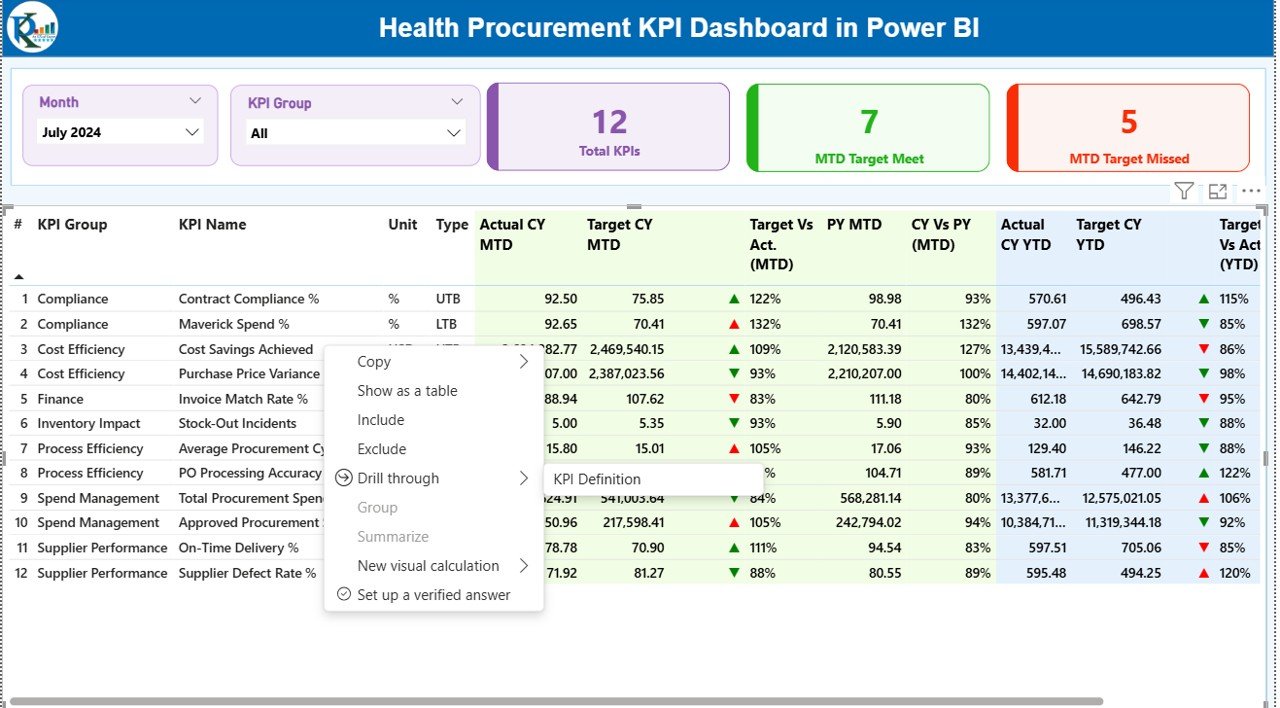
KPI Definition Page – Detailed KPI Explanation
The KPI Definition Page acts as a reference guide.
Key Highlights
- Hidden by default for a clean interface
Accessible via drill-through from the summary page
Displays:
KPI Formula
KPI Definition
Unit
KPI Type (LTB/UTB)
This page ensures transparency and clarity for all stakeholders.
Click to buy Health Procurement KPI Dashboard in Power BI
Excel Data Source – Simple and Flexible
The dashboard uses Excel as its data source, making it extremely user-friendly.
Input_Actual Sheet
You enter:
- KPI Name
- Month (first date of month)
- MTD values
- YTD values
Input_Target Sheet
You enter:
- KPI Name
- Month
- Target MTD
- Target YTD
KPI Definition Sheet
You define:
- KPI Number
- KPI Group
- KPI Name
- Unit
- Formula
- Definition
- KPI Type (LTB or UTB)
Once you update Excel, Power BI automatically refreshes the dashboard
Click to buy Health Procurement KPI Dashboard in Power BI
Advantages of Health Procurement KPI Dashboard in Power BI
Centralized Performance Monitoring
You can track all procurement KPIs in one place without switching tools.
Improved Decision-Making
Real-time insights help leaders make faster and smarter decisions.
Time-Saving Automation
Power BI eliminates manual reporting and calculations.
Clear Performance Visibility
Visual indicators make performance tracking easy.
Better Cost Control
You can quickly identify overspending or inefficiencies.
User-Friendly Design
Even non-technical users can operate the dashboard easily.
Scalable Solution
You can add new KPIs without redesigning the dashboard.
Best Practices for Using Health Procurement KPI Dashboard
Keep Data Updated Regularly
Always update Excel sheets on time to maintain data accuracy.
Define Clear KPIs
Use meaningful KPIs aligned with procurement objectives.
Monitor Trends Weekly
Frequent monitoring helps detect issues early.
Use Consistent KPI Definitions
Maintain consistency across departments.
Train Users
Provide basic training to stakeholders for better adoption.
Review KPIs Periodically
Remove outdated KPIs and add new ones as needed.
Use Drill-Through Features
Explore KPI details instead of relying only on summary data.
Who Can Use This Dashboard?
This dashboard works perfectly for:
- Healthcare procurement teams
- Hospital administrators
- Supply chain managers
- Finance teams
- Compliance officers
- Healthcare consultants
- Data analysts
Conclusion
The Health Procurement KPI Dashboard in Power BI provides a powerful, structured, and user-friendly way to monitor procurement performance. It transforms raw Excel data into meaningful insights, helps track targets, improves transparency, and supports better decision-making.
Moreover, the dashboard saves time, reduces manual effort, and ensures accuracy across procurement operations. With its interactive visuals, KPI tracking, and Excel-based input system, this dashboard becomes an essential tool for modern healthcare organizations.
If you want complete control over procurement performance, this dashboard offers the perfect solution.
Frequently Asked Questions (FAQs)
- What is a Health Procurement KPI Dashboard?
It is a Power BI dashboard that tracks procurement performance using KPIs such as targets, actuals, and trends.
- Can I update data using Excel?
Yes. The dashboard uses Excel as its data source for easy updates.
- Does the dashboard support MTD and YTD analysis?
Yes. It supports both Month-to-Date and Year-to-Date performance tracking.
- Can I customize KPIs?
Yes. You can add or modify KPIs using the KPI Definition sheet.
- Is Power BI knowledge required to use this dashboard?
No. Basic knowledge of Excel is sufficient.
- Can I use this dashboard for multiple departments?
Yes. You can filter data using KPI Group and Month slicers.
- Does it support trend analysis?
Yes. The KPI Trend page provides clear visual trend analysis.
- Is this dashboard suitable for healthcare organizations only?
Primarily yes, but you can customize it for other procurement use cases.
Visit our YouTube channel to learn step-by-step video tutorials
Watch the step-by-step video tutorial:
Click to buy Health Procurement KPI Dashboard in Power BI