Port procurement operations involve complex purchasing activities, large budgets, multiple vendors, strict delivery timelines, and high financial risk. Because ports handle equipment, spare parts, fuel, infrastructure materials, and services, even small procurement delays or cost overruns can disrupt port operations. However, when procurement data remains scattered across spreadsheets and manual reports, decision-making becomes slow and reactive.
That is exactly why a Port Procurement Dashboard in Power BI becomes a powerful solution. This ready-to-use dashboard converts raw procurement data into clear, visual, and actionable insights. As a result, port authorities, procurement managers, and finance teams gain full visibility into costs, delivery performance, risks, and trends—within a single interactive Power BI dashboard.
In this article, we will explain what the Port Procurement Dashboard in Power BI is, how it works, its sheet structure, key visuals, advantages, improvement opportunities, best practices, and frequently asked questions.
What Is a Port Procurement Dashboard in Power BI?
A Port Procurement Dashboard in Power BI is an interactive analytics solution designed to track, analyze, and monitor procurement performance across port operations. It consolidates procurement KPIs such as planned cost, actual cost, cost variance, delivery status, vendor performance, and monthly trends into one centralized dashboard.
Because this dashboard is built using Power BI, it provides:
-
Interactive filtering and drill-downs
-
Real-time performance visibility
-
Clear comparison between planned and actual costs
-
Visual identification of risks and delays
-
Easy sharing with stakeholders
As a result, procurement teams gain clarity, speed, and confidence in decision-making.
Key Features of the Port Procurement Dashboard in Power BI
Click to Buy Port Procurement Dashboard in Power BI
This dashboard is a ready-to-use solution that covers the complete procurement lifecycle. It includes multiple analytical sections designed to support operational, financial, and risk-based decisions.
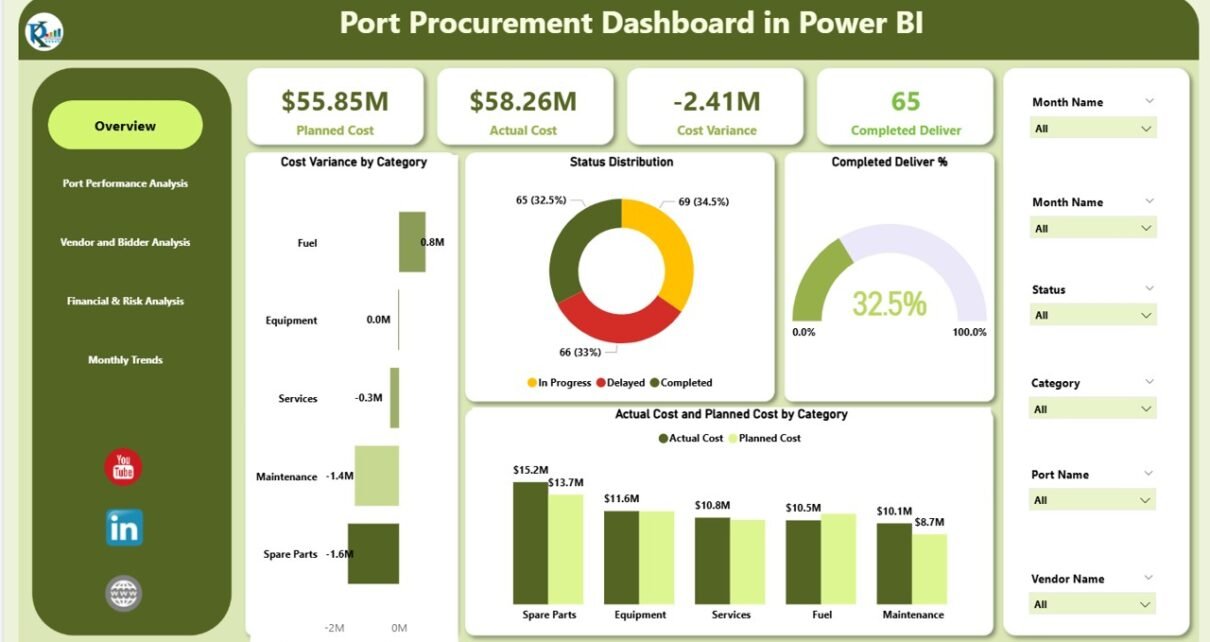
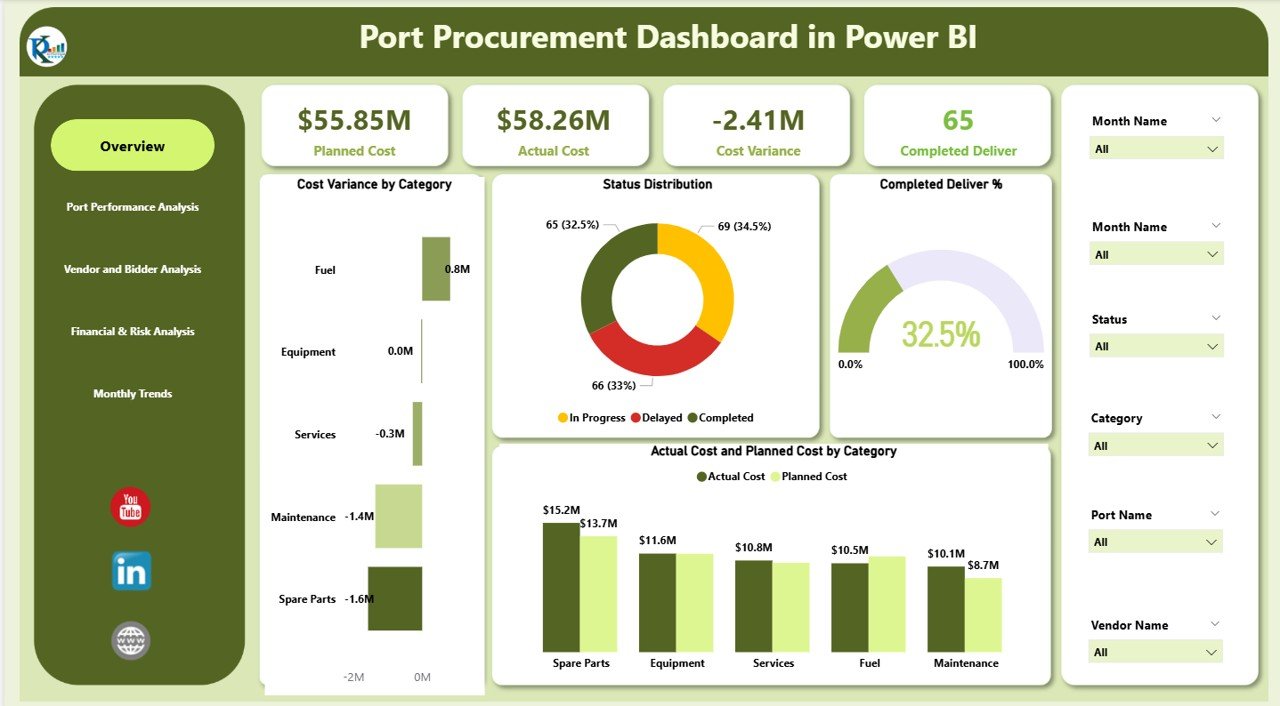
Overview Section
The Overview section provides a quick snapshot of overall procurement health.
KPI Cards
The dashboard displays the following KPI cards:
-
Planned Cost – Total planned procurement budget
-
Actual Cost – Total actual procurement spend
-
Cost Variance – Difference between planned and actual cost
-
Completed Deliver – Number of deliveries completed
These cards instantly highlight whether procurement activities stay within budget and on schedule.
Overview Charts
The overview section also includes high-impact visuals:
Cost Variance by Category
Helps identify which procurement categories experience overruns or savings.
Status Distribution
Shows the distribution of procurement orders by status (Completed, In Progress, Delayed).
Completed Deliver %
Highlights delivery completion efficiency.
Actual Cost and Planned Cost by Category
Enables quick comparison between planned and actual spend across categories.
Together, these visuals provide immediate insight into procurement efficiency and financial control.
Click to Buy Port Procurement Dashboard in Power BI
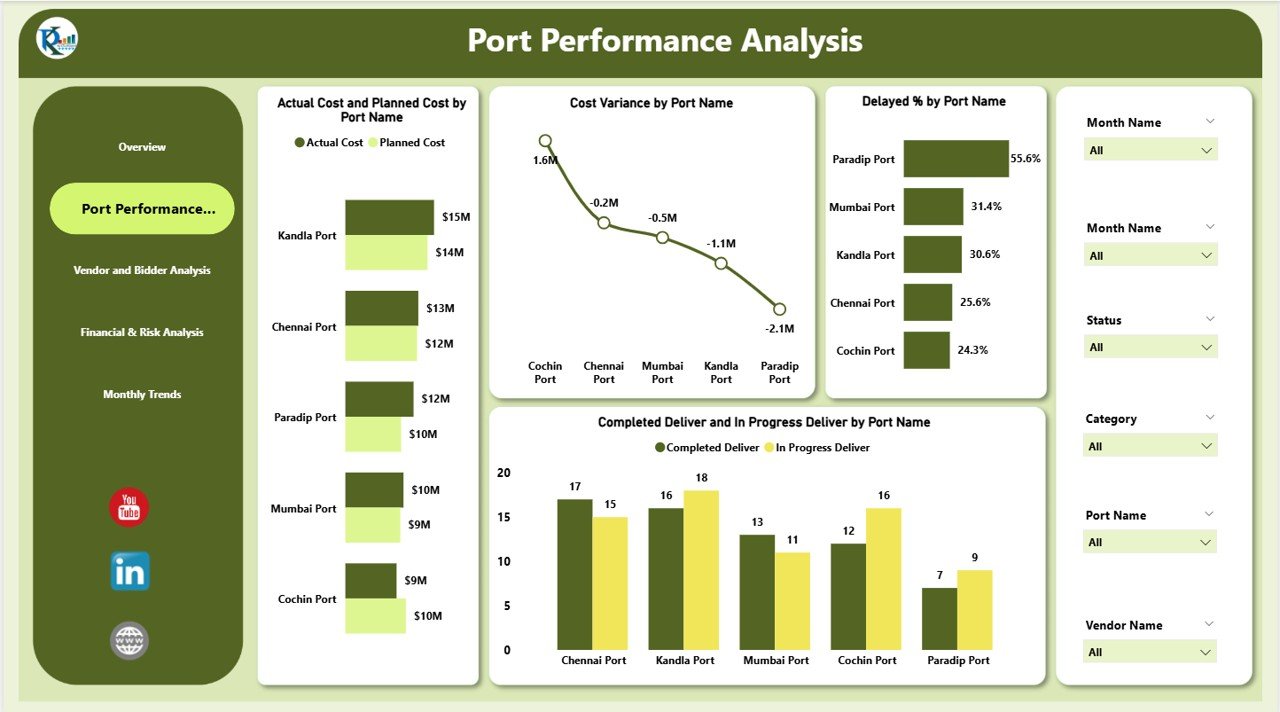
Port Performance Analysis
This section evaluates procurement performance across different ports.
Charts Included
-
Actual Cost and Planned Cost by Port Name
-
Cost Variance by Port Name
-
Delayed % by Port Name
-
Completed Deliver and In Progress Deliver by Port Name
This analysis helps decision-makers identify:
-
High-performing ports
-
Ports facing delivery delays
-
Cost overruns by location
-
Ports requiring process improvement
As a result, port authorities can take targeted corrective actions.
Click to Buy Port Procurement Dashboard in Power BI
Vendor and Bidder Analysis
Vendor performance plays a critical role in procurement success. Therefore, this section focuses on supplier efficiency and reliability.
Charts Included
-
Actual Cost and Planned Cost by Vendor Name
-
Completed Deliver % by Vendor Name
-
In Progress Deliver and Completed Deliver by Vendor Name
These visuals help procurement teams:
-
Compare vendor cost performance
-
Identify reliable suppliers
-
Detect vendors causing delays
-
Improve vendor selection strategies
Consequently, ports can reduce risk and improve supplier accountability.

Click to Buy Port Procurement Dashboard in Power BI
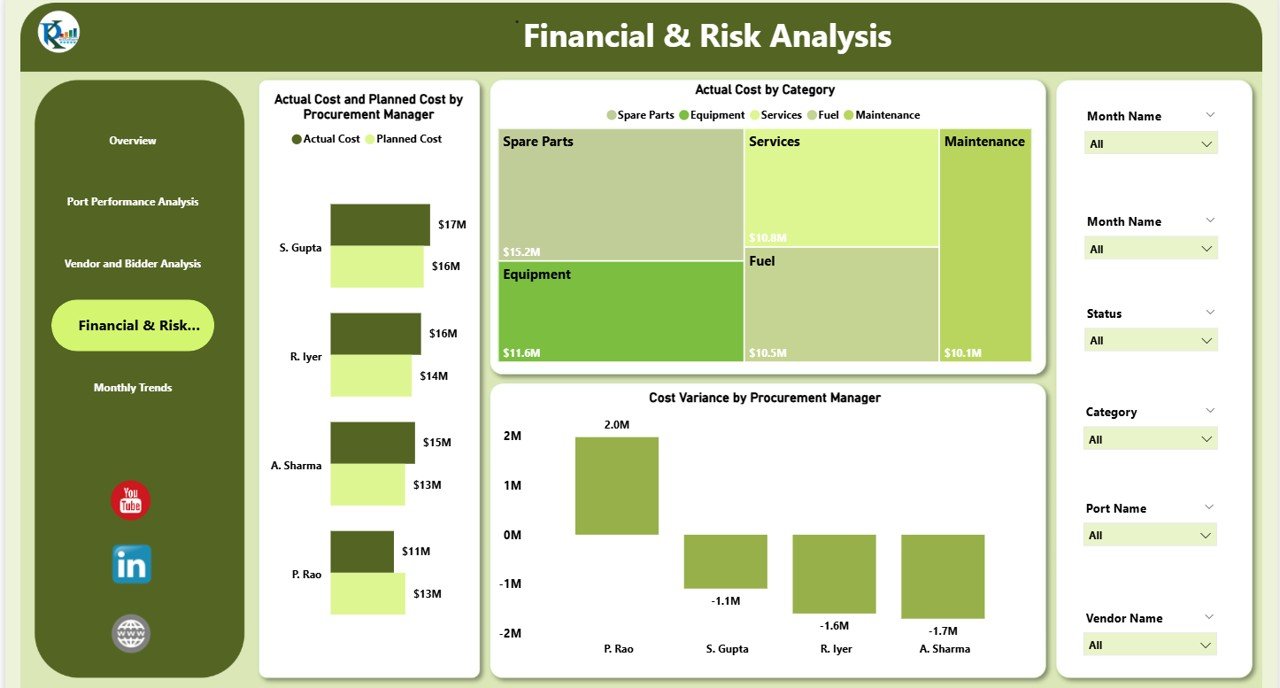
Financial & Risk Analysis
This section supports strategic financial control and risk management.
Charts Included
-
Actual Cost and Planned Cost by Procurement Manager
-
Actual Cost by Category
-
Cost Variance by Procurement Manager
This analysis highlights:
-
Manager-level cost control
-
Budget accountability
-
Risk exposure due to overspending
-
Areas requiring governance improvements
As a result, leadership gains better financial transparency.
Click to Buy Port Procurement Dashboard in Power BI
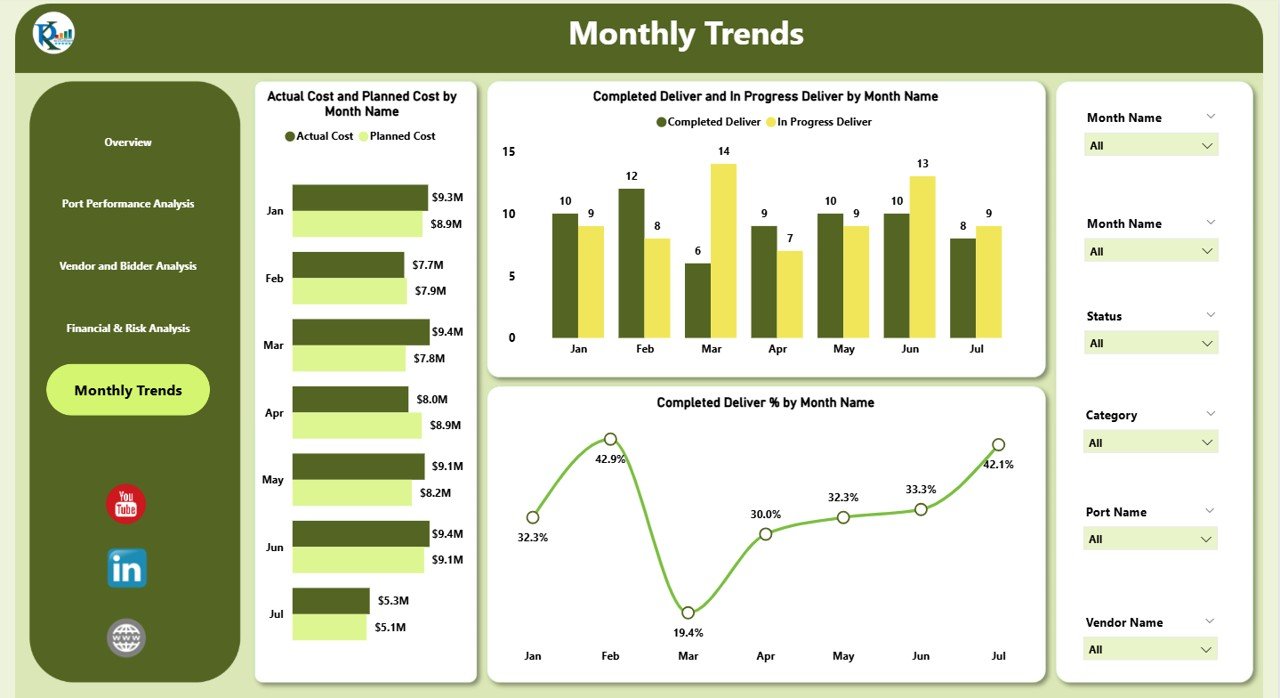
Monthly Trends Analysis
Understanding trends over time is essential for long-term improvement. Therefore, the dashboard includes a dedicated Monthly Trends section.
Charts Included
-
Actual Cost and Planned Cost by Month Name
-
Completed Deliver and In Progress Deliver by Month Name
-
Completed Deliver % by Month Name
These visuals help teams:
-
Track seasonal procurement patterns
-
Identify recurring delays
-
Improve forecasting accuracy
-
Plan future procurement cycles more effectively
Click to Buy Port Procurement Dashboard in Power BI
Why Ports Need a Procurement Dashboard in Power BI
Port procurement involves high value, high risk, and high complexity. Without structured analytics, issues remain hidden until it is too late. A Power BI procurement dashboard helps ports:
-
Gain real-time visibility into costs and deliveries
-
Reduce procurement risks
-
Improve vendor accountability
-
Enhance financial discipline
-
Support data-driven decisions
As a result, ports operate more efficiently and competitively.
Advantages of the Port Procurement Dashboard in Power BI
1. Centralized Procurement Visibility
All procurement KPIs stay in one interactive dashboard.
2. Faster Decision-Making
Visual insights reduce analysis time significantly.
3. Better Cost Control
Planned vs actual cost comparisons highlight overruns early.
4. Improved Delivery Performance
Delay percentages expose operational bottlenecks.
5. Enhanced Vendor Management
Vendor-level analysis improves supplier selection.
6. Executive-Ready Reporting
Dashboards are presentation-ready and easy to share.
Opportunities for Improvement in Port Procurement Analytics
Click to Buy Port Procurement Dashboard in Power BI
Even with a strong dashboard, continuous improvement remains essential.
Key Opportunities
-
Integrate real-time ERP or SAP data
-
Add SLA-based delivery tracking
-
Include contract compliance metrics
-
Add predictive analytics for cost overruns
-
Track sustainability and ESG-related procurement KPIs
These enhancements can further strengthen procurement governance.
Best Practices for Using the Port Procurement Dashboard
Click to Buy Port Procurement Dashboard in Power BI
1. Update Data Regularly
Ensure accurate insights by refreshing data frequently.
2. Monitor Cost Variance Weekly
Early detection prevents major budget overruns.
3. Review Vendor Performance Monthly
Use insights to renegotiate or reassign vendors.
4. Use Filters During Review Meetings
Drill down by port, category, or vendor for clarity.
5. Align KPIs with Procurement Goals
Ensure metrics reflect operational priorities.
Conclusion
The Port Procurement Dashboard in Power BI transforms complex procurement data into clear, actionable insights. It empowers port authorities and procurement teams to control costs, improve delivery performance, manage vendor risk, and make confident decisions. Because the dashboard is interactive, visual, and scalable, it becomes an essential tool for modern port operations.
With proper use and continuous improvement, this dashboard can significantly enhance procurement efficiency and financial discipline across port ecosystems.
Frequently Asked Questions (FAQs)
1. Who should use the Port Procurement Dashboard in Power BI?
Port authorities, procurement teams, finance teams, and senior management.
2. Can this dashboard handle large procurement datasets?
Yes, Power BI handles large datasets efficiently.
3. Is the dashboard customizable?
Yes, KPIs, visuals, and filters can be customized.
4. Can it integrate with ERP systems?
Yes, Power BI supports multiple data connectors.
5. Does it support trend analysis?
Yes, monthly and historical trend charts are included.
6. Is it suitable for executive reporting?
Yes, the dashboard is presentation-ready.
Visit our YouTube channel to learn step-by-step video tutorials
Watch the step-by-step video tutorial:
Click to Buy Port Procurement Dashboard in Power BI