Healthcare organizations manage thousands of procurement transactions every year. These include medicines, medical equipment, consumables, services, and infrastructure-related purchases. Because procurement directly impacts patient care, cost control, and compliance, healthcare leaders need clear visibility into procurement performance. However, when procurement data stays scattered across spreadsheets and systems, decision-making becomes slow and reactive.
That is exactly why a Health Procurement Dashboard in Power BI becomes a powerful solution. This ready-to-use dashboard converts complex procurement data into clear, visual, and actionable insights. It helps healthcare procurement teams monitor costs, track order status, evaluate vendor performance, and control delivery risks—all from a single interactive dashboard.
In this article, we will explain the Health Procurement Dashboard in Power BI, its structure, key metrics, visualizations, and how it supports smarter procurement decisions in healthcare organizations.
What Is a Health Procurement Dashboard in Power BI?
Click to Buy Health Procurement Dashboard in Power BI
A Health Procurement Dashboard in Power BI is an interactive reporting solution designed to analyze and monitor procurement performance across hospitals and healthcare facilities. It consolidates planned costs, actual costs, savings, order status, delays, and vendor performance into one centralized dashboard.
Because the dashboard is built in Power BI, it provides:
-
Real-time data visualization
-
Interactive filtering and drill-down
-
Clear performance tracking
-
Easy sharing across departments
-
Scalable reporting for large healthcare systems
As a result, procurement managers, finance teams, and hospital administrators gain better control over spending and delivery performance.
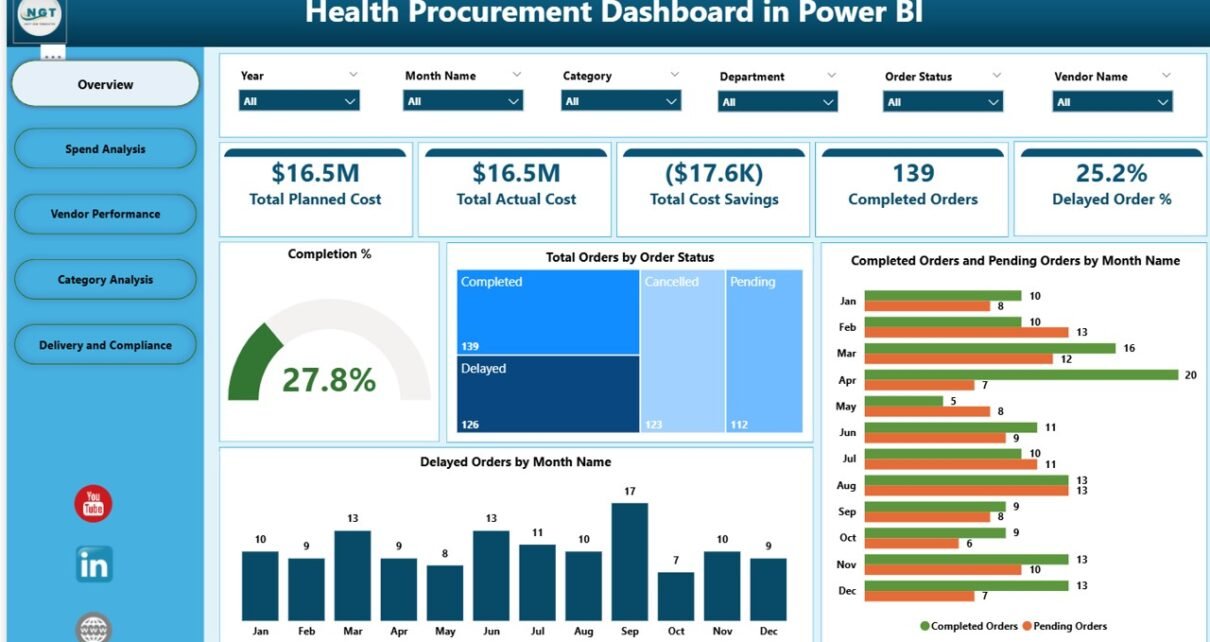
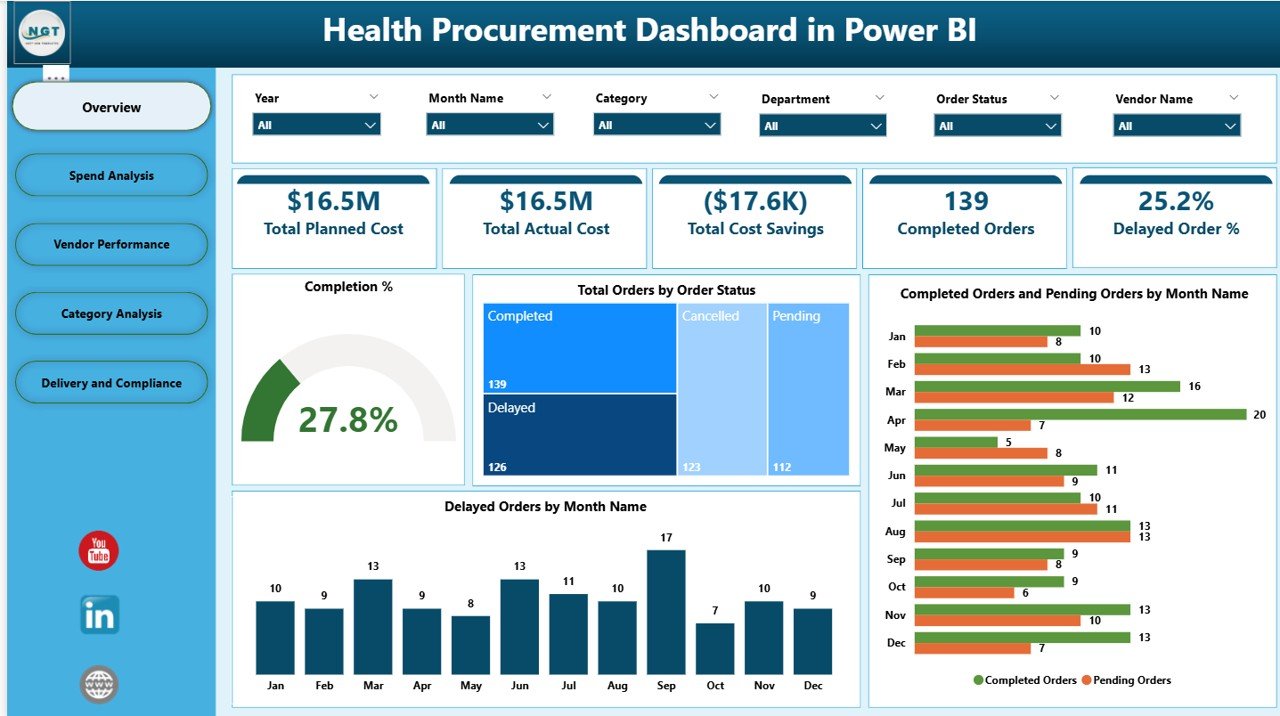
Overview Section
The Overview section gives a high-level summary of procurement performance using KPI cards and trend charts. This section supports quick decision-making for leadership.
KPI Cards in the Overview Section
The dashboard displays the following key cards:
-
Total Planned Cost – Total budgeted procurement cost
-
Total Actual Cost – Actual amount spent on procurement
-
Total Cost Savings – Difference between planned and actual cost
-
Completed Orders – Number of successfully completed orders
-
Delayed Order % – Percentage of orders delivered late
These cards provide an instant understanding of cost efficiency and delivery reliability.
Charts in the Overview Section
Completion %
Shows the percentage of orders completed successfully. This metric highlights overall procurement execution quality.
Total Orders by Order Status
Displays the distribution of orders by status, such as Completed, Pending, Delayed, or Cancelled.
Completed Orders and Pending Orders by Month Name
Helps teams understand monthly procurement progress and identify backlogs.
Delayed Orders by Month Name
Shows trends in delayed deliveries across months, helping teams identify seasonal or operational issues.
Click to Buy Health Procurement Dashboard in Power BI
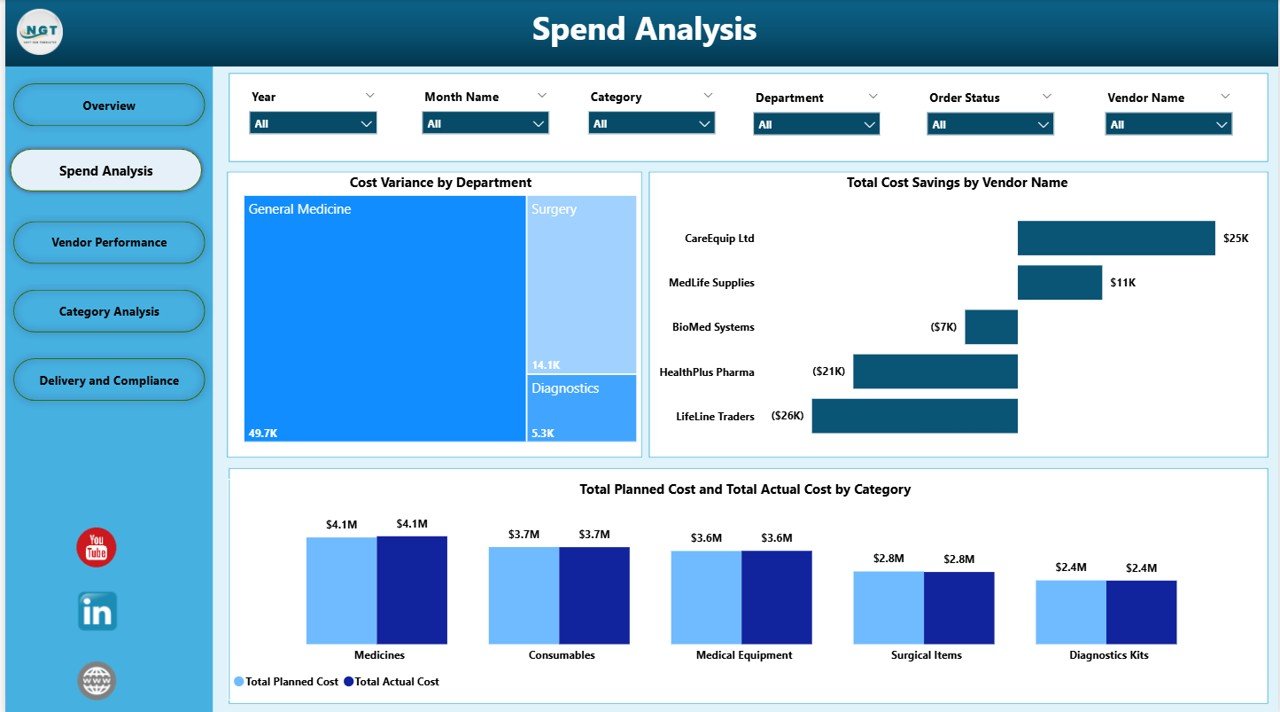
Spend Analysis – Cost Control and Savings Visibility
The Spend Analysis section focuses on cost efficiency and savings across departments, vendors, and categories.
Key Charts in Spend Analysis
Cost Variance by Department
Shows which departments exceed or stay within procurement budgets.
Total Cost Savings by Vendor Name
Identifies vendors that consistently deliver cost savings.
Total Planned Cost and Total Actual Cost by Category
Compares budgeted vs actual spending across procurement categories such as medical supplies, equipment, or services.
This section helps healthcare organizations control procurement costs while maintaining quality standards.
Click to Buy Health Procurement Dashboard in Power BI
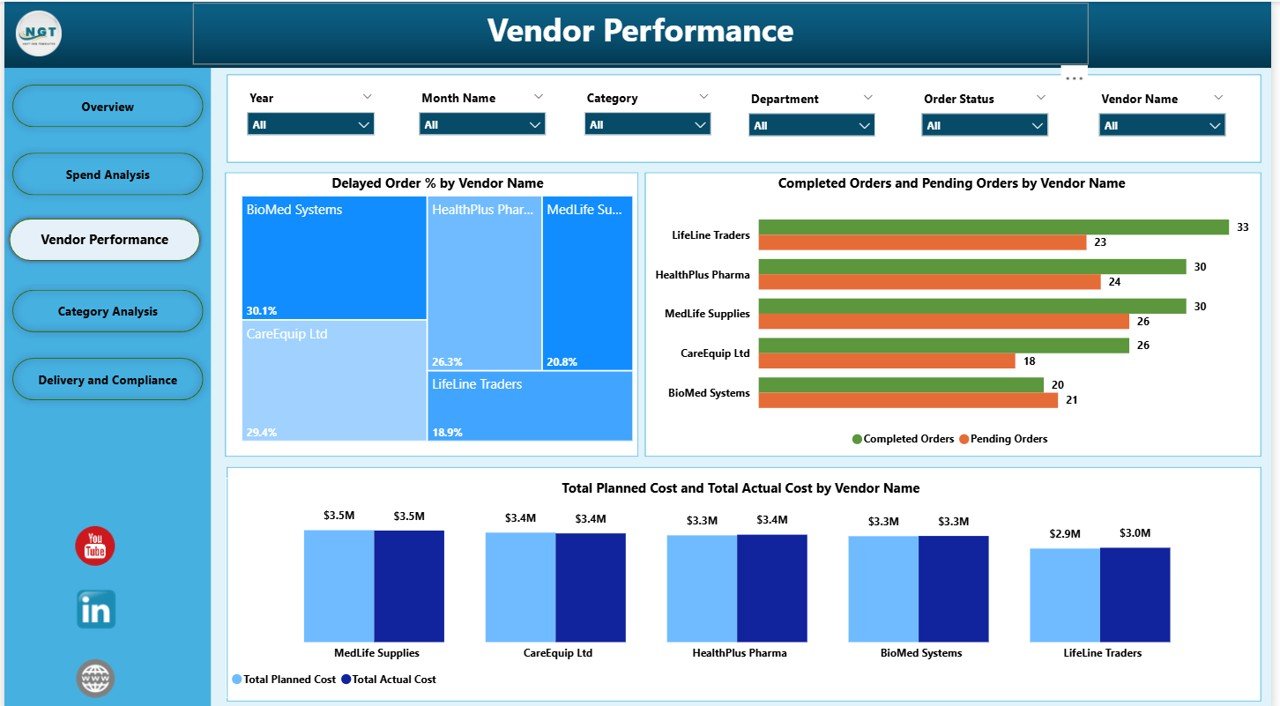
Vendor Performance – Supplier Reliability and Risk Monitoring
Vendor reliability plays a critical role in healthcare procurement. Delayed or incomplete deliveries can directly affect patient care.
Charts in Vendor Performance
Delayed Order % by Vendor Name
Highlights suppliers with frequent delivery delays.
Completed Orders and Pending Orders by Vendor Name
Shows vendor-level order fulfillment performance.
Total Planned Cost and Total Actual Cost by Vendor Name
Helps evaluate vendor pricing accuracy and cost control.
This section supports data-driven vendor evaluation, contract renegotiation, and supplier risk management.
Click to Buy Health Procurement Dashboard in Power BI
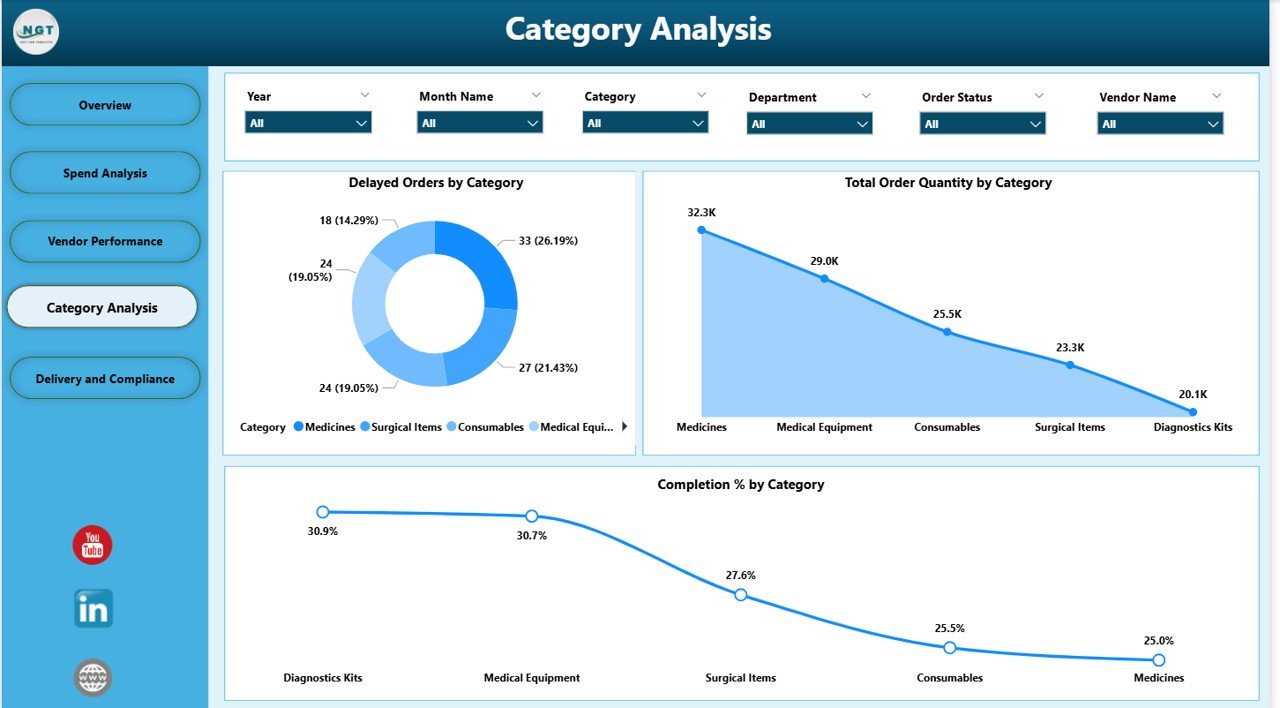
Category Analysis – Procurement Demand and Efficiency
The Category Analysis section analyzes procurement performance across different product and service categories.
Key Charts in Category Analysis
Delayed Orders by Category
Identifies which procurement categories experience frequent delays.
Total Order Quantity by Category
Shows demand volume across categories.
Completion % by Category
Highlights categories with strong or weak procurement execution.
This analysis helps procurement teams optimize sourcing strategies and inventory planning.
Click to Buy Health Procurement Dashboard in Power BI
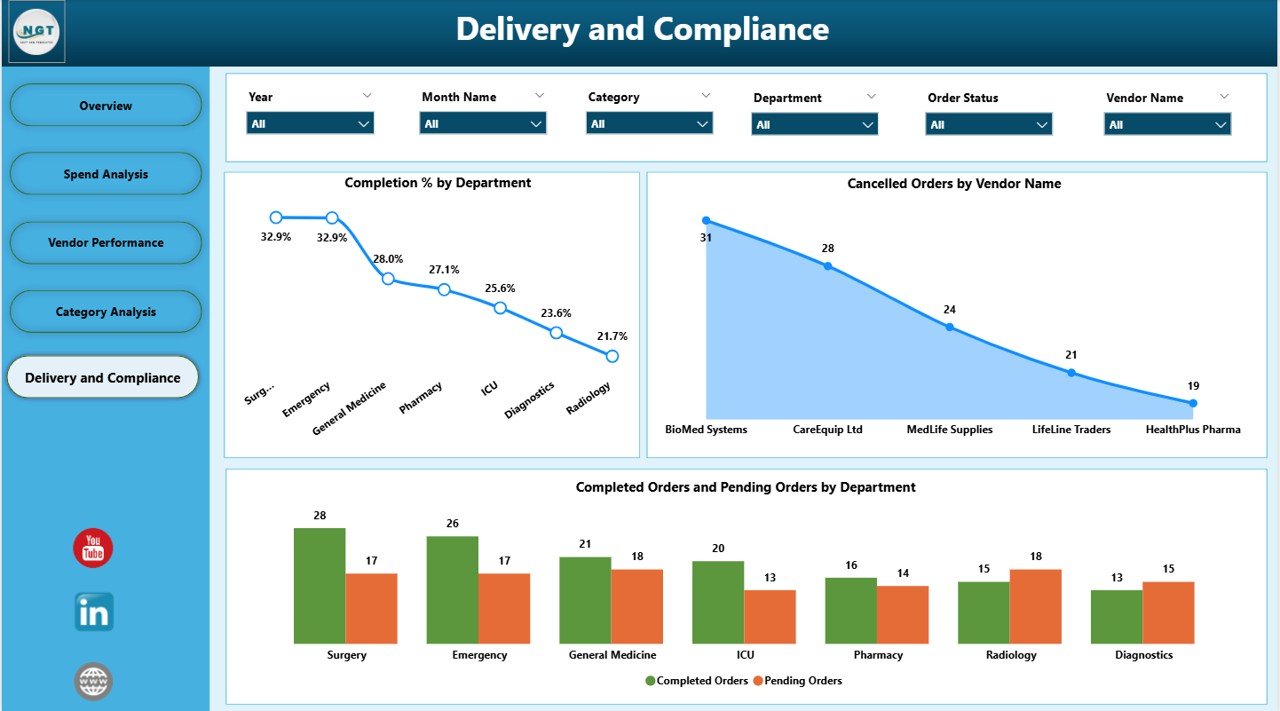
Delivery and Compliance – Operational Execution Tracking
Timely delivery and compliance are essential in healthcare procurement.
Charts in Delivery and Compliance
Completion % by Department
Shows how effectively each department completes procurement orders.
Cancelled Orders by Vendor Name
Identifies vendors with high cancellation rates.
Completed Orders and Pending Orders by Department
Helps managers understand departmental procurement efficiency.
This section improves accountability and helps reduce operational risks.
Click to Buy Health Procurement Dashboard in Power BI
Why Healthcare Organizations Need This Dashboard
Healthcare procurement involves high spend, strict compliance, and time-sensitive deliveries. This dashboard helps organizations:
-
Improve cost transparency
-
Reduce delayed and cancelled orders
-
Strengthen vendor accountability
-
Monitor procurement performance in real time
-
Support data-driven procurement decisions
With a single Power BI dashboard, teams move from reactive reporting to proactive procurement management.
Advantages of the Health Procurement Dashboard in Power BI
Click to Buy Health Procurement Dashboard in Power BI
Centralized Procurement Visibility
All procurement metrics remain available in one dashboard.
Improved Cost Control
Planned vs actual cost analysis highlights savings opportunities.
Better Vendor Management
Vendor performance insights support smarter supplier decisions.
Operational Efficiency
Order status and delay tracking improve delivery planning.
Executive-Friendly Reporting
Interactive visuals simplify complex procurement data.
Scalable and Customizable
The dashboard adapts easily to multiple hospitals or departments.
Opportunities for Improvement in Health Procurement Analytics
Although this dashboard is powerful, organizations can further enhance it by adding:
-
SLA breach tracking
-
Contract compliance indicators
-
Automated alerts for delayed orders
-
Inventory integration
-
Forecasting and demand planning models
-
Risk scoring for critical vendors
These enhancements strengthen long-term procurement strategy.
Best Practices for Using the Health Procurement Dashboard
Click to Buy Health Procurement Dashboard in Power BI
-
Update procurement data regularly
-
Review delayed orders weekly
-
Monitor cost variance monthly
-
Use vendor performance insights for negotiations
-
Share insights with finance and operations teams
-
Track trends, not just monthly values
Consistent usage ensures maximum value from the dashboard.
Conclusion
A Health Procurement Dashboard in Power BI provides healthcare organizations with complete visibility into procurement costs, order execution, vendor performance, and delivery risks. By combining financial metrics with operational insights, the dashboard enables smarter decisions, stronger cost control, and improved procurement efficiency.
Visit our YouTube channel to learn step-by-step video tutorials
Watch the step-by-step video tutorial:
Click to Buy Health Procurement Dashboard in Power BI