Introduction
The Hearing Aid Services KPI Dashboard is a comprehensive, ready-to-use Excel template designed to help hearing aid service providers track and analyze their key performance indicators efficiently. This intuitive dashboard consolidates vital data such as monthly targets, actuals, trends, and historical comparisons, all in one location. If you want to improve operational oversight and ensure your hearing aid services meet their goals, this KPI dashboard is an essential tool.
Key Features of Hearing Aid Services KPI Dashboard
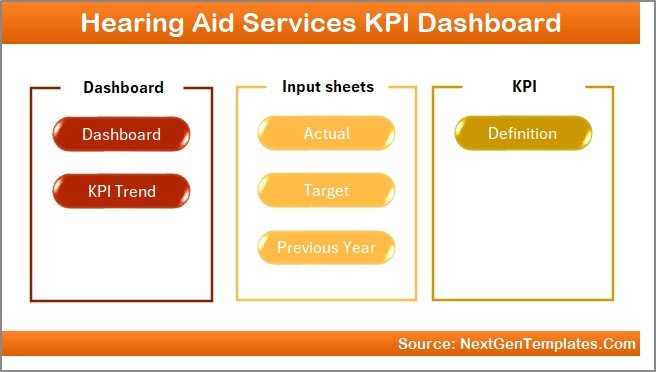
- Seven interactive and well-structured worksheets for holistic KPI management.
- Dynamic month selection to instantly update dashboard data for current or historical review.
- Detailed comparisons including Month-To-Date (MTD), Year-To-Date (YTD), and Previous Year (PY) values.
- Conditional formatting with intuitive up/down arrows to quickly identify performance trends relative to targets and last year’s data.
- KPI definitions, formulas, and types clearly specified to ensure everyone understands measurement criteria.
- Easy data entry sheets designed for actual, target, and previous year figures, allowing quick updates without tampering with dashboard formulas.
- Visual trend charts to track KPI movements over time for actionable insights.
Dashboard Pages Explanation
1. Home Sheet
This acts as the dashboard’s main index page, making navigation simple and fast. From here, users can jump directly to any of the six other worksheet tabs with convenient buttons.
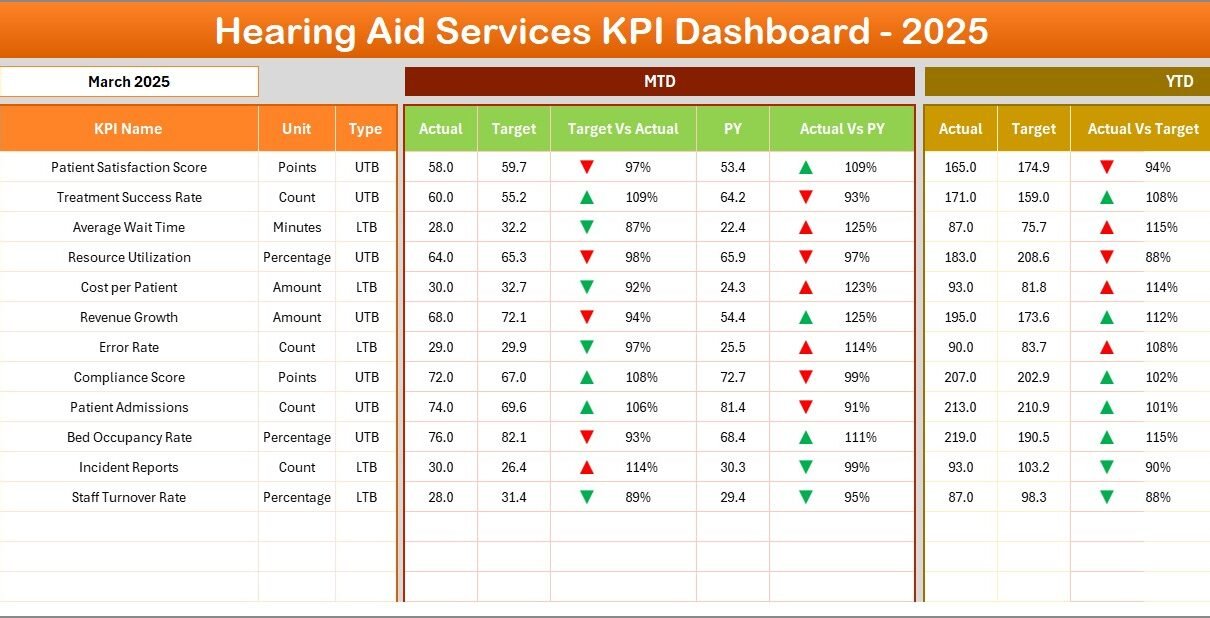
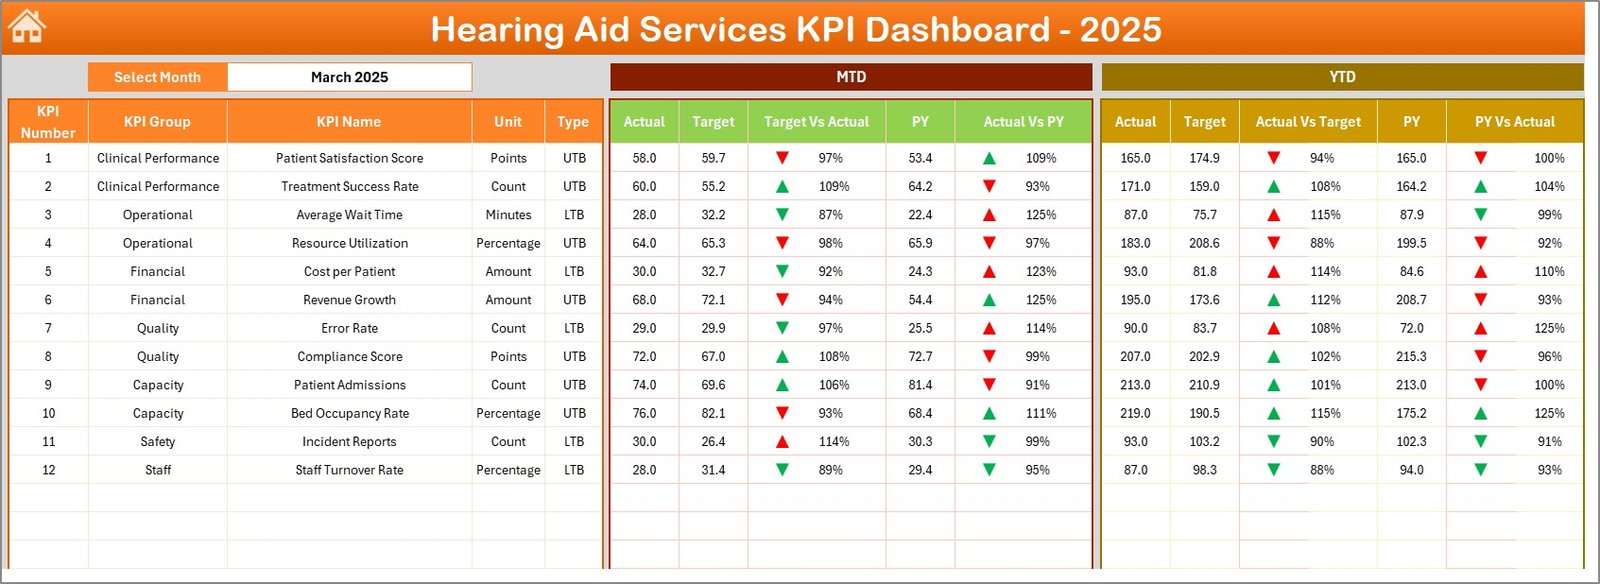
2. Dashboard Sheet
This is the core of the template where all KPI data comes together. Users can select the month from a drop-down menu located at cell D3, instantly updating MTD and YTD figures across KPIs.
- MTD metrics include Actual, Target, Previous Year, along with visual indicators to grasp performance versus goals.
- YTD data mirrors the same structure, giving a broader perspective of ongoing performance.
- Clear conditional formatting helps users spot positive or negative trends quickly.
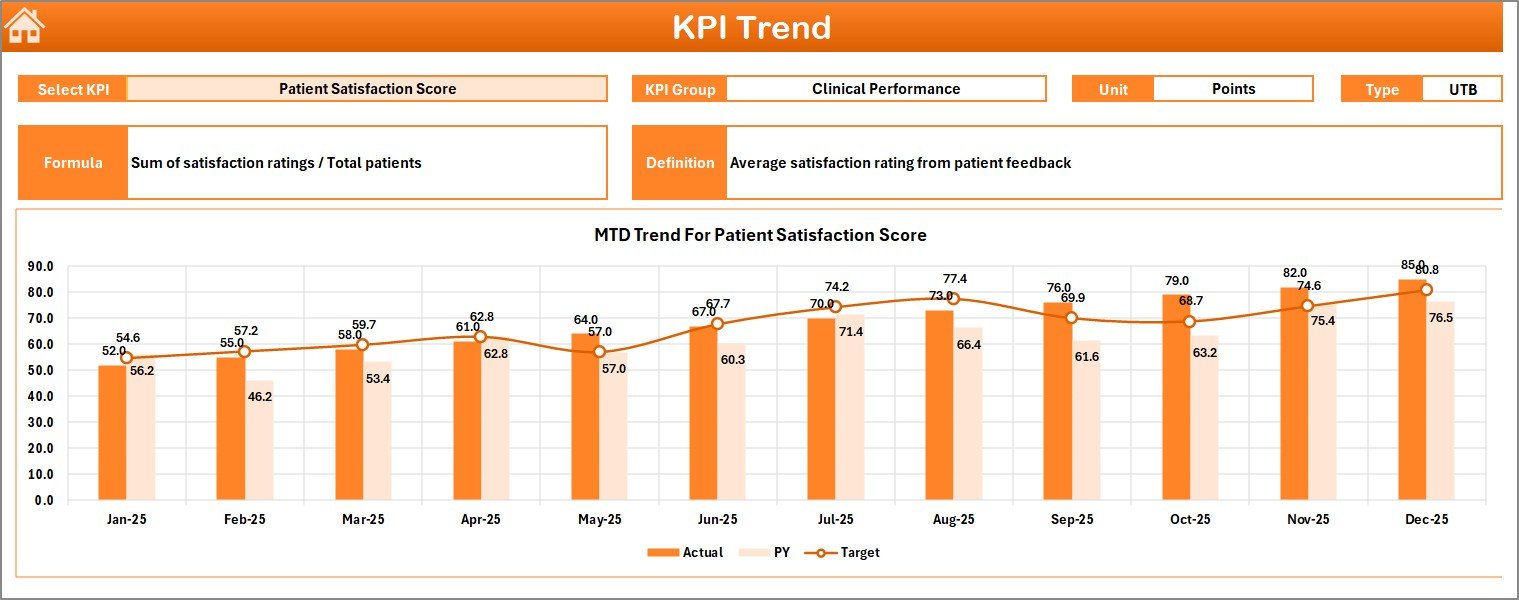
3. KPI Trend Sheet
On this sheet, you can select any KPI from the drop-down menu (cell C3) to view detailed information, including:
- KPI Group and Unit of Measurement
- Type of KPI – whether Lower The Better (LTB) or Upper The Better (UTB)
- Formula and Definition to clarify how each KPI is calculated
This sheet features MTD and YTD trend charts plotting Actual, Target, and Previous Year values to visualize changes over time.
KPI Trend Sheet
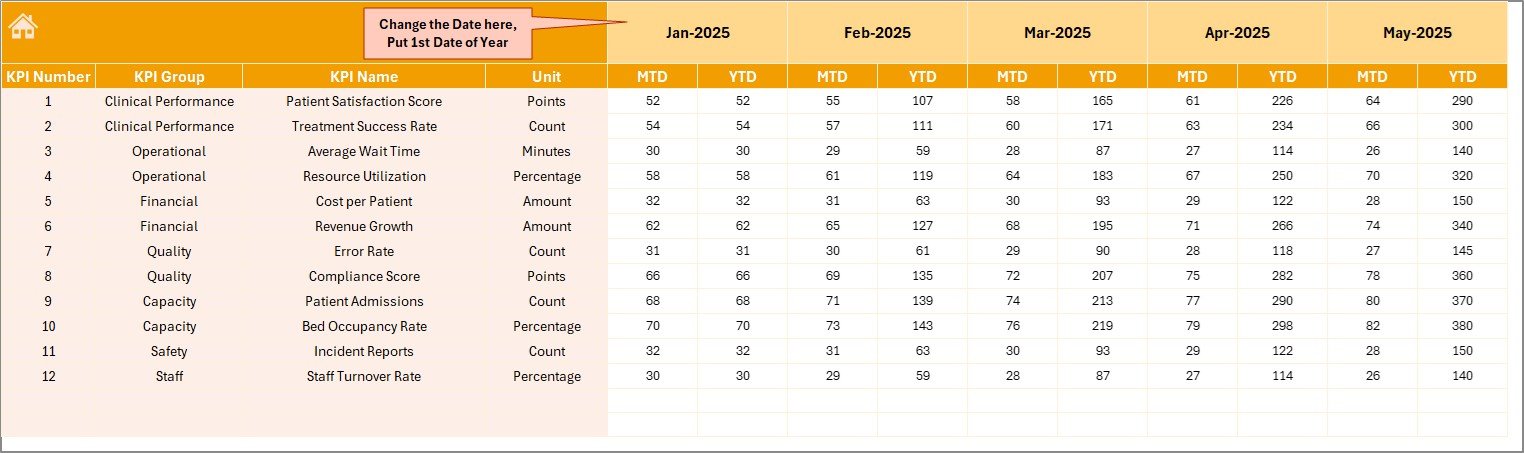
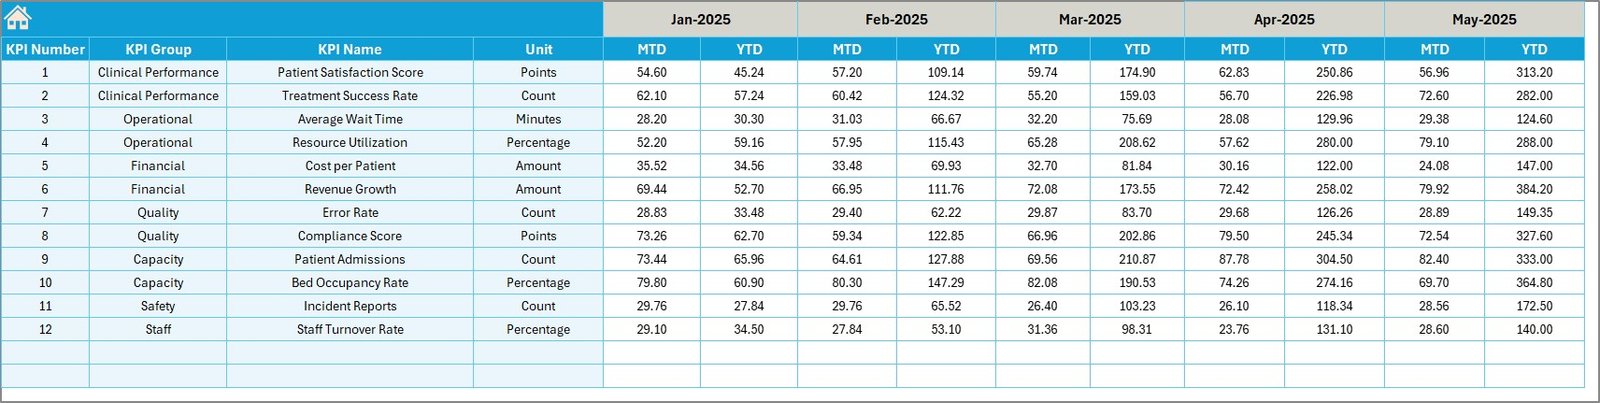
4. Actual Numbers Input Sheet
This sheet is dedicated to entering monthly actual performance data. You can change the reporting months by updating the first month of the year in cell E1. This flexibility helps tailor the dashboard to any fiscal calendar.
5. Target Number Input Sheet
Enter the target MTD and YTD values for each KPI here. This data forms the benchmark for performance evaluation within the Dashboard sheet.
Target Number Input sheet
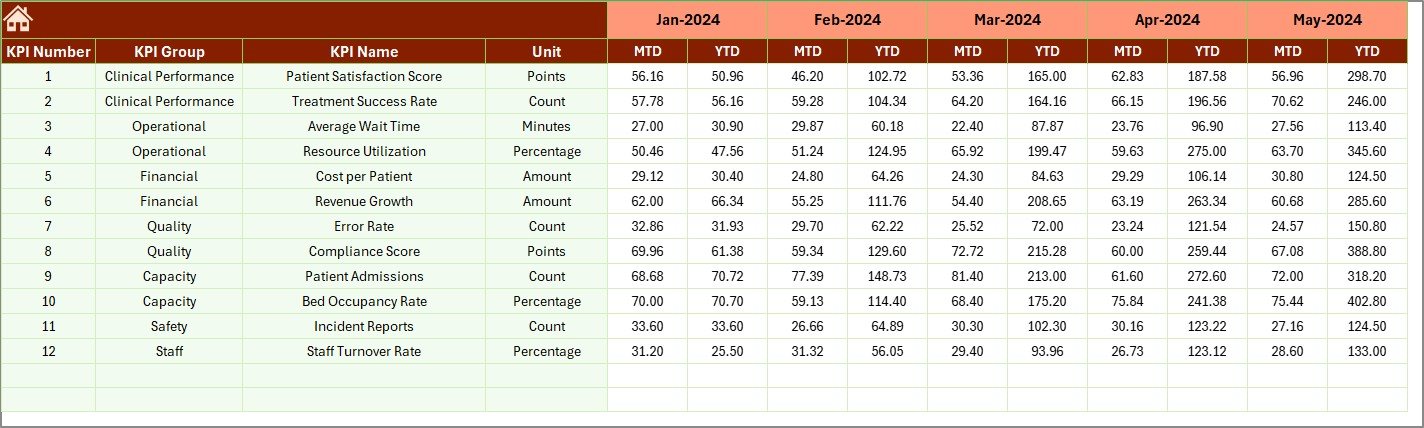
6. Previous Year Number Input Sheet
Just like the actuals and targets, entering historical data is streamlined here. Add previous year numbers to enable effective year-over-year comparisons.
7. KPI Definition Sheet
This is the knowledge base of your KPIs. Here, you define each KPI’s name, the group it belongs to, unit of measurement, formula used, and its detailed description. Also, specify whether the KPI is LTB (Lower The Better) or UTB (Upper The Better), essential for conditional formatting and reporting logic.
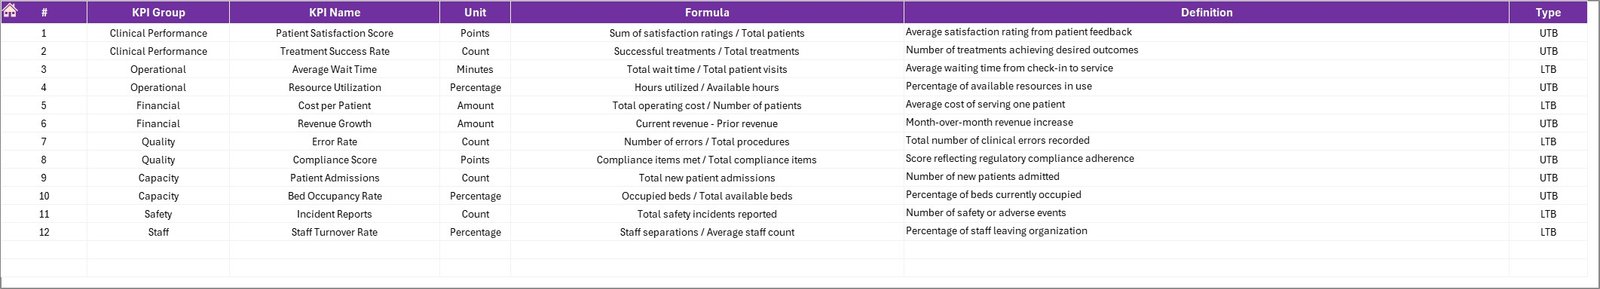
KPI Definition sheet
Advantages of Hearing Aid Services KPI Dashboard
- Holistic Visibility: All KPIs in one place enable quick decision-making.
- Time Efficiency: Automated month selection and data linking reduce manual efforts.
- Data Accuracy: Clear input sheets help prevent errors in reporting.
- Improved Accountability: Conditional formatting highlights areas needing attention.
- Enhanced Communication: KPI definitions make it easy for teams to understand performance metrics uniformly.
Opportunities for Improvement
Click to Buy Hearing Aid Services KPI Dashboard in Excel
- Integrate real-time data connections with your Healthcare Management Systems.
- Add dynamic visualizations like heat maps or KPI scorecards for deeper insights.
- Expand the dashboard with patient satisfaction metrics or technician efficiency KPIs.
- Implement alerts for underperformance or threshold breaches sent via email or notifications.
Best Practices
- Regularly update the input sheets to maintain dashboard reliability.
- Train your team on KPI definitions to ensure consistent data interpretation.
- Schedule monthly reviews of dashboard insights to align teams on performance goals.
- Backup your dashboard file regularly to avoid data loss.
- Leverage Microsoft’s official Excel support resources for advanced dashboard tweaks.
FAQs
Click to Buy Hearing Aid Services KPI Dashboard in Excel
Q1: Is this Hearing Aid Services KPI Dashboard template compatible with all Excel versions?
Yes, it is designed for Excel 2016 and later versions to ensure full compatibility with dropdowns, conditional formatting, and charts.
Q2: Can I customize KPIs or add new ones?
Absolutely. Use the KPI Definition sheet to add new KPIs and define their formulas and parameters. The dashboard will update accordingly.
Q3: How often should I update the data?
It is best to update actuals, targets, and previous year numbers monthly to maintain accurate and timely insights.
Q4: Can the dashboard track daily performance?
Currently, the dashboard focuses on monthly and yearly data. However, with customization, you could add daily tracking if needed.
Conclusion
The Hearing Aid Services KPI Dashboard offers a well-organized, intuitive, and efficient way to monitor crucial hearing aid service metrics. By centralizing data input and analysis, this ready-to-use template empowers managers and teams to improve service quality, track goals efficiently, and make informed decisions. Incorporate this dashboard in your workflow and take your hearing aid services’ performance management to the next level.
For further learning, explore Microsoft’s detailed Excel dashboard tutorials on their official Learn platform.
Visit our YouTube channel to watch the demo. Youtube.com/@NextGenTemplates
Click to Buy Hearing Aid Services KPI Dashboard in Excel