In today’s healthcare environment, delivering compassionate and high-quality palliative care requires more than just clinical expertise. Healthcare providers must continuously monitor performance, evaluate patient outcomes, and improve service quality. However, when data is scattered across multiple systems, it becomes difficult to track key performance indicators (KPIs) effectively.
So, how can healthcare professionals monitor palliative care performance and make informed decisions?
Palliative Care KPI Dashboard in Power BI.
This powerful and interactive dashboard helps healthcare providers track essential KPIs in real time. Moreover, it transforms complex healthcare data into clear, actionable insights. As a result, organizations can improve patient care, optimize operations, and ensure better outcomes.
What is a Palliative Care KPI Dashboard in Power BI?
Click to Buy Palliative Care KPI Dashboard in Power BI
A Palliative Care KPI Dashboard in Power BI is a data visualization tool designed to track and analyze healthcare performance metrics specifically for palliative care services.
Instead of relying on manual reports, this dashboard allows you to:
- Monitor KPIs in real time
- Compare actual vs target performance
- Analyze trends using MTD and YTD metrics
- Evaluate historical performance
- Understand KPI definitions and formulas
Therefore, it provides a structured and efficient approach to managing palliative care services.
Why Do You Need a Palliative Care KPI Dashboard?
Managing palliative care data manually often leads to inefficiencies and delays. However, with a Power BI dashboard, everything becomes streamlined and effective.
Key Reasons to Use This Dashboard:
- ✅ Centralizes all healthcare KPIs
- ✅ Provides real-time performance tracking
- ✅ Improves patient care quality
- ✅ Enhances decision-making
- ✅ Supports compliance and reporting
As a result, healthcare providers can deliver better care and improve operational efficiency.
Key Features of Palliative Care KPI Dashboard in Power BI
Click to Buy Palliative Care KPI Dashboard in Power BI
This dashboard includes 3 powerful pages, each designed to provide detailed insights.
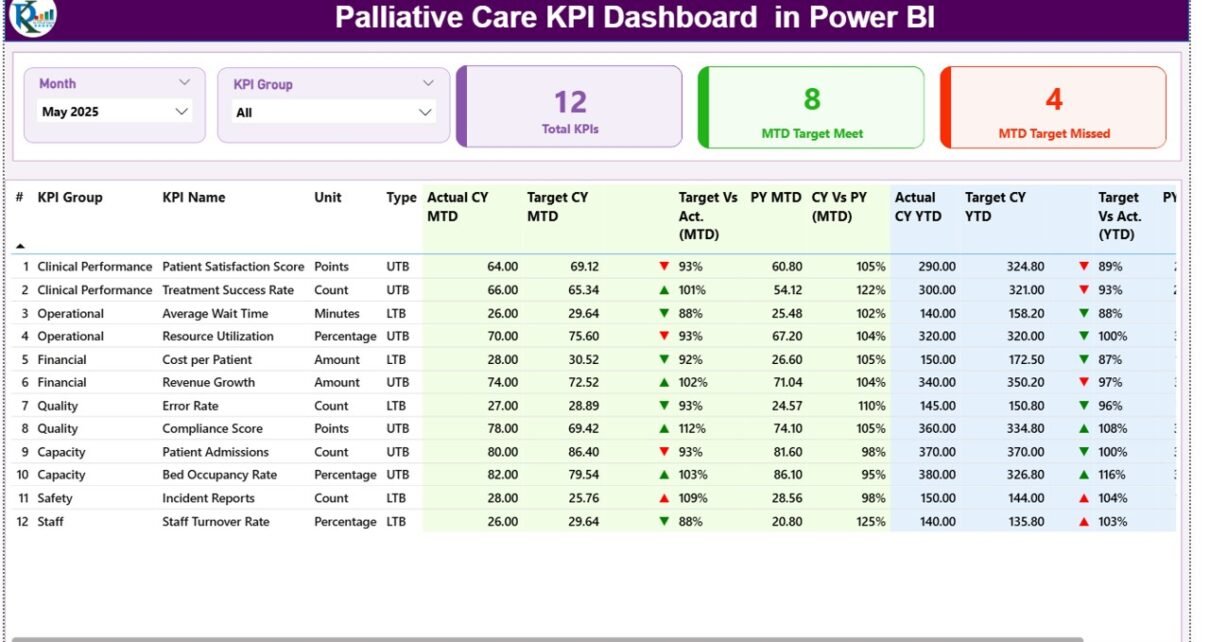
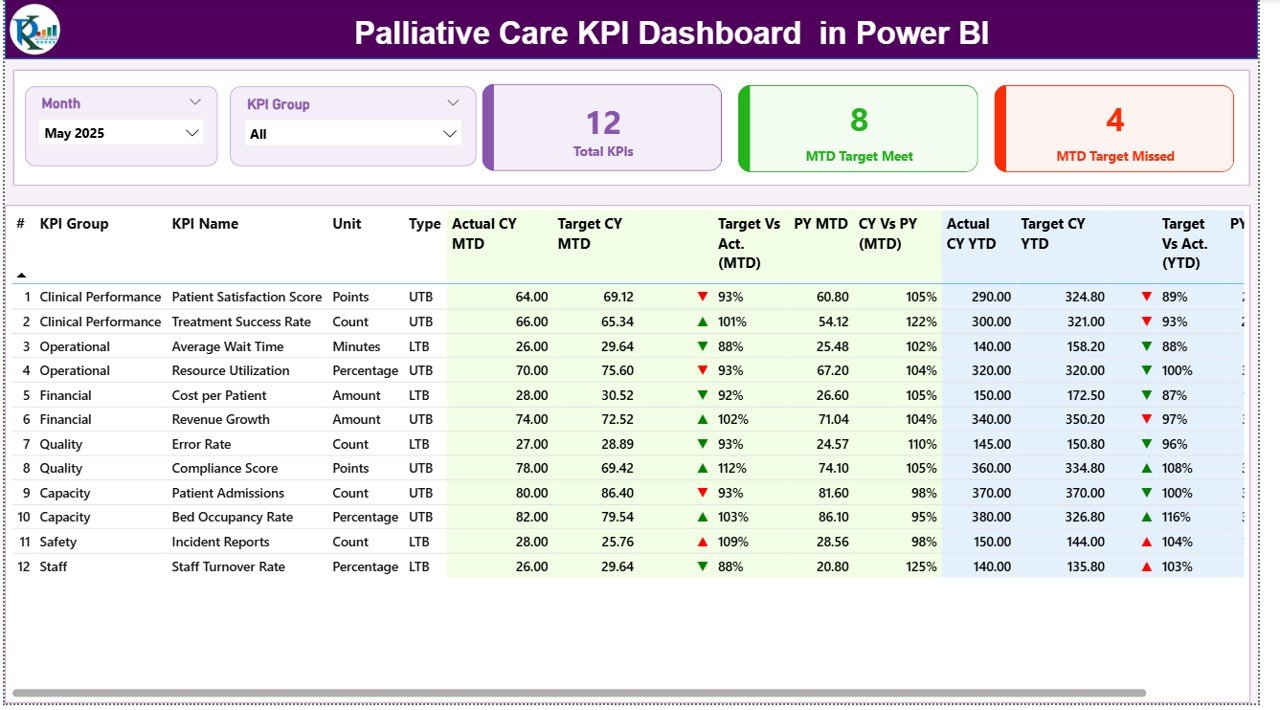
1️⃣ Summary Page – Complete KPI Overview
The Summary Page acts as the main interface of the dashboard.
🔹 Slicers:
- Month selection
- KPI Group selection
🔹 KPI Cards:
- Total KPIs Count
- MTD Target Met Count
- MTD Target Missed Count
🔹 Detailed KPI Table Includes:
- KPI Number – Sequence number
- KPI Group – KPI category
- KPI Name – Metric name
- Unit – Measurement unit
- Type (LTB/UTB) – Lower the Better / Upper the Better
🔹 Performance Metrics:
- Actual CY MTD
- Target CY MTD
- MTD Icon (▲ / ▼ indicators)
- Target vs Actual (MTD %)
- Previous Year MTD
- CY vs PY (MTD %)
- Actual CY YTD
- Target CY YTD
- YTD Icon (▲ / ▼ indicators)
- Target vs Actual (YTD %)
- Previous Year YTD
- CY vs PY (YTD %)
Click to Buy Palliative Care KPI Dashboard in Power BI
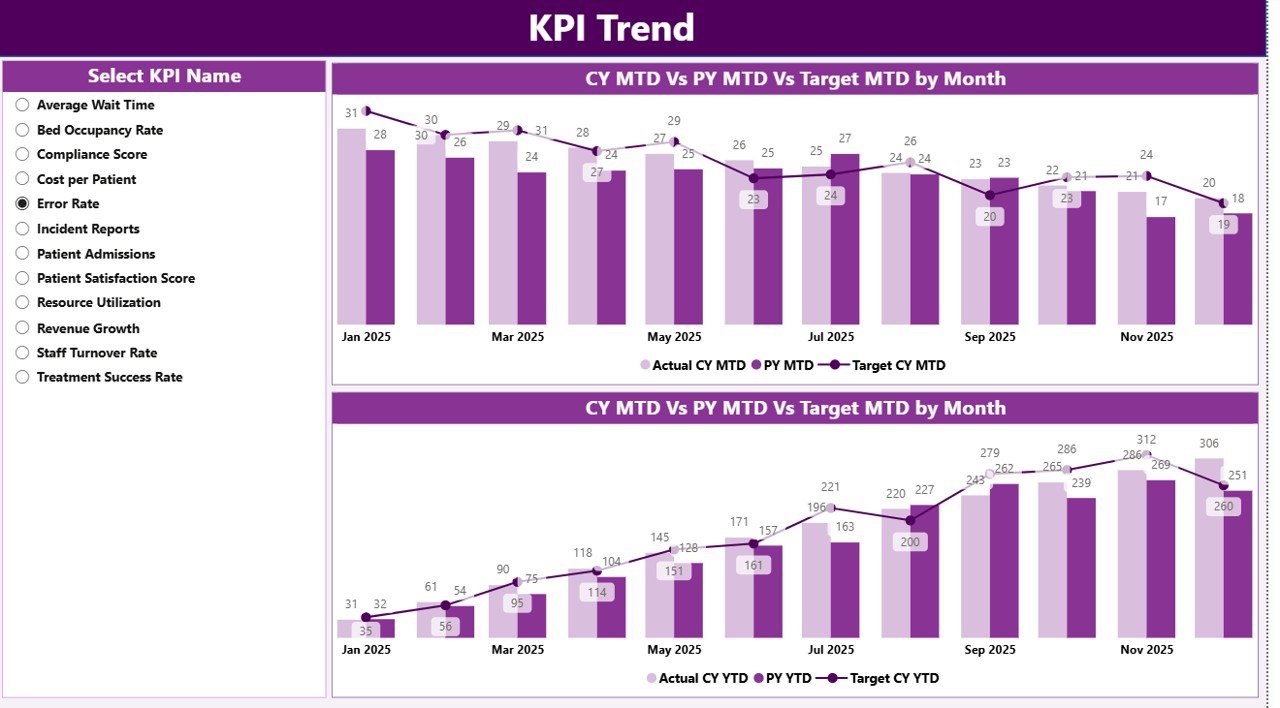
KPI Trend Page – Analyze Performance Over Time
The KPI Trend Page provides detailed trend analysis.
🔹 Features:
- KPI selection slicer
- Two combo charts:
- MTD Performance (Actual vs Target vs Previous Year)
- YTD Performance (Actual vs Target vs Previous Year)
Click to Buy Palliative Care KPI Dashboard in Power BI
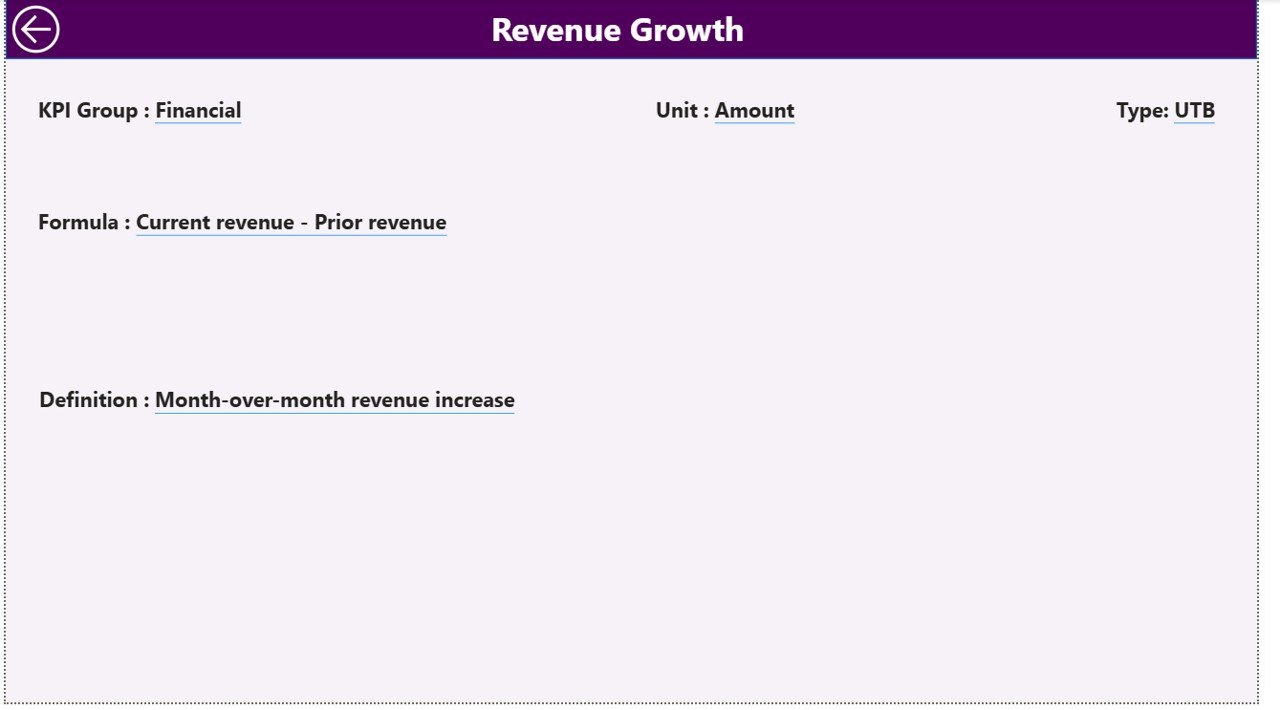
3️⃣ KPI Definition Page – Detailed KPI Insights
This page is a drill-through page and remains hidden by default.
🔹 Includes:
- KPI Formula
- KPI Definition
Excel Data Source – Simple Data Input
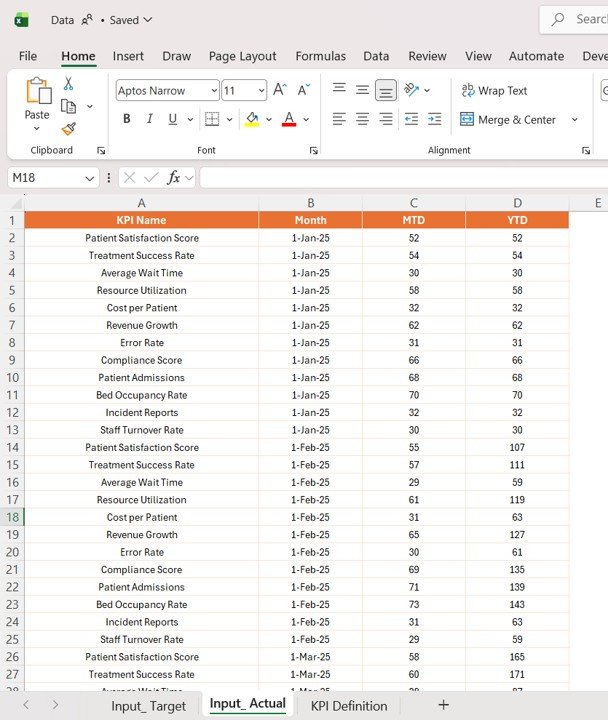
This dashboard uses an Excel file as its data source. You only need to update three sheets:
1️⃣ Input_Actual Sheet
- Enter KPI Name
- Enter Month (first date of the month)
- Input MTD values
- Input YTD values
Click to Buy Palliative Care KPI Dashboard in Power BI
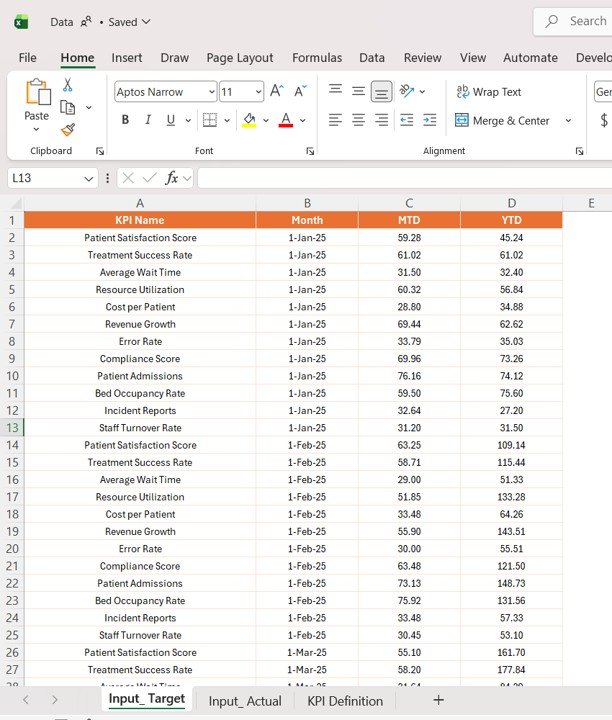
2️⃣ Input_Target Sheet
- Enter KPI Name
- Enter Month
- Input Target MTD values
- Input Target YTD values
Click to Buy Palliative Care KPI Dashboard in Power BI
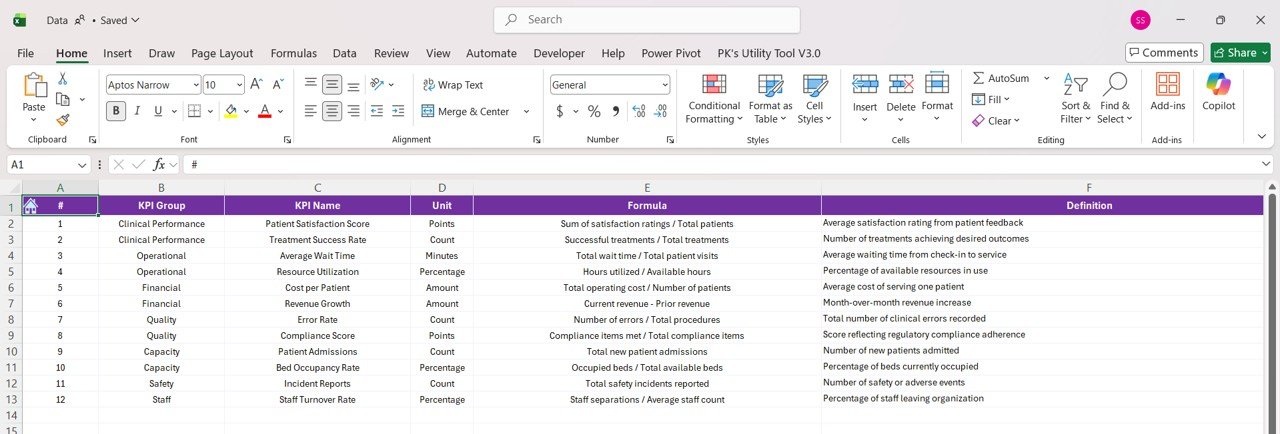
3️⃣ KPI Definition Sheet
- KPI Number
- KPI Group
- KPI Name
- Unit
- Formula
- Definition
- Type (LTB or UTB)
Click to Buy Palliative Care KPI Dashboard in Power BI
Advantages of Palliative Care KPI Dashboard in Power BI
Using this dashboard offers several benefits:
🌟 Improved Patient Care
- Monitor treatment effectiveness
- Identify care gaps
🌟 Real-Time Insights
- Access up-to-date data
- Make faster decisions
🌟 Better KPI Management
- Structured KPI tracking
- Clear performance evaluation
🌟 Enhanced Visualization
- Interactive charts
- Easy-to-understand metrics
🌟 Time-Saving Automation
- Automated calculations
- Reduced manual reporting
How Does This Dashboard Improve Healthcare Outcomes?
Click to Buy Palliative Care KPI Dashboard in Power BI
This dashboard plays a critical role in improving healthcare outcomes.
Here’s how:
- It tracks patient care quality
- It identifies performance gaps
- It compares current vs historical data
- It supports compliance reporting
- It improves operational efficiency
As a result, healthcare providers can deliver better care services.
Best Practices for the Palliative Care KPI Dashboard in Power BI
To maximize results, follow these best practices:
✅ Define Relevant KPIs
- Focus on critical care metrics
- Avoid unnecessary data
✅ Update Data Regularly
- Maintain accuracy
- Ensure real-time insights
✅ Use Slicers Effectively
- Filter data by month and KPI group
- Focus on specific insights
✅ Monitor Trends
- Analyze MTD and YTD performance
- Take proactive actions
✅ Train Your Team
- Ensure proper usage
- Encourage data-driven decisions
Opportunities for Improvement
Click to Buy Palliative Care KPI Dashboard in Power BI
You can enhance this dashboard further:
🔹 Add Predictive Analytics
- Forecast patient outcomes
🔹 Integrate Healthcare Systems
- Connect with EHR/EMR systems
🔹 Include Alerts
- Notify critical KPI changes
🔹 Add Drill-Down Features
- Enable deeper insights
Who Can Benefit from This Dashboard?
This dashboard is ideal for:
- 🏥 Hospitals and healthcare centers
- 👩⚕️ Palliative care teams
- 📊 Healthcare analysts
- 🛡️ Administrators
- 📈 Policy makers
Therefore, anyone involved in palliative care can benefit from this tool.
How to Use the Palliative Care KPI Dashboard?
Click to Buy Palliative Care KPI Dashboard in Power BI
Using this dashboard is simple:
- Enter data in Excel sheets
- Load data into Power BI
- Use slicers to filter KPIs
- Analyze dashboard insights
- Drill through for detailed KPI information
As a result, you can monitor and improve care performance effectively.
Conclusion
Click to Buy Palliative Care KPI Dashboard in Power BI
The Palliative Care KPI Dashboard in Power BI is a powerful solution for tracking and improving healthcare performance. It provides real-time insights, structured KPI tracking, and interactive visualizations.
Moreover, it helps healthcare providers deliver better patient care and make informed decisions. Therefore, if you want to enhance palliative care services, this dashboard is the perfect tool.
Visit our YouTube channel to learn step-by-step video tutorials
Click to Buy Palliative Care KPI Dashboard in Power BI