Introduction
The Apprenticeship Programs KPI Dashboard is a comprehensive, ready-to-use Excel template designed to help organizations monitor and analyze key performance indicators related to their apprenticeship initiatives. Tracking the success and progress of apprenticeship programs is essential for continuous improvement and informed decision-making. This dashboard provides a structured, visually appealing way to visualize important data, compare against targets, and evaluate trends over time.
Key Features of Apprenticeship Programs KPI Dashboard
- Seven fully-developed worksheets covering all aspects of KPI tracking.
- Interactive dropdown menus for selecting months and KPIs.
- Conditional formatting with up/down arrows to easily spot performance deviations.
- MTD (Month-to-Date) and YTD (Year-to-Date) performance comparisons for Actuals, Targets, and Previous Year data.
- KPI trend charts to visualize monthly progress and patterns.
- Clearly defined KPI groups, formulas, and definitions for better understanding.
- User-friendly input sheets for Actual, Target, and Previous Year Numbers.
- Clickable navigation buttons for quick jumping between sheets.
Dashboard Pages Explanation
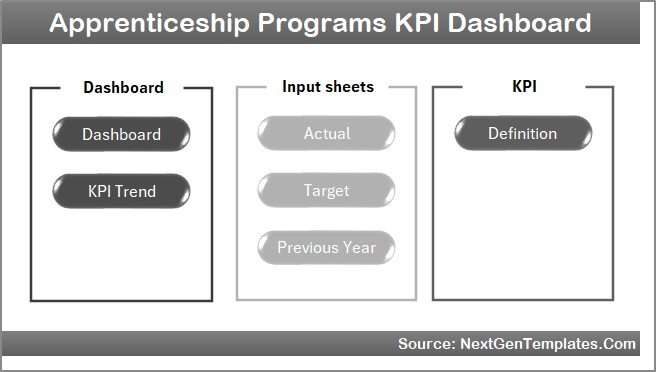
1. Home Sheet
The Home sheet serves as the index page for the entire dashboard. It includes six buttons that allow users to quickly jump to the respective sheets for detailed analysis and data input.
 Home Page
Click to Buy Apprenticeship Programs KPI Dashboard in Excel
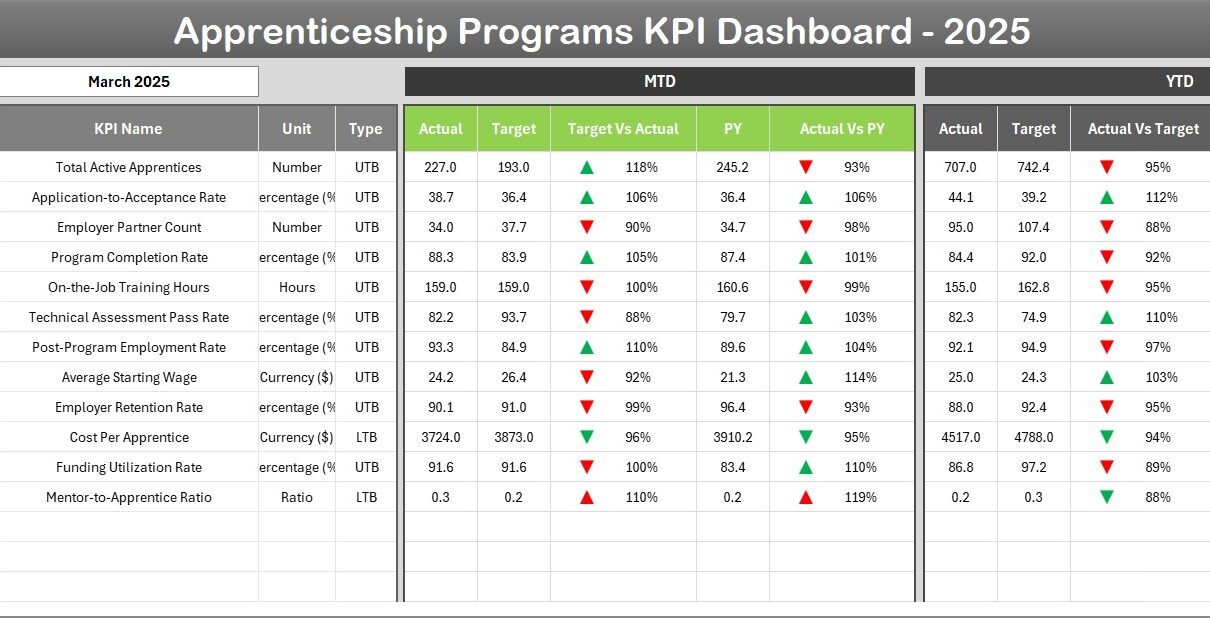
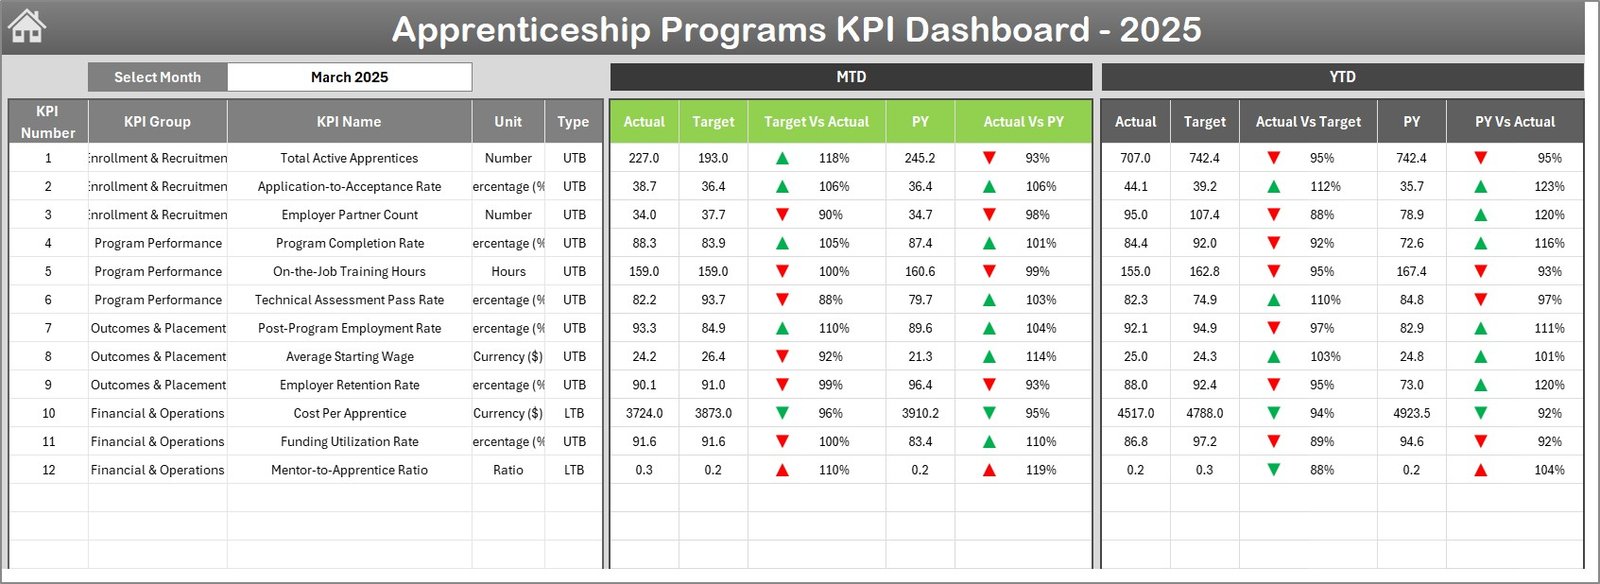
2. Dashboard Sheet
This is the main dashboard where all KPI metrics are presented in a clear and concise manner. On cell D3, users can select the month via a dropdown menu. All numbers on the dashboard dynamically update based on the selected month.
- Displays MTD Actual, Target, and Previous Year numbers.
- Highlights Target vs Actual and PY vs Actual with conditional formatting featuring up/down arrows for quick insights.
- Shows YTD Actual, Target, and Previous Year data with similar visual cues.
 Apprenticeship Programs KPI Dashboard
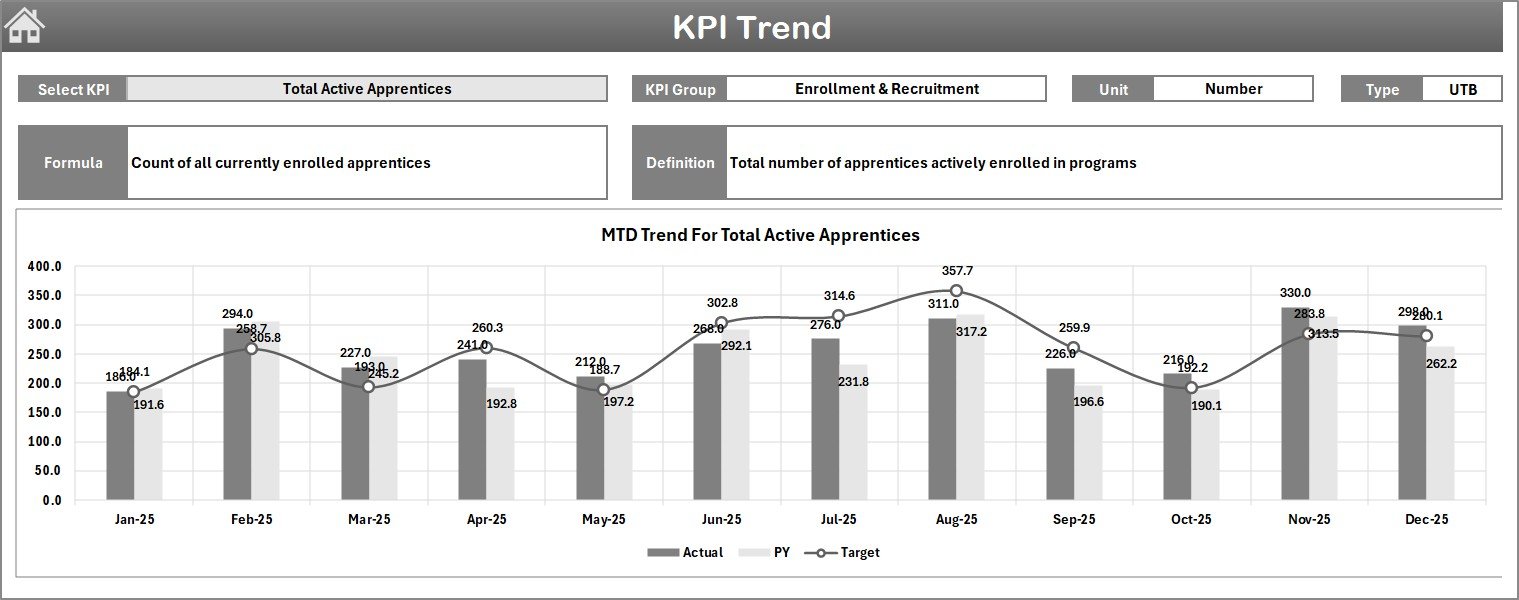
3. KPI Trend Sheet
Here, users can analyze the trends of specific KPIs by selecting the KPI name in cell C3. Key details about the selected KPI are displayed, including KPI Group, Unit, Type (Lower the Better or Upper the Better), Formula, and Definition.
- MTD and YTD trend charts show Actual, Target, and Previous Year values.
- Enables deep-dive analysis into the performance trends of critical metrics.
 KPI Trend Sheet
Click to Buy Apprenticeship Programs KPI Dashboard in Excel
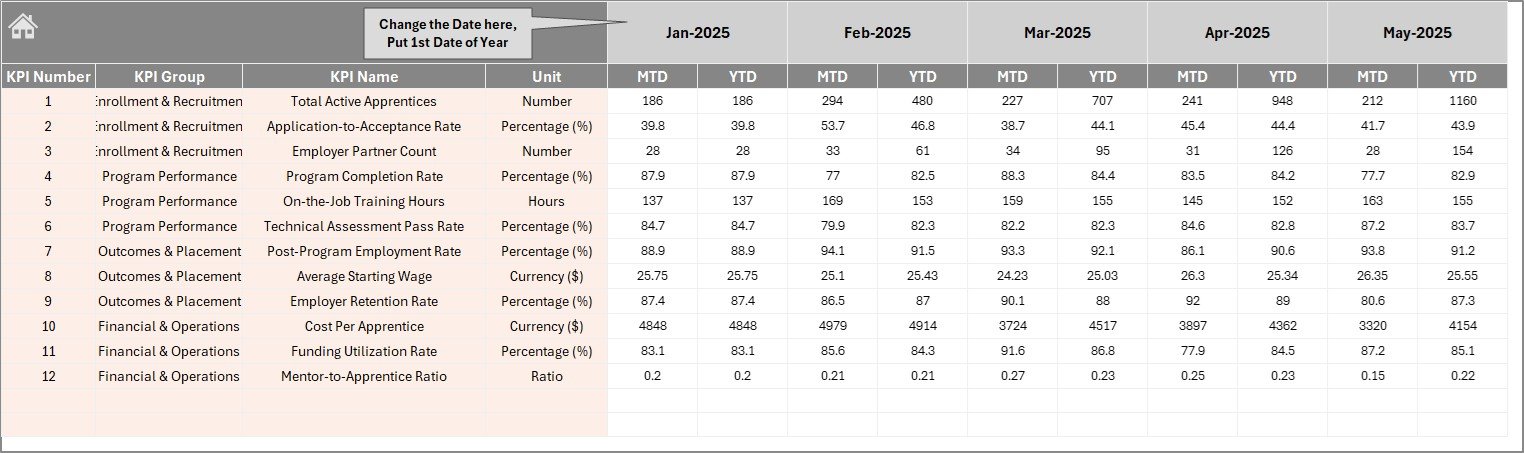
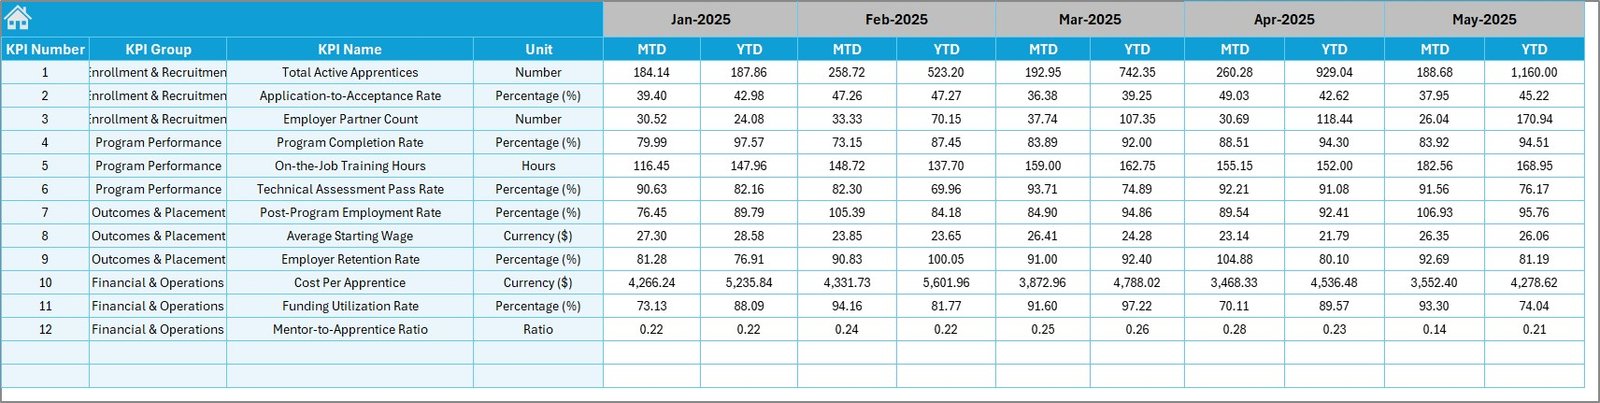
4. Actual Numbers Input Sheet
This sheet is dedicated to entering actual performance data for both MTD and YTD for the selected month. Users can adjust the starting month of the year by inputting it in cell E1.
 Actual Numbers Input sheet
5. Target Number Input Sheet
Users enter target values for each KPI for both MTD and YTD periods within this sheet. This allows dynamic comparison against actual results on the Dashboard.
 Target Number Input sheet
Click to Buy Apprenticeship Programs KPI Dashboard in Excel
6. Previous Year Number Sheet
This sheet captures data for the previous year following the same format as the current year’s inputs, enabling year-over-year performance analysis.
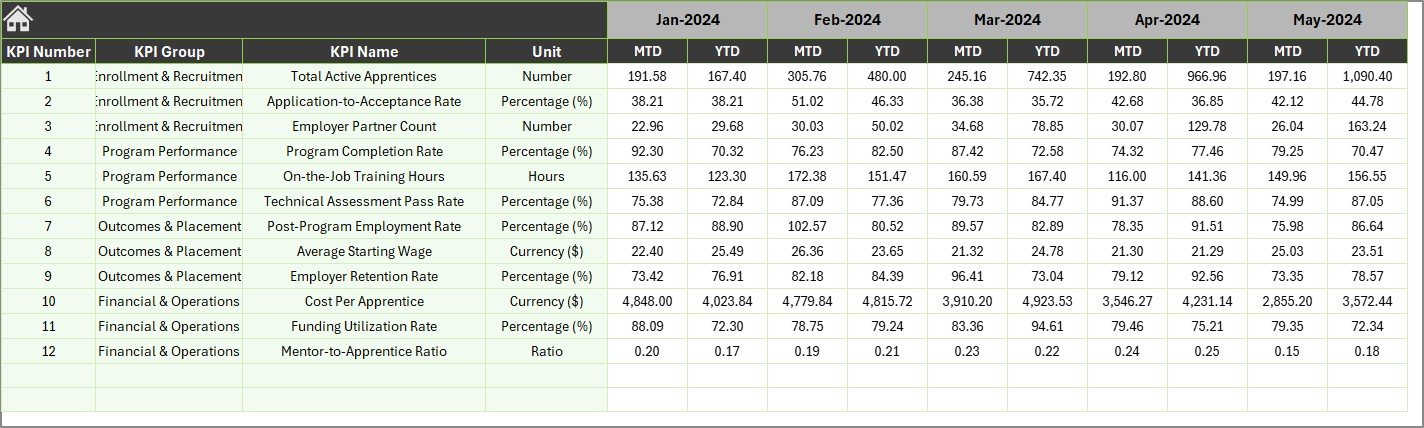 Previous Year Number Input sheet
7. KPI Definition Sheet
This sheet defines all KPIs used throughout the dashboard. Users fill in KPI Name, KPI Group, Unit, Formula, and Definition. The KPI Type is specified as either LTB (Lower the Better) or UTB (Upper the Better), which informs conditional formatting logic.
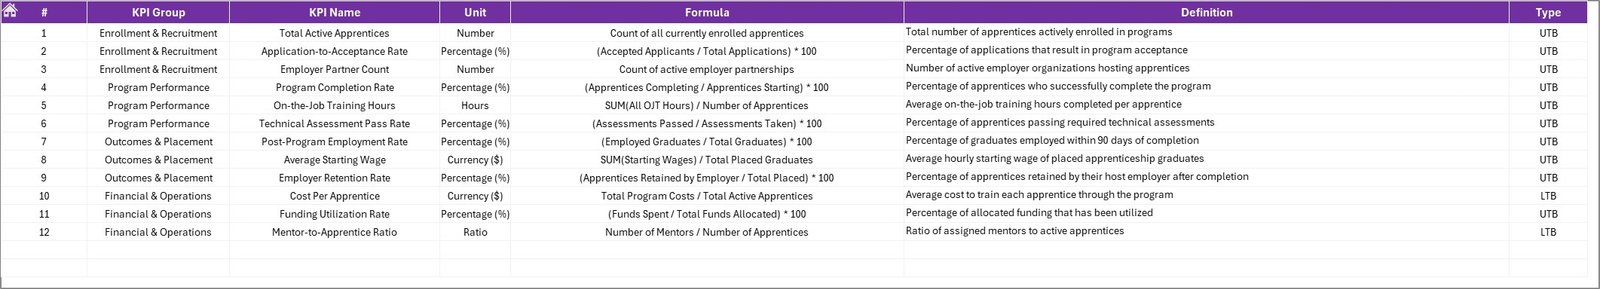 KPI Definition sheet
Click to Buy Apprenticeship Programs KPI Dashboard in Excel
Advantages of Apprenticeship Programs KPI Dashboard
- Improved decision-making: Real-time and historical KPI tracking ensures timely, data-driven business decisions.
- Enhanced visibility: Stakeholders can easily visualize progress against goals and trends.
- User-friendly interface: Intuitive layout with interactive features simplifies usage for various levels of staff.
- Efficient tracking: Provides a structured way to monitor multiple KPIs simultaneously.
- Customization: Flexible inputs and KPI definitions accommodate unique organizational needs.
Opportunities for Improvement
- Integrate automated data connections to reduce manual input and errors.
- Add more detailed drill-downs and segmentation options for KPIs.
- Incorporate forecasting models to project future KPI outcomes.
- Enable exportable reports for stakeholder presentations.
- Introduce mobile-friendly dashboards for on-the-go access.
Best Practices
Click to Buy Apprenticeship Programs KPI Dashboard in Excel
- Define clear and relevant KPIs aligned with organizational goals.
- Regularly update actual, target, and previous year data to maintain accuracy.
- Consistently use the dashboard to monitor progress and adjust strategies.
- Train team members on understanding and using the dashboard effectively.
- Keep KPI definitions up-to-date as programs evolve.
FAQs
What is the main purpose of the Apprenticeship Programs KPI Dashboard?
Its primary purpose is to track, visualize, and analyze the performance of apprenticeship programs using relevant KPIs for better management and decision-making.
Can I customize the KPIs in this dashboard?
Yes, the dashboard includes a dedicated KPI Definition sheet where you can add or modify KPIs along with their formulas and types.
Is this dashboard suitable for all industries?
While designed with apprenticeship programs in mind, the dashboard structure is adaptable to different sectors by tailoring KPIs accordingly.
How often should I update the data?
It’s recommended to update Actual, Target, and Previous Year numbers monthly to ensure accurate monitoring and insights.
Can the dashboard show comparisons between months?
Yes, by selecting different months from the dropdown on the Dashboard sheet, you can quickly switch and compare data across time.
Conclusion
Click to Buy Apprenticeship Programs KPI Dashboard in Excel
The Apprenticeship Programs KPI Dashboard is an invaluable tool for organizations looking to streamline the monitoring and management of their apprenticeship initiatives. Its well-structured, interactive design offers clear visibility into key metrics, making performance management efficient and straightforward. By leveraging this dashboard, businesses can drive continuous improvement, ensure alignment with goals, and ultimately deliver more impactful apprenticeship outcomes.
For further reference and additional dashboard templates, visit the official Microsoft Excel help pages: Microsoft Excel Support.
Visit our YouTube channel to watch the demo.
Click to Buy Apprenticeship Programs KPI Dashboard in Excel