Effective risk management is a cornerstone of successful business operations. The Risk Management Report in Excel is a ready-to-use tool designed to help managers, analysts, and teams monitor, assess, and mitigate organizational risks efficiently. With interactive dashboards, visual charts, and a structured data input system, this Excel report provides a complete overview of your risk landscape.
Key Features of the Risk Management Report
This report contains three sheet tabs: Summary, Report, and Data, each tailored for different levels of analysis and reporting.
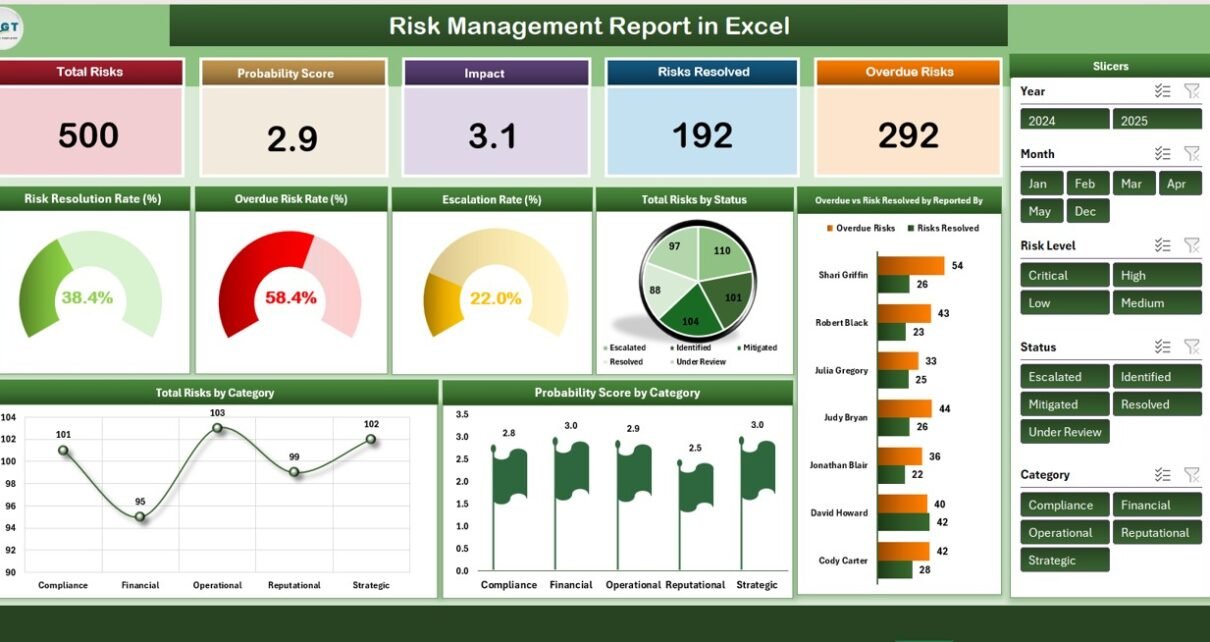
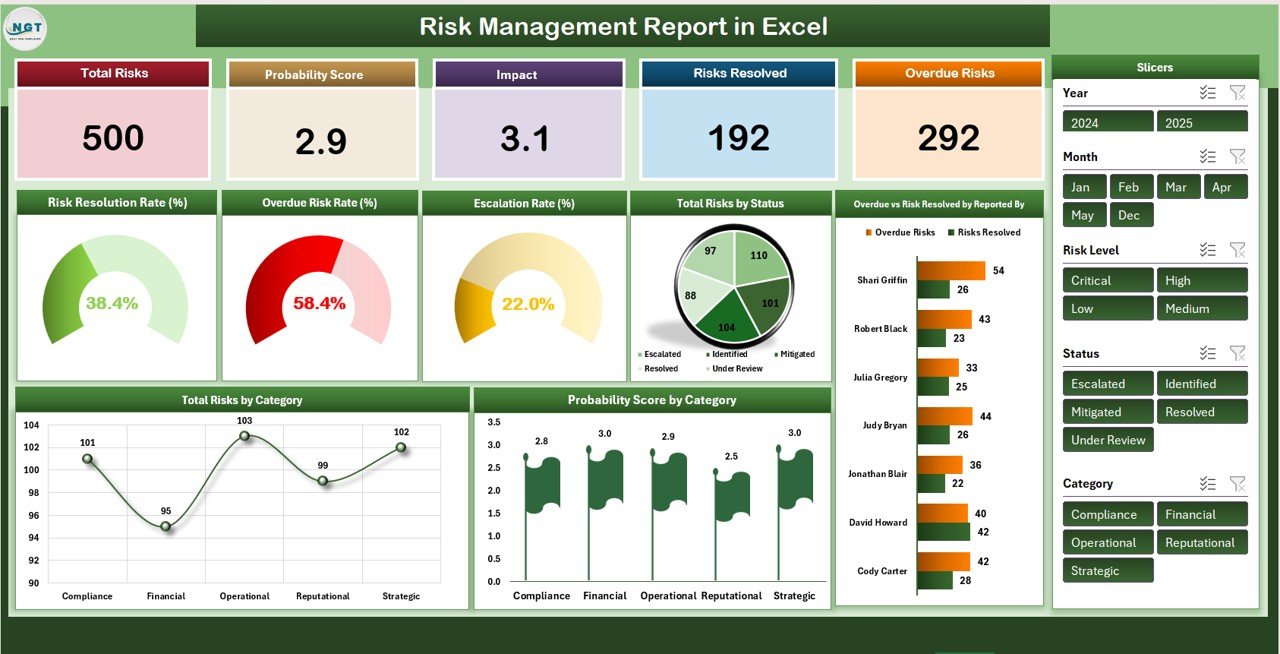
1. Summary Sheet Tab
The Summary sheet serves as the main dashboard, providing a snapshot of risk metrics through cards and charts:
Cards Include:
-
Total Risks – Total number of risks logged in the system.
-
Probability Score – Average likelihood score of all risks.
-
Impact – Average impact score of all risks on business operations.
-
Risks Resolved – Total number of risks successfully mitigated.
-
Overdue Risks – Risks that are unresolved beyond their due dates.
Charts Include:
-
Risk Resolution Rate (%) – Visualize how many risks have been resolved over time.
-
Overdue Risk Rate (%) – Track overdue risks and their impact on operations.
-
Escalation Rate (%) – Monitor risks that have been escalated for urgent attention.
-
Total Risks by Status – Identify how risks are distributed across different statuses.
-
Overdue vs Risk Resolved by Reported By – Evaluate performance by risk owner or reporter.
-
Probability Score by Category – Compare likelihood scores across risk categories.
-
Total Risks by Category – Visualize the number of risks in each category.
Click to Buy Risk Management Report in Excel
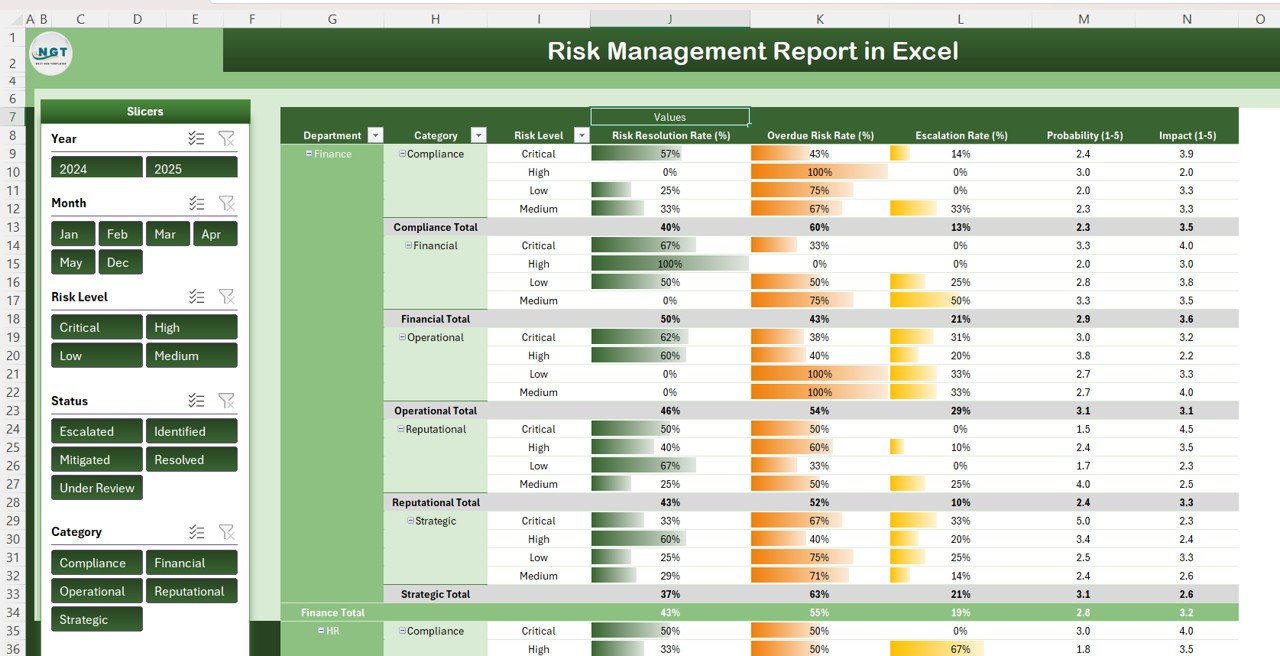
2. Report Sheet Tab
The Report sheet provides a Power Pivot view, allowing users to slice and dice the data for deeper analysis. Managers can filter by risk category, status, reporter, or due dates to identify high-priority areas and trends. This sheet enables proactive decision-making and detailed risk assessment.
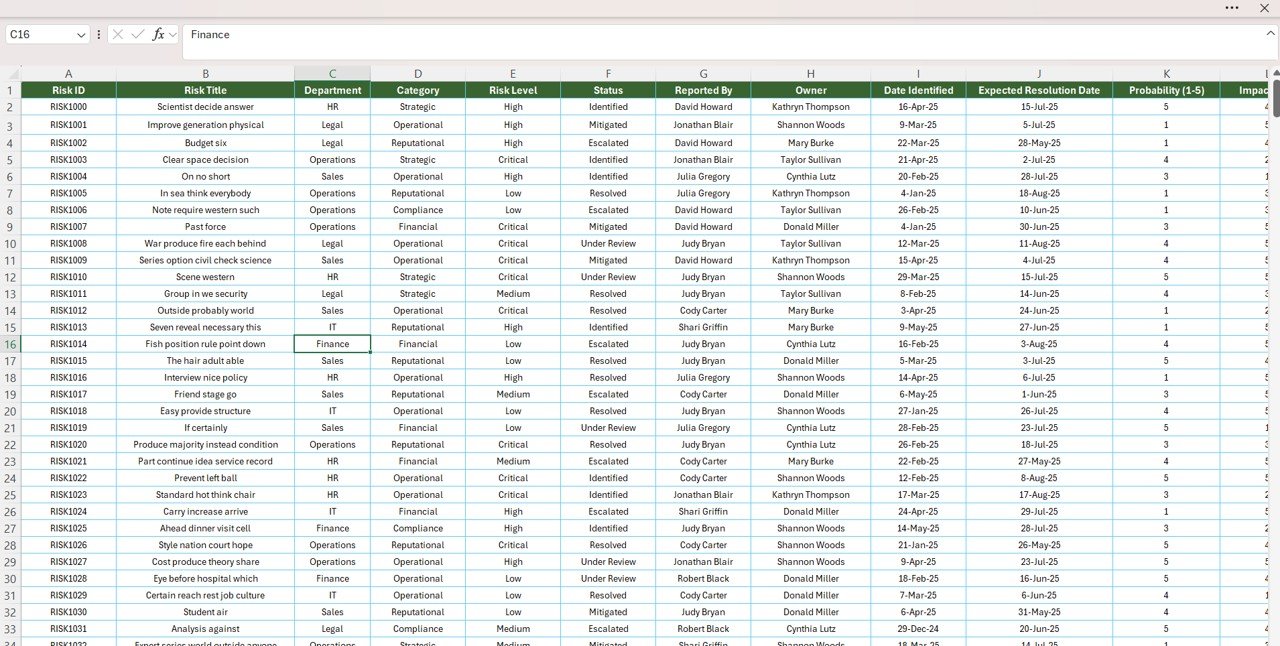
3. Data Sheet Tab
The Data sheet is the core input hub where all risk-related information is captured, including:
-
Risk ID
-
Risk Name
-
Risk Category
-
Probability Score
-
Impact
-
Status
-
Reported By
-
Assigned To
-
Risk Mitigation Actions
-
Due Date
-
Resolution Date
This centralized dataset ensures the Summary and Report tabs update automatically, providing real-time insights into your risk management process.
Click to Buy Risk Management Report in Excel
Benefits of Using This Report
-
Enhanced Risk Visibility: Track and analyze all organizational risks in a single dashboard.
-
Improved Decision-Making: Identify high-probability and high-impact risks to prioritize mitigation.
-
Efficiency: Automated charts and dashboards save time compared to manual reporting.
-
Accountability: Monitor overdue risks and escalation rates to ensure timely action.
Opportunities for Improvement
Click to Buy Risk Management Report in Excel
-
Integrate with ERP or project management systems to automate risk data collection.
-
Add trend analysis to forecast emerging risks.
-
Incorporate department-specific KPIs to track team performance in risk management.
Best Practices
-
Update the Data sheet regularly to maintain accurate reporting.
-
Review overdue and escalated risks weekly to mitigate potential impact.
-
Customize charts to focus on critical risks relevant to your business operations.
Frequently Asked Questions (FAQ)
Click to Buy Risk Management Report in Excel
Q1: Can this report track risks across multiple projects or departments?
Yes, the report is designed to monitor risks across multiple teams, projects, or business units.
Q2: Is prior Excel expertise required to use this report?
No, the report is user-friendly and ready-to-use. Basic Excel skills are sufficient to input and analyze data.
Q3: Can I add new risk categories or KPIs?
Yes, the report is fully customizable. You can add new categories, KPIs, or metrics as per your business needs.
Q4: How can I visualize trends over time?
Use the Summary sheet charts and Power Pivot filters to view trends in risk resolution, overdue risks, and escalation rates.
Q5: Can I export this report for presentations or audits?
Yes, charts and dashboards can be exported to PowerPoint or PDF for stakeholders or audit purposes.
Conclusion
The Risk Management Report in Excel is an indispensable tool for any organization looking to systematically track, evaluate, and mitigate risks. By leveraging interactive dashboards and comprehensive reporting, businesses can improve decision-making, enhance accountability, and proactively address potential threats.
With automated updates, insightful visualizations, and customizable features, this Excel report ensures a robust risk management framework is always at your fingertips.
Visit our YouTube channel to learn step-by-step video tutorials
Watch the step-by-step video Demo:
Click to Buy Risk Management Report in Excel