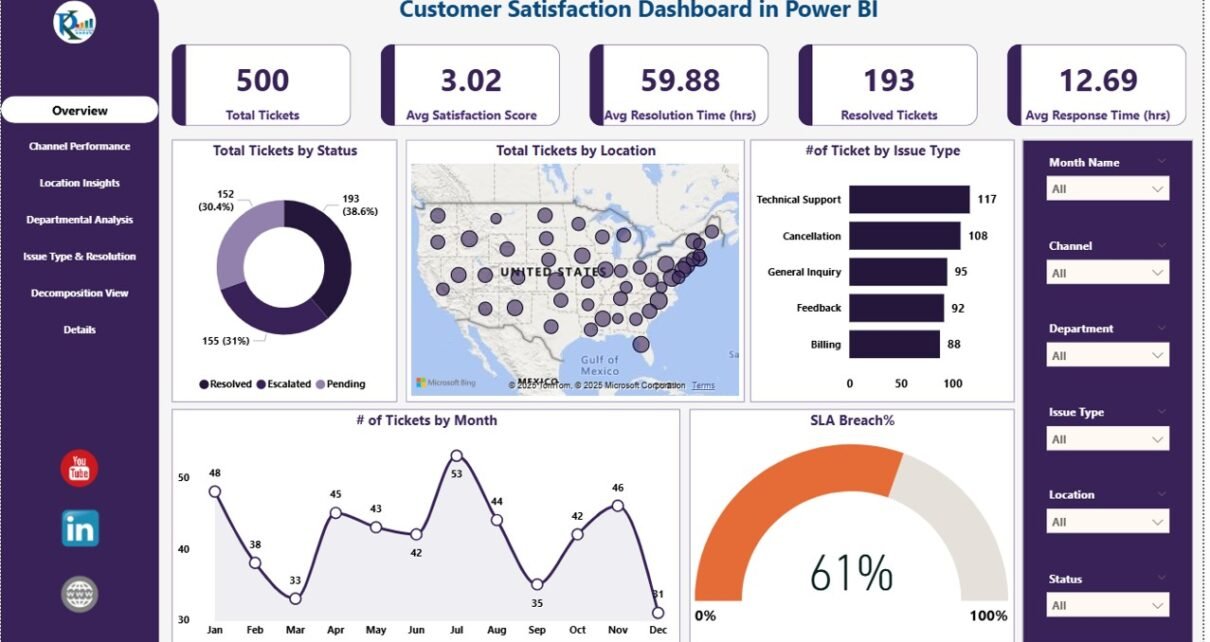
In today’s competitive business environment, monitoring customer satisfaction is crucial for improving service quality and operational efficiency. Our Customer Satisfaction Dashboard in Power BI is a ready-to-use tool designed to help organizations track and analyze customer support metrics effectively.Customer Satisfaction Dashboard in Power BI
This dashboard provides a comprehensive view of ticket management, response times, resolution efficiency, SLA compliance, and overall customer satisfaction. It is ideal for customer service managers, team leads, and analysts who want to make data-driven decisions.
Key Features of the Dashboard
Click to Buy Customer Satisfaction Dashboard in Power BI
The dashboard contains multiple pages to provide detailed insights into customer support performance.
1. Overview Page
The Overview Page gives a quick snapshot of overall performance with cards and charts.
Cards Include:
-
Total Tickets: The total number of tickets logged.
-
Avg. Satisfaction Score: Average rating provided by customers.
-
Avg. Resolution Time (hrs): Average time taken to resolve tickets.
-
Avg. Response Time (hrs): Average time taken to respond to tickets.
-
Resolved Tickets: Total number of tickets successfully resolved.
Charts Include:
-
Total Tickets by Status
-
Total Tickets by Location
-
Number of Tickets by Issue Type
-
SLA Breach %
-
Number of Tickets by Month

Click to Buy Customer Satisfaction Dashboard in Power BI
2. Channel Performance
Analyze how different communication channels perform with respect to response time and customer satisfaction.
Charts Include:
-
Number of Tickets by Channel
-
Avg. Response Time (hrs) by Channel
-
Avg. Satisfaction Score by Channel
-
SLA Breach % by Channel

3. Location Insights
Understand performance across locations to identify high-performing areas and improvement opportunities.
Charts Include:
-
Total Tickets by Top 7 Locations
-
Avg. Satisfaction Score by Top 7 Locations
-
SLA Breach % by Top 7 Locations

Click to Buy Customer Satisfaction Dashboard in Power BI
4. Departmental Analysis
Track department-level performance to manage workloads and enhance efficiency.
Charts Include:
-
Number of Tickets by Department
-
SLA Breach % by Department
-
Avg. Satisfaction Score by Department

5. Issue Type & Resolution
Analyze the type of issues and how effectively they are resolved.
Charts Include:
-
Number of Tickets by Issue Type
-
Resolved Tickets by Issue Type
-
Avg. Response Time by Issue Type
-
Avg. Resolution Time (hrs) by Issue Type

Click to Buy Customer Satisfaction Dashboard in Power BI
6. Decomposition View
The Decomposition Tree helps visualize data hierarchies and relationships, enabling deep analysis of ticket trends, SLA compliance, and resolution effectiveness.

7. Details Page
This page includes a table view of all tickets, providing granular insights into each ticket for audit and reporting purposes.

Click to Buy Customer Satisfaction Dashboard in Power BI
Advantages of Using This Dashboard
-
Real-time tracking of customer support performance
-
Identify SLA breaches quickly and take corrective actions
-
Analyze performance across departments, channels, and locations
-
Monitor resolution and response times efficiently
-
Understand common issues and optimize workflows
Opportunities for Improvement
Click to Buy Customer Satisfaction Dashboard in Power BI
-
Integrate with CRM tools for automatic ticket data updates
-
Add predictive analytics to anticipate SLA breaches
-
Include trend analysis for forecasting customer satisfaction
Best Practices
-
Regularly update ticket data for accurate insights
-
Train staff to maintain accurate ticket logs
-
Monitor KPIs consistently and take proactive measures
-
Use filters to analyze specific periods, departments, or issue types
Conclusion
The Customer Satisfaction Dashboard in Power BI is a powerful tool for organizations looking to enhance their customer service operations. By monitoring key metrics like satisfaction score, resolution time, and SLA compliance, businesses can improve customer experiences, streamline processes, and drive operational efficiency.
Visit our YouTube channel to learn step-by-step video tutorials
Watch the step-by-step video Demo:
Click to Buy Customer Satisfaction Dashboard in Power BI