Measuring employee satisfaction is critical for organizations aiming to improve workplace engagement, retention, and productivity. Our Employee Satisfaction Dashboard in Power BI is a ready-to-use, interactive tool designed to help HR teams and managers monitor satisfaction metrics across departments, roles, and locations.
This dashboard provides a comprehensive overview of employee satisfaction, breaking down scores by work environment, compensation, management, and growth opportunities. It also offers deep insights into department-level and role-based satisfaction patterns, helping organizations make data-driven decisions to improve employee experience.
Key Features of Employee Satisfaction Dashboard
The dashboard is organized into multiple pages, each providing a unique perspective on employee satisfaction:
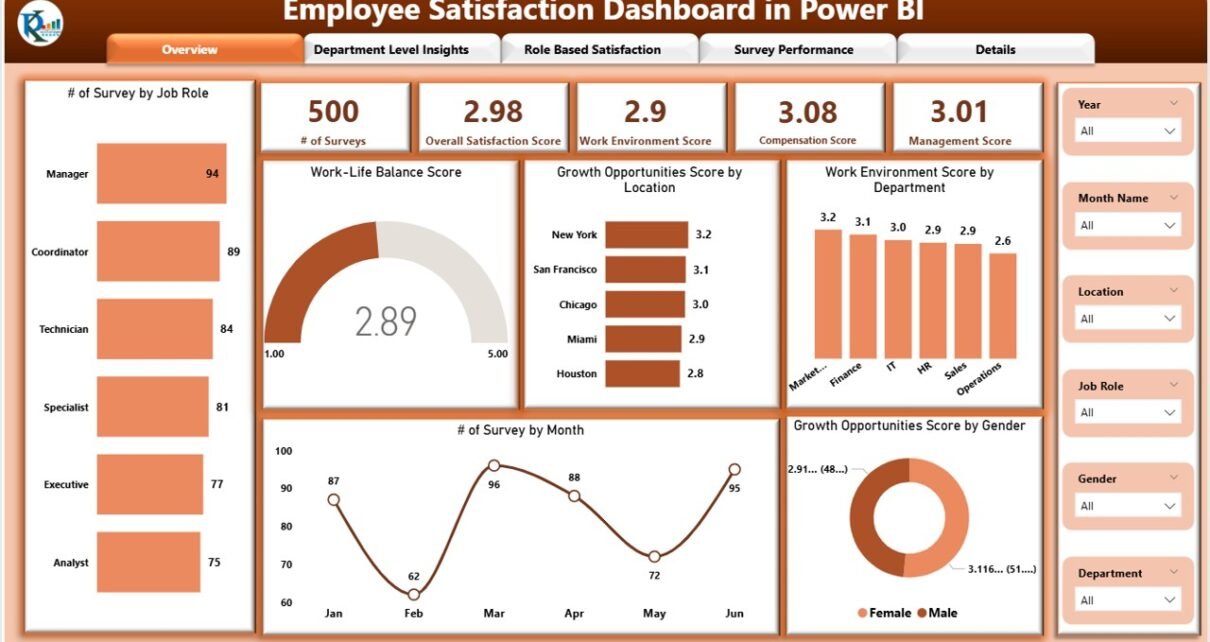
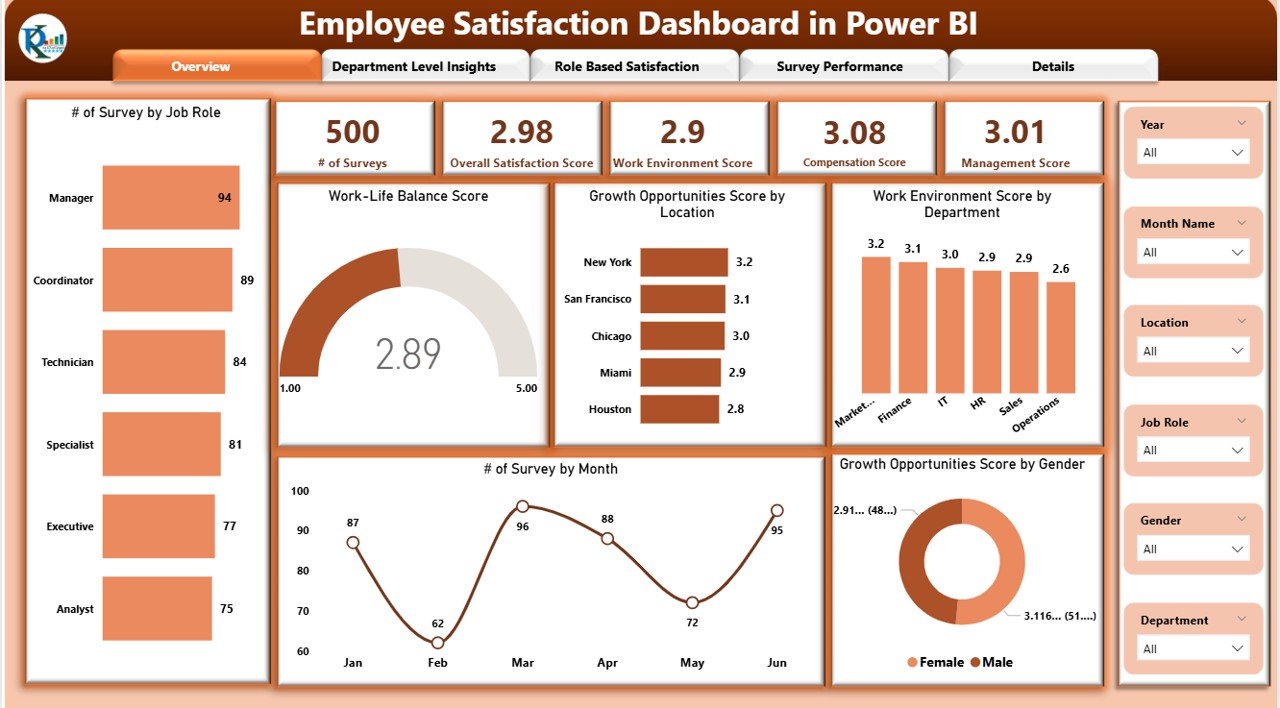
1. Overview Page
The Overview Page provides a high-level snapshot of employee feedback.
Cards Display:
-
# of Surveys – Total number of completed surveys
-
Overall Satisfaction Score – Aggregate satisfaction score across all surveys
-
Work Environment Score – Rating for workplace environment
-
Compensation Score – Employee feedback on pay and benefits
-
Management Score – Evaluation of management effectiveness
Charts Included:
-
Work-Life Balance Score – Visualize employee perception of work-life balance
-
Growth Opportunities Score by Location – Compare growth prospects across offices
-
Work Environment Score by Department – Track departmental satisfaction
-
# of Surveys by Month – Monitor survey participation trends
-
Growth Opportunities Score by Gender – Gender-based satisfaction insights
Click to Buy Employee Satisfaction Dashboard in Power BI
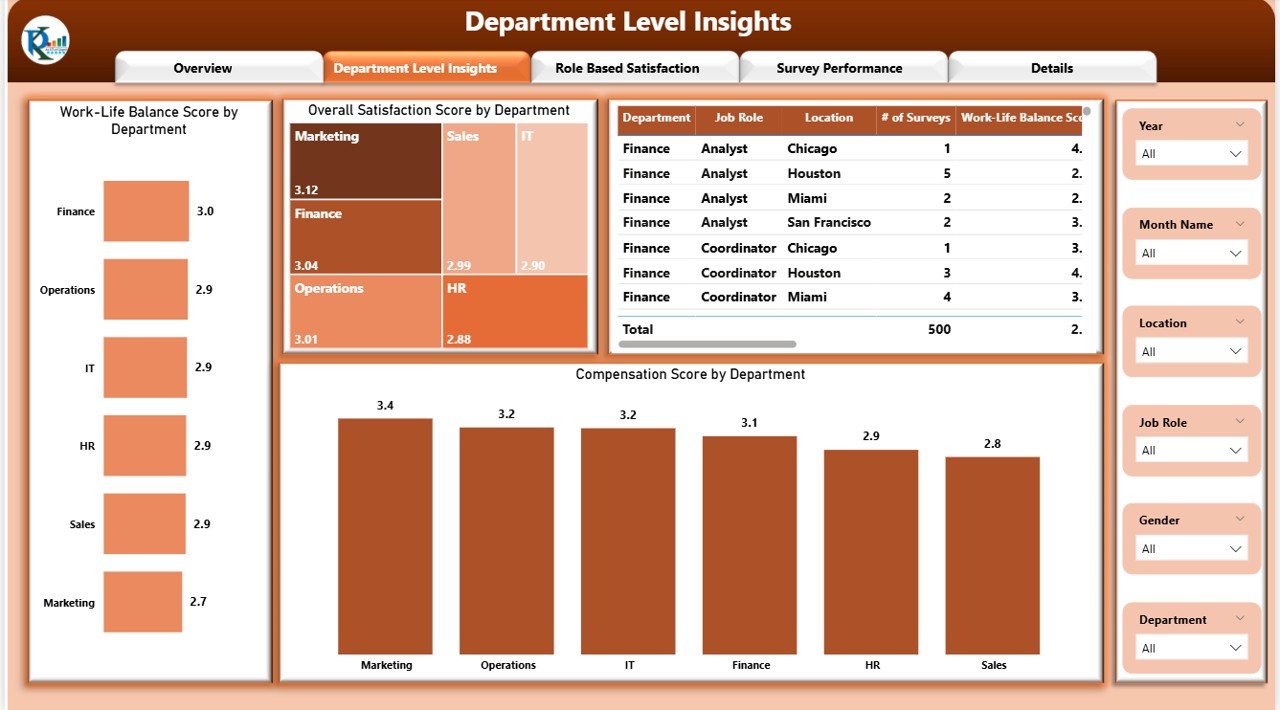
2. Department Level Insights
The Department Level Insights page provides a granular view of satisfaction metrics by department.
Charts Included:
-
Work-Life Balance Score by Department – Identify departments needing attention
-
Overall Satisfaction Score by Department – Measure overall engagement per department
-
Compensation Score by Department – Compare pay satisfaction across teams
This page helps HR managers pinpoint departments with lower engagement or satisfaction levels.
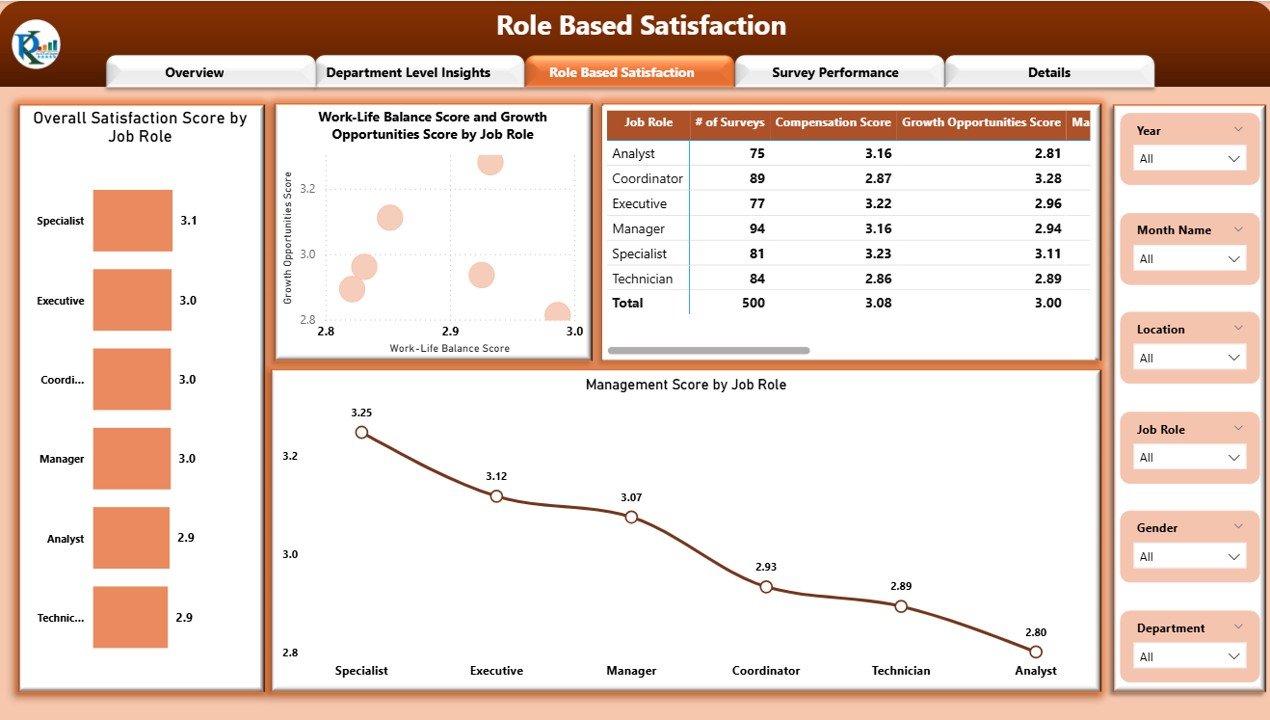
3. Role-Based Satisfaction
The Role-Based Satisfaction page evaluates satisfaction by job role, providing insights for career development and HR interventions.
Charts Included:
-
Overall Satisfaction Score by Job Role – Identify roles with higher or lower satisfaction
-
Work-Life Balance Score and Growth Opportunities Score by Job Role – Assess role-specific challenges
-
Management Score by Job Role – Understand how management is perceived across different positions
Click to Buy Employee Satisfaction Dashboard in Power BI
4. Survey Performance
The Survey Performance page focuses on survey-specific analytics.
Charts & Visuals:
-
Decomposition Tree – Drill down into satisfaction scores by department, role, and location
-
Detailed Charts – Analyze trends and patterns in survey responses
-
Tables – Capture individual survey results and performance metrics
This page allows managers to analyze survey performance in depth and take targeted actions.

Advantages of Using This Dashboard
-
Comprehensive Insights: Measure satisfaction across multiple dimensions including compensation, management, and work-life balance
-
Department & Role Analysis: Identify departments and roles with lower engagement
-
Interactive & Visual: Use Power BI’s visuals to explore satisfaction patterns dynamically
-
Data-Driven Decisions: Make informed HR interventions and improve employee retention
-
Survey Tracking: Monitor survey participation and performance over time
Opportunities for Improvement
Click to Buy Employee Satisfaction Dashboard in Power BI
-
Real-Time Feedback Integration: Connect the dashboard to live survey tools for instant updates
-
Predictive Analytics: Forecast potential employee turnover based on satisfaction trends
-
Custom Alerts: Notify HR or management if satisfaction scores fall below thresholds
-
Benchmarking: Compare satisfaction scores with industry or organizational benchmarks
-
Enhanced Drill-Throughs: Add drill-through pages for deeper employee-level insights
Best Practices for Using the Dashboard
-
Regularly Update Data: Ensure all surveys are logged for accurate metrics
-
Encourage Survey Participation: Higher participation gives better insights
-
Analyze Departmental Trends: Focus interventions on departments with lower scores
-
Compare Roles & Locations: Identify patterns across different roles and offices
-
Share Insights with Leadership: Use dashboard visuals in management meetings for decision-making
Conclusion
Click to Buy Employee Satisfaction Dashboard in Power BI
The Employee Satisfaction Dashboard in Power BI is a powerful tool for HR teams and management to monitor, analyze, and improve employee engagement. With multiple pages offering insights at department, role, and survey levels, organizations can proactively address challenges, enhance employee experience, and build a more productive workplace.
FAQs
1. Can this dashboard track satisfaction by location?
Yes, it includes Growth Opportunities Score by Location and other location-specific charts.
2. How can I analyze satisfaction trends over time?
Use the # of Surveys by Month chart and other trend visuals on the Overview and Survey Performance pages.
3. Can this dashboard show role-specific satisfaction?
Yes, the Role-Based Satisfaction page breaks down scores by job role.
4. Is it possible to drill down to department-level insights?
Yes, the Department Level Insights page provides department-specific charts and drill-down capabilities.
5. Can I integrate this dashboard with survey tools?
Yes, it can be connected to live survey data sources using Power BI connectors for real-time updates.
Visit our YouTube channel to learn step-by-step video tutorials
Watch the step-by-step video Demo:
Click to Buy Employee Satisfaction Dashboard in Power BI