Every business invests money in acquiring customers, but the key question is—how much does it actually cost to acquire a new customer? This question becomes even more critical in today’s highly competitive market, where advertising budgets are tight and marketing teams must prove their return on investment (ROI).
The answer lies in tracking Cost Per Acquisition (CPA). By calculating CPA, businesses can measure the efficiency of their marketing and sales strategies, ensuring they are spending wisely to generate leads and conversions.
To make this process easier, we have created a Cost Per Acquisition KPI Dashboard in Excel. This ready-to-use tool simplifies data entry, visualizes trends, and helps decision-makers track both short-term and long-term acquisition costs in one place.Cost Per Acquisition KPI Dashboard In Excel
Click to buy now Cost Per Acquisition KPI Dashboard In Excel
In this article, we will explore:
- What a Cost Per Acquisition KPI Dashboard is
- Key features of the Excel-based template
- Advantages of using it
- Best practices for implementation
- Opportunities for improvement
- Real-world applications
- FAQs to answer common queries
What Is Cost Per Acquisition (CPA)?
Cost Per Acquisition (CPA) is a marketing metric that calculates the average cost of acquiring a customer through advertising, promotions, or other marketing channels. It gives a direct picture of how much a business spends to gain one paying customer.
The formula is straightforward:
CPA = Total Marketing Spend ÷ Number of Acquired Customers
For example, if your company spends $10,000 on a campaign and gains 200 new customers, your CPA is $50 per customer.
A lower CPA indicates better efficiency, while a higher CPA suggests that marketing strategies need improvement.
Why Use an Excel-Based Cost Per Acquisition KPI Dashboard?
While many businesses rely on advanced tools and software, Excel remains one of the most powerful and flexible platforms for data analysis. Using Excel for CPA dashboards offers:
- Cost-effectiveness – No need for expensive analytics software.
- Flexibility – Customize the dashboard as per your industry needs.
- Ease of use – Anyone with basic Excel knowledge can manage it.
- Quick insights – Visualize data with charts, tables, and conditional formatting.
- Centralized tracking – Consolidates monthly, yearly, and historical data in one place.
Key Features of the Cost Per Acquisition KPI Dashboard in Excel
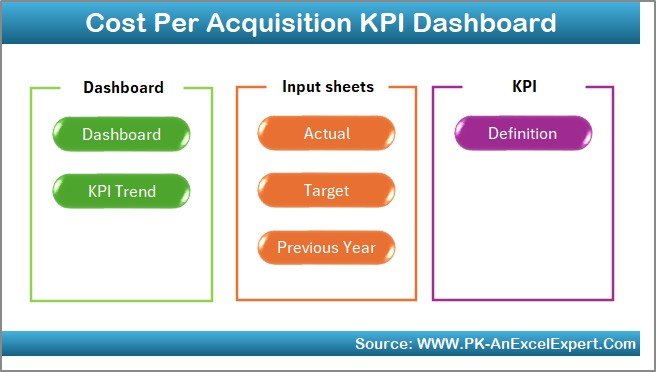
This dashboard comes with seven worksheets, each designed to make tracking CPA simple and insightful. Let’s break them down:
Home Sheet
- Functions as the index page of the dashboard.
- Contains six buttons that allow you to navigate quickly to other sheets.
- Makes navigation user-friendly, especially for beginners.
Click to buy now Cost Per Acquisition KPI Dashboard In Excel
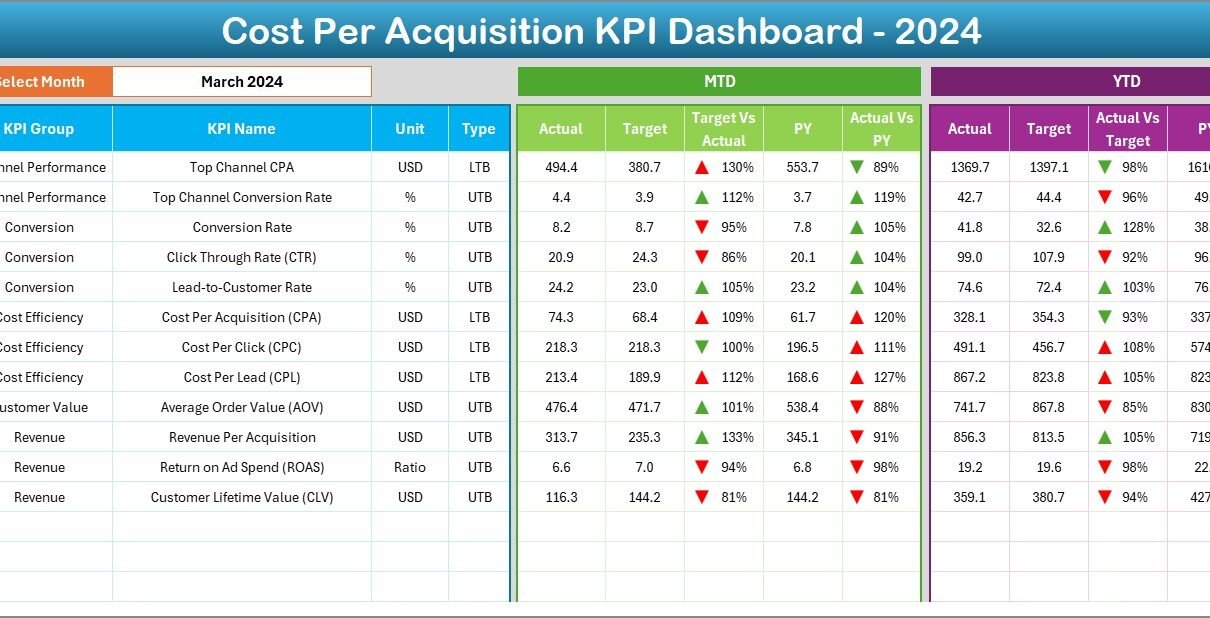
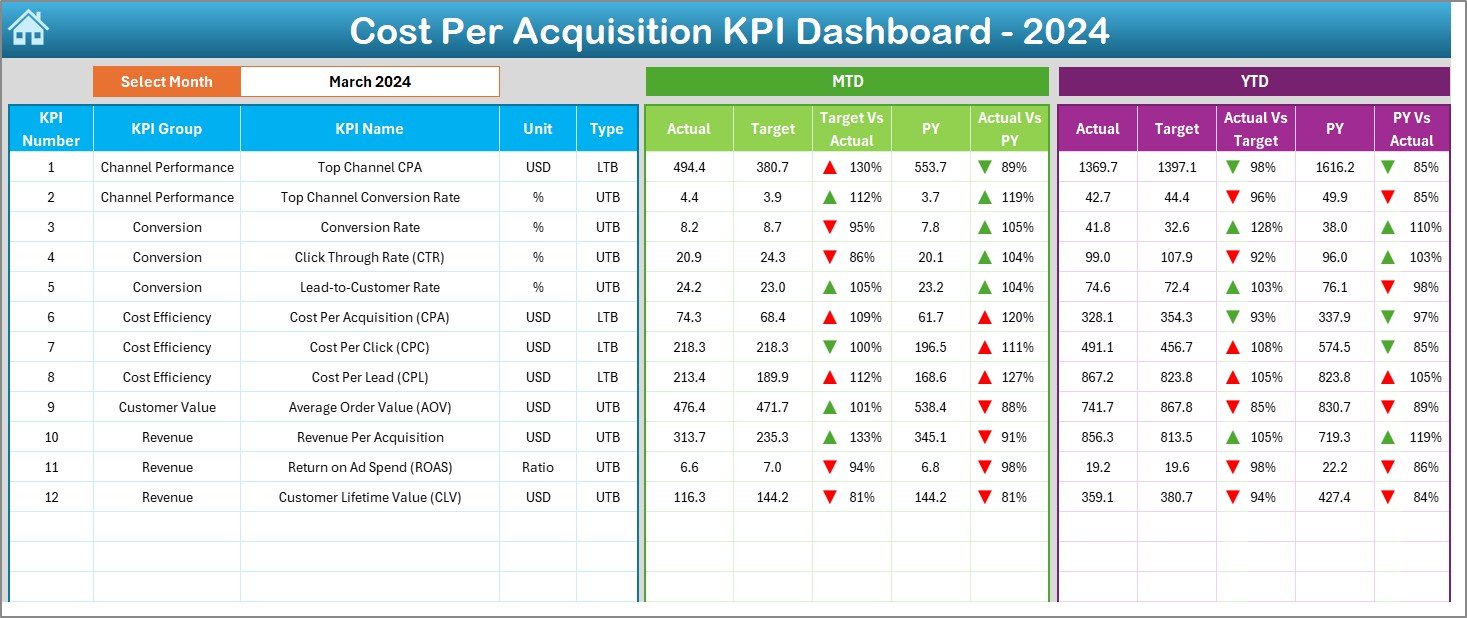
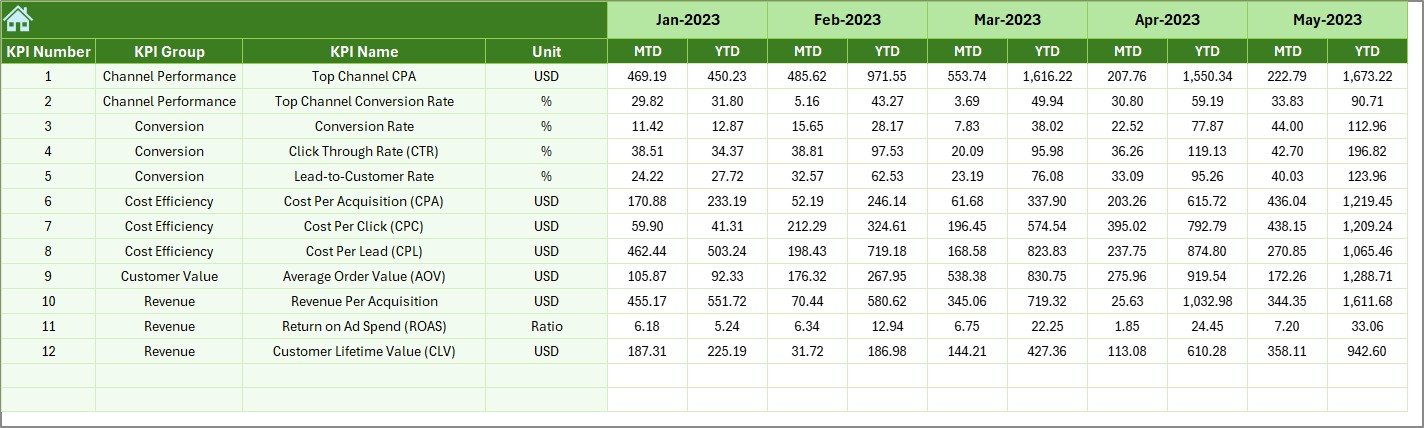
Dashboard Sheet Tab
- The main page that summarizes all KPIs.
- A drop-down in cell D3 allows you to select a month, and the dashboard updates instantly.
- Displays:
- MTD (Month-to-Date) Actual, Target, and Previous Year values.
- YTD (Year-to-Date) Actual, Target, and Previous Year values.
- Conditional formatting with up/down arrows visually indicates performance against targets and previous years.
KPI Trend Sheet Tab
- Lets you analyze KPI-specific trends.
- Features:
- Drop-down in cell C3 to select any KPI.
- Displays KPI Group, Unit, Type (Lower the Better or Upper the Better), Formula, and Definition.
- Trend charts for MTD and YTD comparisons across Actual, Target, and Previous Year values.
-
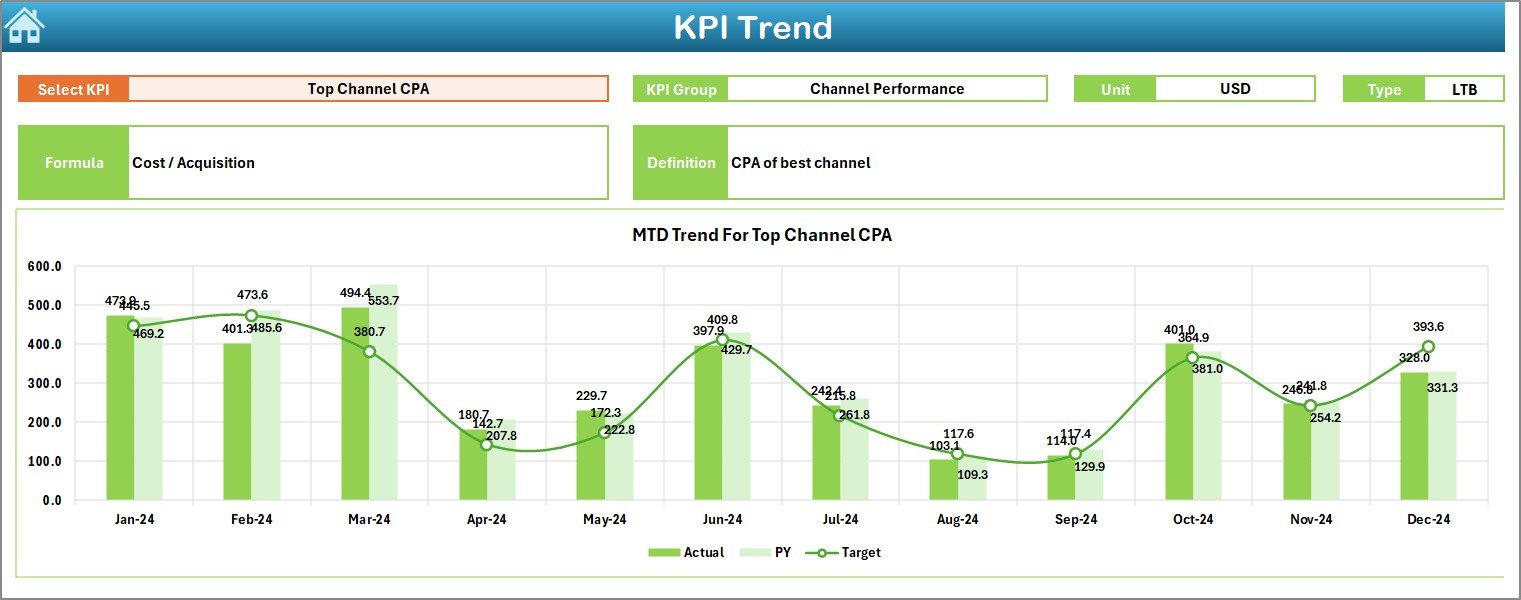
KPI Trend Sheet Tab
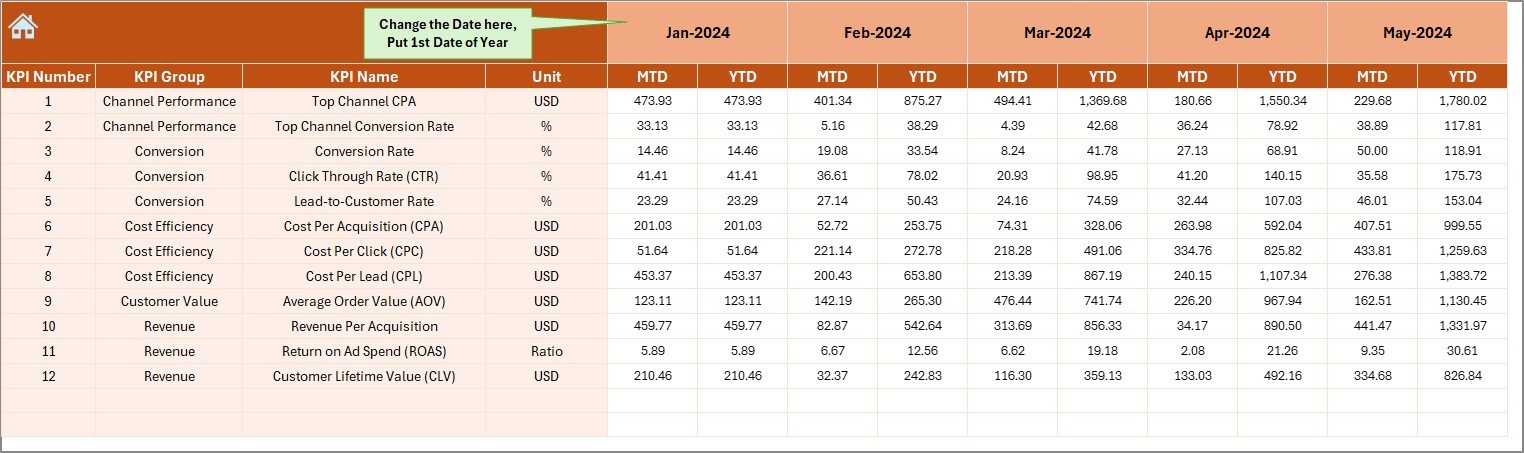
Actual Numbers Input Sheet
- The data entry sheet for actual performance.
- Allows monthly input of MTD and YTD values.
- A drop-down in cell E1 lets you select the starting month of the financial year.
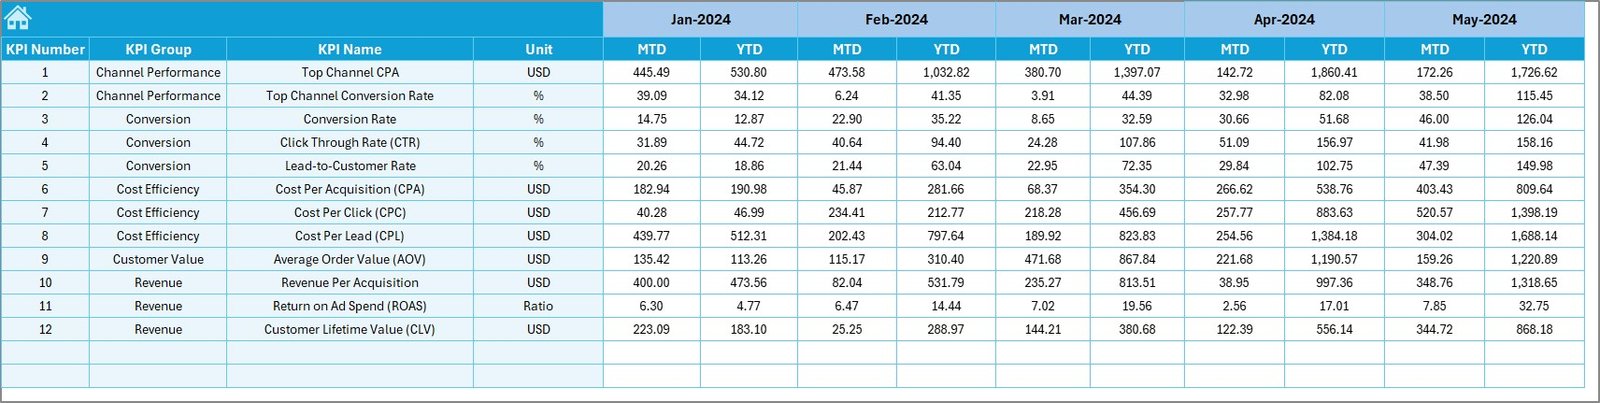
Target Sheet Tab
- Used to set monthly targets for each KPI.
- Includes both MTD and YTD target values.
- Helps track progress against business goals.
Previous Year Number Sheet Tab
- Stores last year’s data for comparison.
- Ensures year-over-year performance analysis.
- Critical for identifying long-term improvement trends.
Click to buy now Cost Per Acquisition KPI Dashboard In Excel
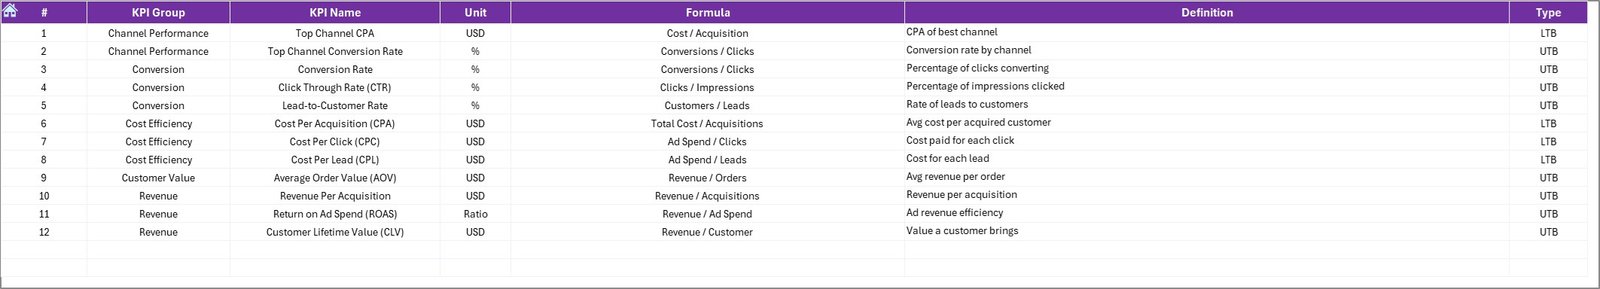
KPI Definition Sheet Tab
- Lists all KPI details in one place:
- KPI Name
- KPI Group
- Unit
- Formula
- Definition
- Helps users clearly understand the calculation and purpose of each KPI.
Advantages of Cost Per Acquisition KPI Dashboard in Excel
Using this dashboard provides several benefits:
- Improved Decision Making – Managers get instant insights into acquisition efficiency.
- Easy Customization – Add or remove KPIs as per business needs.
- Data-Driven Marketing – Compare actual numbers with targets and past performance.
- Visual Representation – Conditional formatting and charts make data easier to understand.
- Goal Tracking – MTD and YTD tracking ensures both short-term and long-term visibility.
- Performance Benchmarking – Compare against previous years to set realistic goals.
Opportunities for Improvement
Although Excel is versatile, some improvements can enhance the dashboard:
- Automation with VBA – Automate data entry and calculations to save time.
- Integration with CRM or ERP – Import live data from other platforms.
- Scalability – For large enterprises, Power BI or Tableau may offer better scalability.
- Collaboration – Use Google Sheets for real-time sharing with teams.
- Data Security – Protect sensitive financial data with password encryption.
Best Practices for Using a Cost Per Acquisition KPI Dashboard
To make the most of this dashboard, follow these best practices:
- Update Regularly – Enter actual data at the end of every month.
- Define KPIs Clearly – Ensure all team members understand KPI definitions.
- Use Conditional Formatting – Visual indicators highlight critical trends quickly.
- Keep Data Clean – Avoid duplicate or missing entries.
- Analyze Trends, Not Just Numbers – Focus on why CPA is rising or falling.
- Compare Across Channels – Track CPA separately for paid ads, referrals, email campaigns, etc.
Real-World Applications of CPA Dashboards
- E-commerce – Track CPA for Google Ads, Facebook Ads, and influencer campaigns.
- SaaS Companies – Analyze customer acquisition cost across free trials, demos, and conversions.
- Retail Chains – Measure acquisition through offline promotions and online campaigns.
- Consulting Firms – Assess CPA for lead generation campaigns.
- Startups – Optimize ad spend to achieve maximum ROI with limited budgets.
Conclusion
The Cost Per Acquisition KPI Dashboard in Excel is more than just a spreadsheet—it is a powerful decision-making tool. It helps businesses understand the effectiveness of their marketing efforts, identify cost-saving opportunities, and plan smarter campaigns.
By using this dashboard, you can track every dollar spent on acquiring customers and ensure your business remains profitable in a competitive environment.
Frequently Asked Questions (FAQs)
- What is a Cost Per Acquisition KPI Dashboard?
It is an Excel-based tool that tracks the cost of acquiring new customers. It consolidates data into a single dashboard and provides visual insights for better decision-making.
- Why should businesses track CPA?
Tracking CPA helps businesses optimize marketing budgets, reduce waste, and increase ROI. It also shows which campaigns deliver the best results.
- Can this dashboard be customized?
Yes, the dashboard is fully customizable. You can add new KPIs, adjust formulas, and include additional charts based on your needs.
- Is Excel the best tool for CPA dashboards?
Excel works well for small to mid-sized businesses. For large enterprises with complex datasets, Power BI, Tableau, or Google Data Studio may be more suitable.
- How often should I update the CPA dashboard?
Ideally, update the dashboard monthly. This ensures both MTD and YTD performance tracking remains accurate.
- Does this dashboard support year-over-year analysis?
Yes. It includes a Previous Year Numbers sheet to compare current performance with the past year.
- Who can benefit from this dashboard?
Marketing managers, financial analysts, startups, e-commerce businesses, and anyone who needs to measure acquisition costs effectively.
Visit our YouTube channel to learn step-by-step video tutorials
Watch the step-by-step video tutorial:
Click to buy now Cost Per Acquisition KPI Dashboard In Excel