In today’s fast-paced and temperature-sensitive logistics industry, maintaining product quality during transportation is more than just a necessity — it’s a competitive advantage. Whether you’re handling pharmaceuticals, fresh produce, or frozen food, a Cold Chain Logistics KPI Dashboard in Excel gives you real-time visibility into performance, compliance, and efficiency across the supply chain.
This ready-to-use and data-driven dashboard helps logistics professionals track, analyze, and visualize key performance indicators (KPIs) critical for maintaining cold chain integrity. Built entirely in Microsoft Excel, it provides an easy-to-navigate interface that helps organizations measure monthly and yearly performance, monitor trends, and ensure consistent quality assurance from source to destination.
Click to buy Cold Chain Logistics KPI Dashboard in Excel
What Is a Cold Chain Logistics KPI Dashboard?
A Cold Chain Logistics KPI Dashboard is a centralized data management tool designed to monitor all key aspects of temperature-controlled logistics operations. From on-time delivery performance and equipment efficiency to temperature compliance and spoilage rate — this dashboard consolidates all performance indicators into one visually interactive system.
By automating data tracking and analysis, the dashboard minimizes manual reporting errors, simplifies decision-making, and ensures that logistics teams maintain the required standards of product integrity throughout the supply chain journey.
Key Features of the Cold Chain Logistics KPI Dashboard in Excel
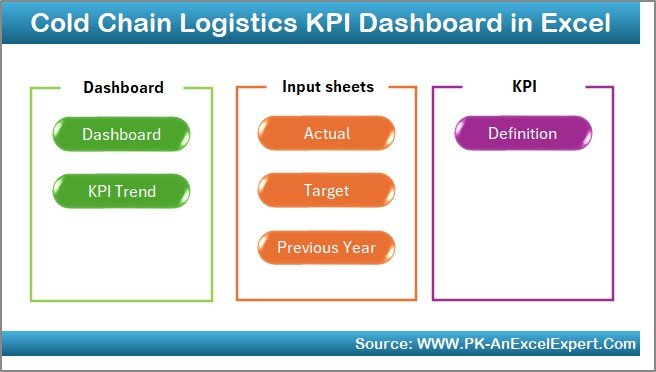
This professionally designed Excel dashboard consists of seven interactive worksheet tabs, each serving a unique function to streamline monitoring and analysis.
Home Sheet
The Home sheet serves as the control center of the entire dashboard.
It includes navigation buttons that allow users to jump directly to any specific sheet — such as Dashboard, Trend, Target, or KPI Definition — with a single click.
This interactive design ensures quick access, saves time, and enhances user experience.
Click to buy Cold Chain Logistics KPI Dashboard in Excel
Key Highlights:
- Interactive buttons for smooth navigation.
- Simple and clean layout for beginners.
- Centralized starting point for managing all KPI data.
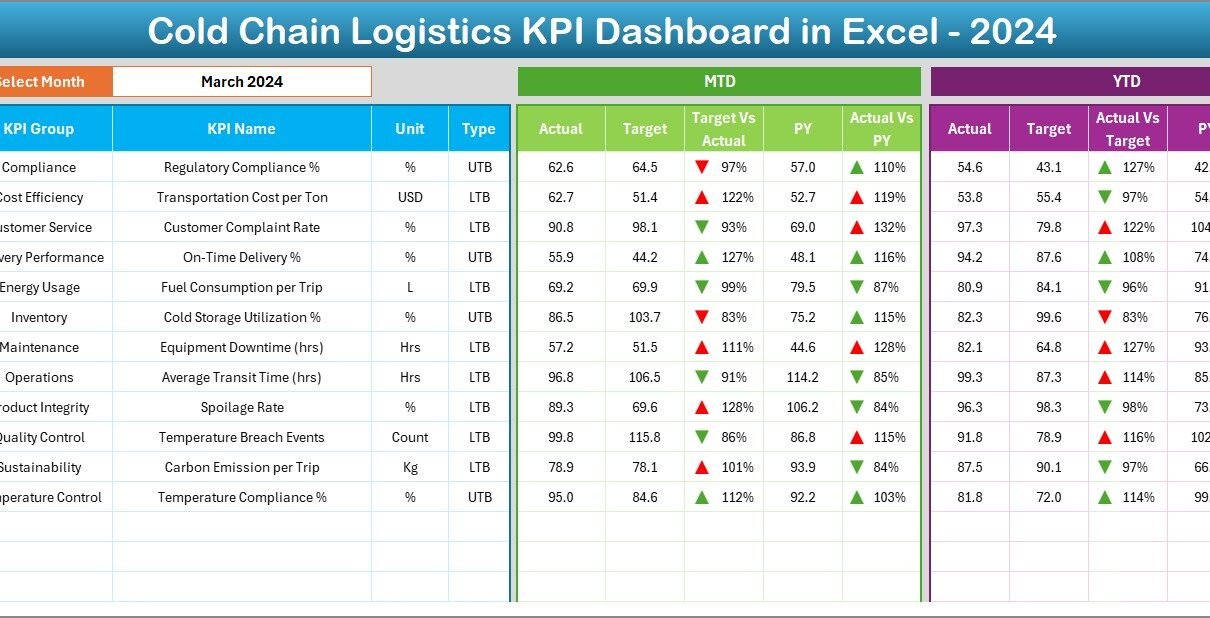
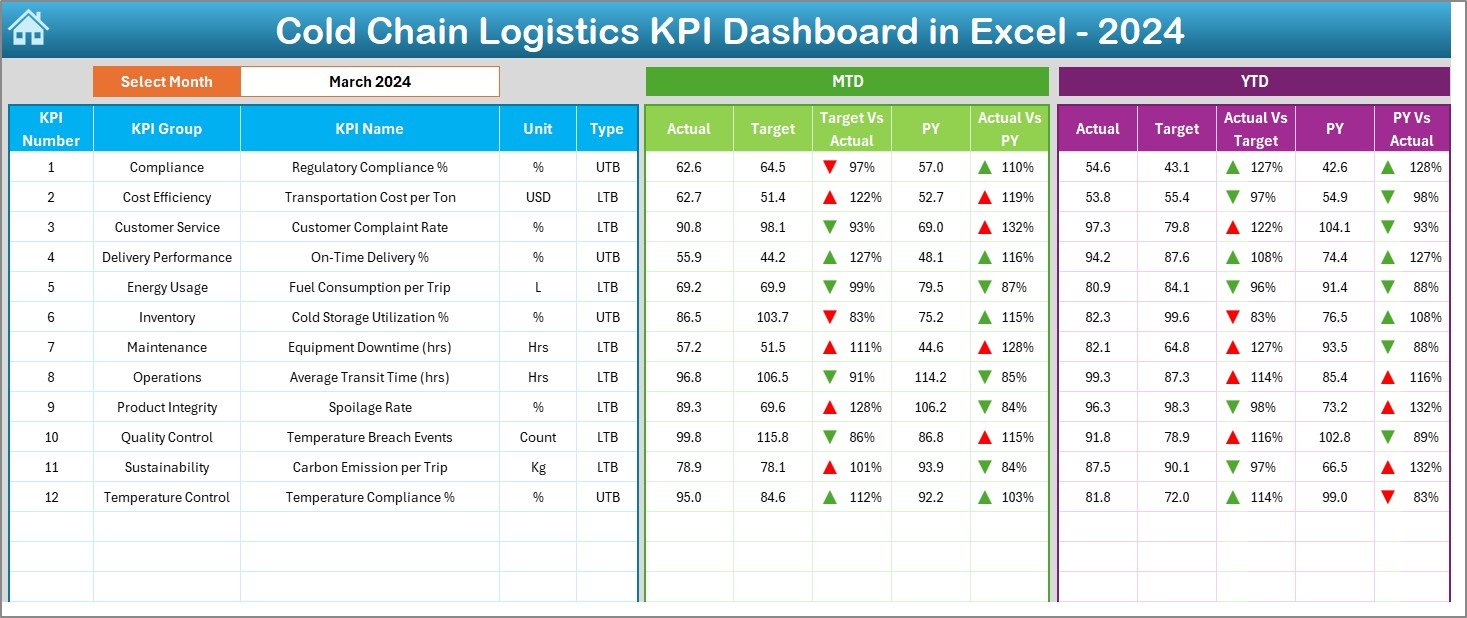
Dashboard Sheet
The Dashboard is the heart of the system — a one-stop visual representation of all major KPIs.
At the top of this sheet, users can select a specific month from a drop-down menu (located in cell D3). Once selected, all values across the dashboard update automatically for that month.
Core Components:
- Month-to-Date (MTD) Actual vs. Target vs. Previous Year comparisons.
- Year-to-Date (YTD) performance tracking with conditional formatting arrows (green for improvement, red for decline).
- Quick performance insights via KPI cards and trend visuals.
- Smart color-coded visuals that immediately show where performance meets or misses targets.
Click to buy Cold Chain Logistics KPI Dashboard in Excel
This page empowers decision-makers with real-time visibility of operational strengths and weaknesses, helping them respond promptly to deviations in cold chain standards.
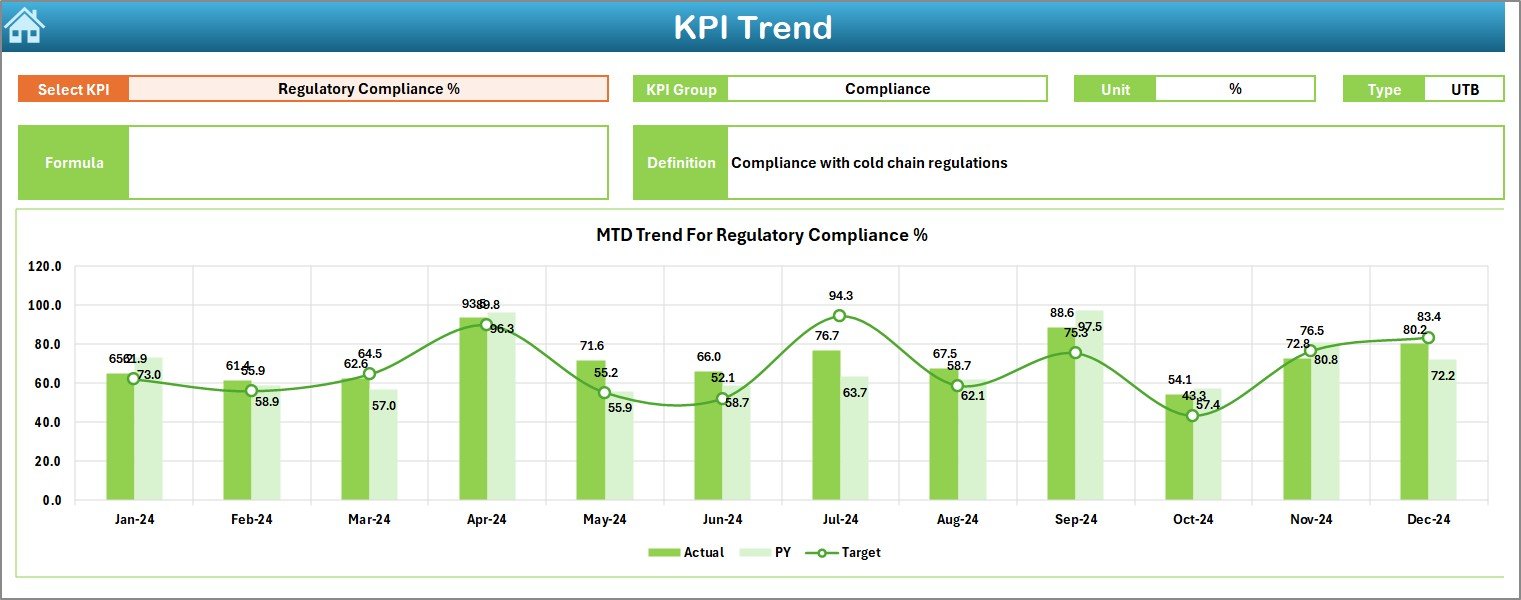
KPI Trend Sheet
The KPI Trend Sheet provides dynamic visual analytics for trend-based performance evaluation.
You can select any KPI from the drop-down menu in cell C3 to view:
- KPI Group
- Unit of Measurement
- KPI Type (UTB – Upper the Better or LTB – Lower the Better)
- KPI Formula
- KPI Definition
It also displays MTD and YTD trend charts that compare Actual, Target, and Previous Year data side by side.
This layout makes it easy to spot performance trends, seasonal impacts, and long-term improvements.
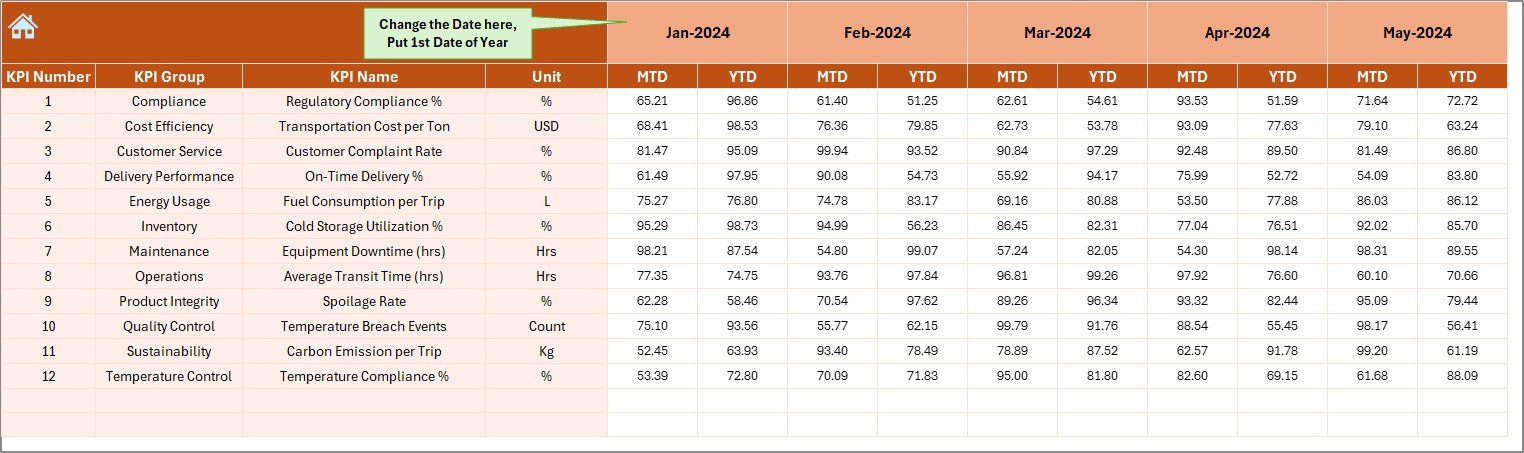
Actual Numbers Input Sheet
The Actual Numbers Input sheet is where operational teams record monthly data.
You simply need to input the actual values for MTD and YTD for the chosen month. The month can be easily updated in cell E1 — making it simple to roll forward each reporting period.
Advantages of This Design:
- Easy-to-use data entry form.
- Ensures data accuracy with structured input cells.
- Enables seamless monthly performance updates.
Click to buy Cold Chain Logistics KPI Dashboard in Excel
Target Sheet
In this sheet, you can define your monthly and annual performance benchmarks.
Users input MTD and YTD target numbers for each KPI, ensuring clear alignment between goals and results.
Benefits:
- Creates accountability within the logistics team.
- Encourages proactive performance management.
- Facilitates comparison with actual and previous year data.
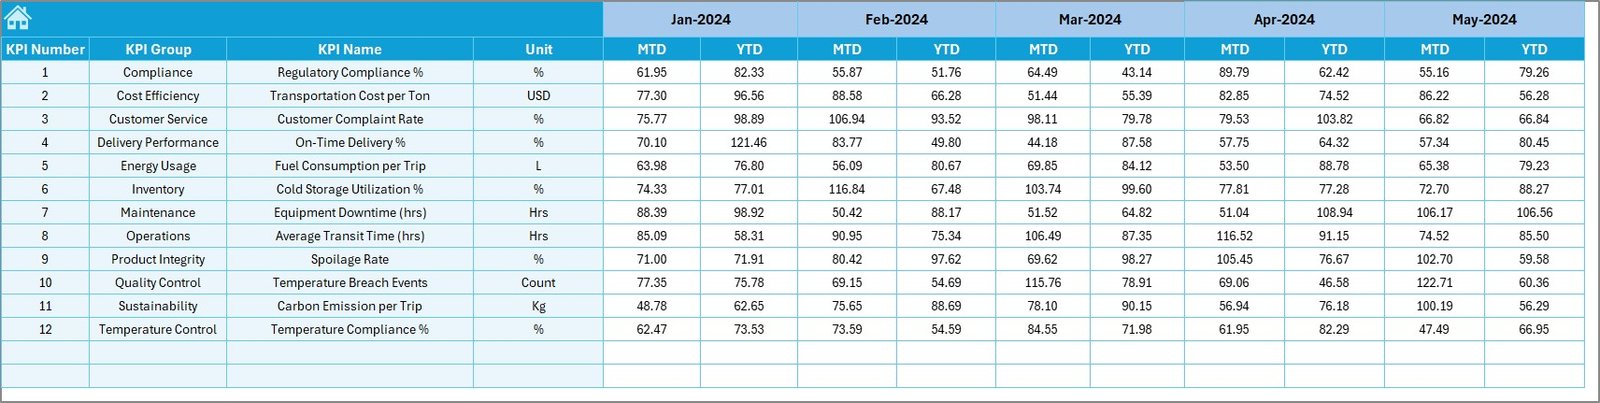
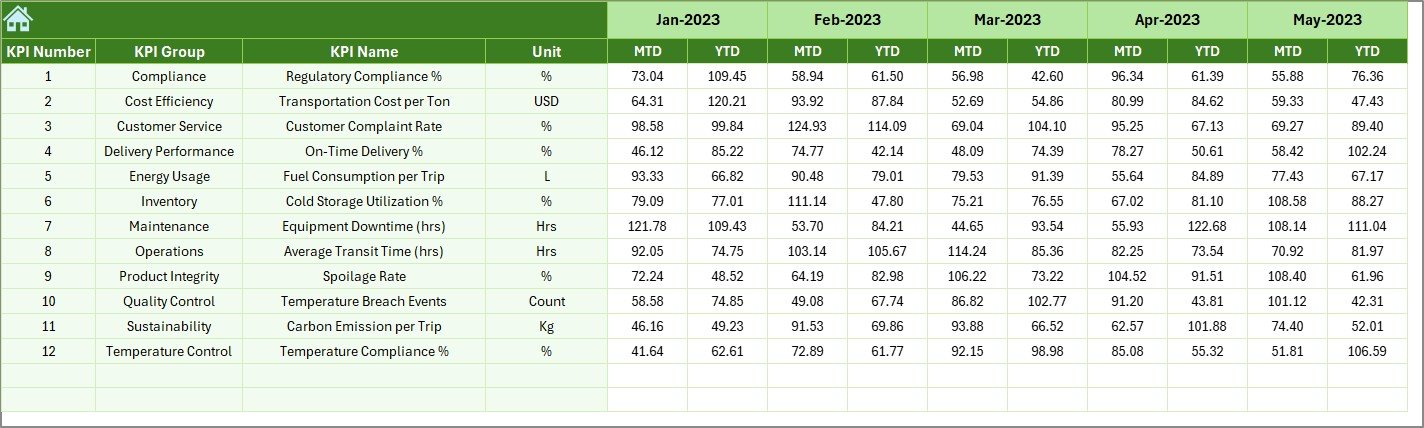
Previous Year Numbers Sheet
This sheet holds the reference data for historical analysis.
You can enter monthly MTD and YTD performance metrics from the previous year, enabling accurate year-over-year (YoY) comparisons.
By maintaining consistent data structures, it becomes effortless to evaluate growth, identify recurring issues, and set realistic targets for future operations.
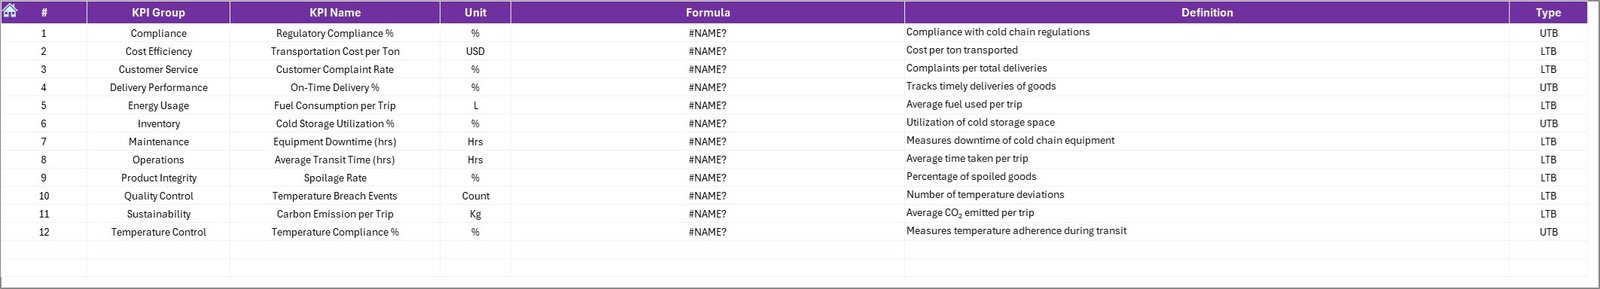
KPI Definition Sheet
The KPI Definition Sheet acts as a centralized reference for all KPI-related information.
It includes columns for:
- KPI Group
- KPI Name
- Unit
- Formula
- Definition
- KPI Type (UTB or LTB)
This makes it easy for team members, auditors, and analysts to understand the logic behind every performance metric.
Click to buy Cold Chain Logistics KPI Dashboard in Excel
Why Cold Chain Logistics Needs a KPI Dashboard
In cold chain logistics, maintaining temperature-sensitive product quality involves several moving parts — vehicles, warehouses, monitoring devices, and personnel. A KPI Dashboard bridges the gap between raw data and actionable insights.
Key reasons why it’s essential:
- Tracks the temperature compliance rate to prevent spoilage.
- Measures on-time delivery to ensure customer satisfaction.
- Monitors energy efficiency and equipment reliability.
- Reduces manual tracking errors and reporting delays.
- Supports data-driven decision-making across departments.
Common KPIs in Cold Chain Logistics
Advantages of Cold Chain Logistics KPI Dashboard in Excel
Implementing a KPI Dashboard in Excel brings numerous operational and strategic advantages.
Performance Transparency
Mnagers can monitor all key metrics — from temperature control to delivery timelines — in a single unified system.
Data-Driven Decisions
With real-time insights, leaders can make faster, more informed decisions to optimize performance.
Time Savings
Automation eliminates repetitive manual work, freeing up time for strategic analysis.
Continuous Improvement
Historical data comparisons help identify recurring issues and areas needing optimization.
Cost Efficiency
Since the tool is Excel-based, there’s no need for complex software installations — making it accessible and cost-effective.
Scalability
The dashboard can easily grow with your business by adding new KPIs or linking multiple warehouse datasets.
How to Use the Cold Chain Logistics KPI Dashboard in Excel
Here’s a step-by-step guide to making the most out of this Excel-based dashboard:
- Open the file and go to the Home sheet.
- Navigate to the KPI Definition sheet and review all KPI details.
- Update the Target sheet with new goals for the current year.
- Enter actual monthly data in the Actual Numbers Input sheet.
- Update Previous Year Numbers for comparison.
- Go to the Dashboard and select the desired month from the drop-down menu.
- Analyze MTD and YTD results using conditional arrows and trend charts.
- Review KPI-specific insights in the KPI Trend sheet for deeper performance tracking.
Insights You Can Gain from the Dashboard
Once your data is entered, you can uncover valuable business insights, such as:
- Monthly improvement in on-time deliveries.
- Temperature deviations per region or vehicle.
- Year-over-year cost reduction.
- Correlation between cooling downtime and spoilage rates.
- Seasonal trend impacts on logistics efficiency.
These insights help optimize delivery routes, enhance maintenance scheduling, and improve resource utilization.
Who Can Use This Dashboard?
This dashboard is versatile and useful for multiple stakeholders within the cold chain ecosystem:
- Logistics Managers: To monitor fleet performance.
- Quality Assurance Teams: To ensure temperature compliance.
- Warehouse Supervisors: To track equipment uptime and storage performance.
- Finance Teams: To measure cost efficiency and budget variance.
- Operations Analysts: To build reports and trend analyses.
Benefits of Using Excel for Cold Chain KPI Tracking
While there are several modern analytics tools available, Excel remains one of the most adaptable platforms for KPI management.
Here’s why:
- Universal Accessibility: Every professional knows Excel.
- No Subscription Cost: Unlike BI tools, Excel requires no recurring fees.
- Full Control: Users can customize formulas, visuals, and data sources.
- Offline Capability: Perfect for logistics operations with limited connectivity.
- Integration Flexibility: Can connect with other systems via CSV or Power Query.
Best Practices for the Cold Chain Logistics KPI Dashboard in Excel
To maximize dashboard efficiency and accuracy, follow these best practices:
1. Maintain Data Consistency
Use standardized units, formats, and timeframes to ensure correct analysis.
2. Automate Calculations
Leverage Excel formulas (e.g., AVERAGE, IF, VLOOKUP) to minimize manual computation.
3. Regularly Update Data
Keep MTD and YTD records updated monthly for real-time visibility.
4. Review KPI Definitions
Ensure that everyone in the organization understands each KPI’s formula and purpose.
5. Use Conditional Formatting
Highlight underperforming metrics instantly with color-coded arrows or icons.
6. Back Up Data
Maintain backups of your previous month’s data to prevent accidental loss.
7. Customize for Your Industry
Adapt KPIs to match your sector — e.g., pharmaceutical logistics, dairy, or frozen food distribution.
Opportunities for Improvement
Even though Excel dashboards are powerful, continuous improvement keeps them effective.
Consider implementing the following enhancements:
- Add Power Query for automated data refresh.
- Integrate Power BI visuals for more advanced analysis.
- Introduce macros to automate data input and monthly report generation.
- Use data validation to prevent incorrect entries.
- Apply pivot charts for deeper filtering and analysis.
Conclusion
The Cold Chain Logistics KPI Dashboard in Excel is more than a tracking tool — it’s a comprehensive performance management solution.
It allows logistics managers to monitor every critical KPI, evaluate historical trends, and take corrective actions before issues escalate.
By transforming raw data into actionable insights, this dashboard ensures better compliance, reduced spoilage, optimized costs, and improved delivery performance.
Whether you’re a global logistics provider or a regional transporter, this Excel-based system helps maintain cold chain integrity while maximizing operational efficiency.
Frequently Asked Questions (FAQs)
- What is a Cold Chain KPI?
A Cold Chain KPI (Key Performance Indicator) measures the effectiveness and reliability of temperature-controlled logistics operations — such as temperature deviations, delivery times, or spoilage rates.
- Can this dashboard be customized?
Yes. Since it’s built in Excel, users can easily add or remove KPIs, modify formulas, and customize visuals according to business needs.
- Do I need Excel expertise to use it?
Not at all. The dashboard is designed for ease of use — even non-technical users can navigate and update it using the dropdown menus and data input sheets.
- How often should I update the data?
You should update it monthly to keep the MTD and YTD calculations accurate.
- Can I integrate it with Power BI?
Yes. The data structure in this Excel dashboard is compatible with Power BI, allowing seamless visualization upgrades later.
Visit our YouTube channel to learn step-by-step video tutorials
Click to buy Cold Chain Logistics KPI Dashboard in Excel
Watch the step-by-step video tutorial: