In today’s fast-paced automotive industry, data-driven decision-making is the key to staying ahead. Whether you manage a manufacturing plant, dealership network, or service center, tracking the right Key Performance Indicators (KPIs) ensures that every operation runs smoothly and profitably.
The Automotive KPI Scorecard in Excel is a ready-to-use template designed to help you monitor, measure, and analyze business performance in one interactive dashboard. This article explains everything you need to know — from how it works to its advantages, best practices, and real-world applications.
Click to buy Automotive KPI Scorecard in Excel
What Is an Automotive KPI Scorecard in Excel?
An Automotive KPI Scorecard in Excel is a structured performance management tool that consolidates business data and converts it into meaningful insights. It brings together different performance metrics — such as production efficiency, sales growth, customer satisfaction, and inventory turnover — into one single view.
Instead of using multiple spreadsheets or manual reports, this scorecard helps managers evaluate Month-to-Date (MTD) and Year-to-Date (YTD) results instantly. You can compare actual performance against targets, visualize trends, and take corrective actions quickly.
Excel’s powerful formulas, conditional formatting, and charting capabilities make it a perfect platform for this tool. The best part? You can customize it for your specific business needs without any programming.
Structure of the Automotive KPI Scorecard Template
The Automotive KPI Scorecard in Excel template consists of four main worksheets — each designed to simplify data management and visualization.
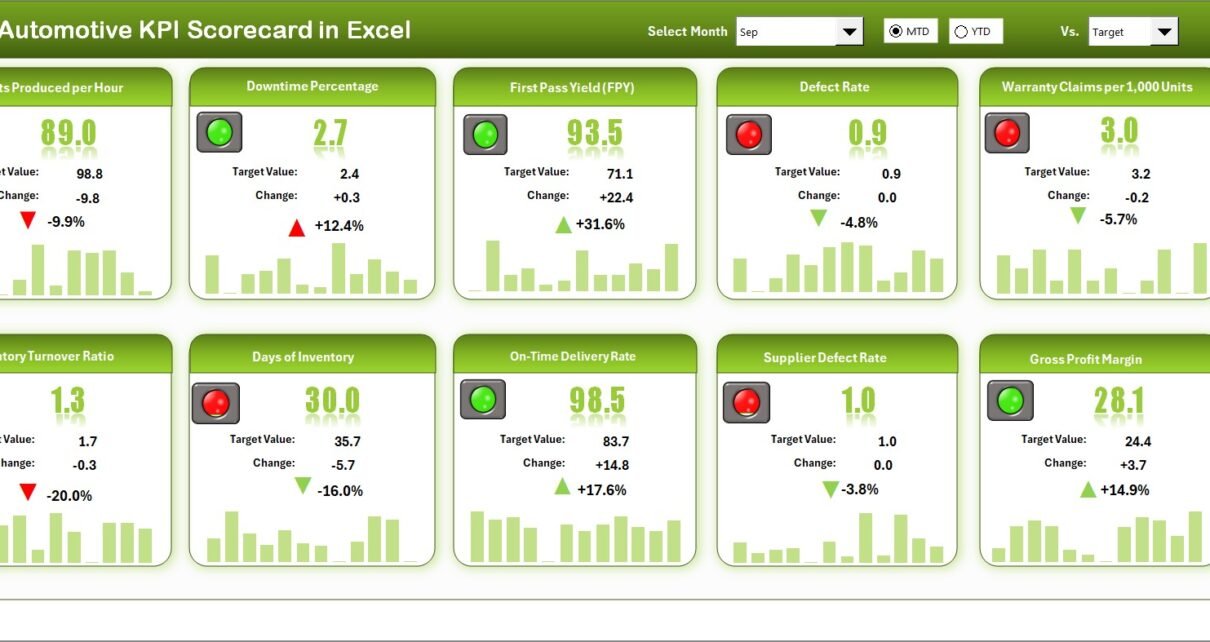
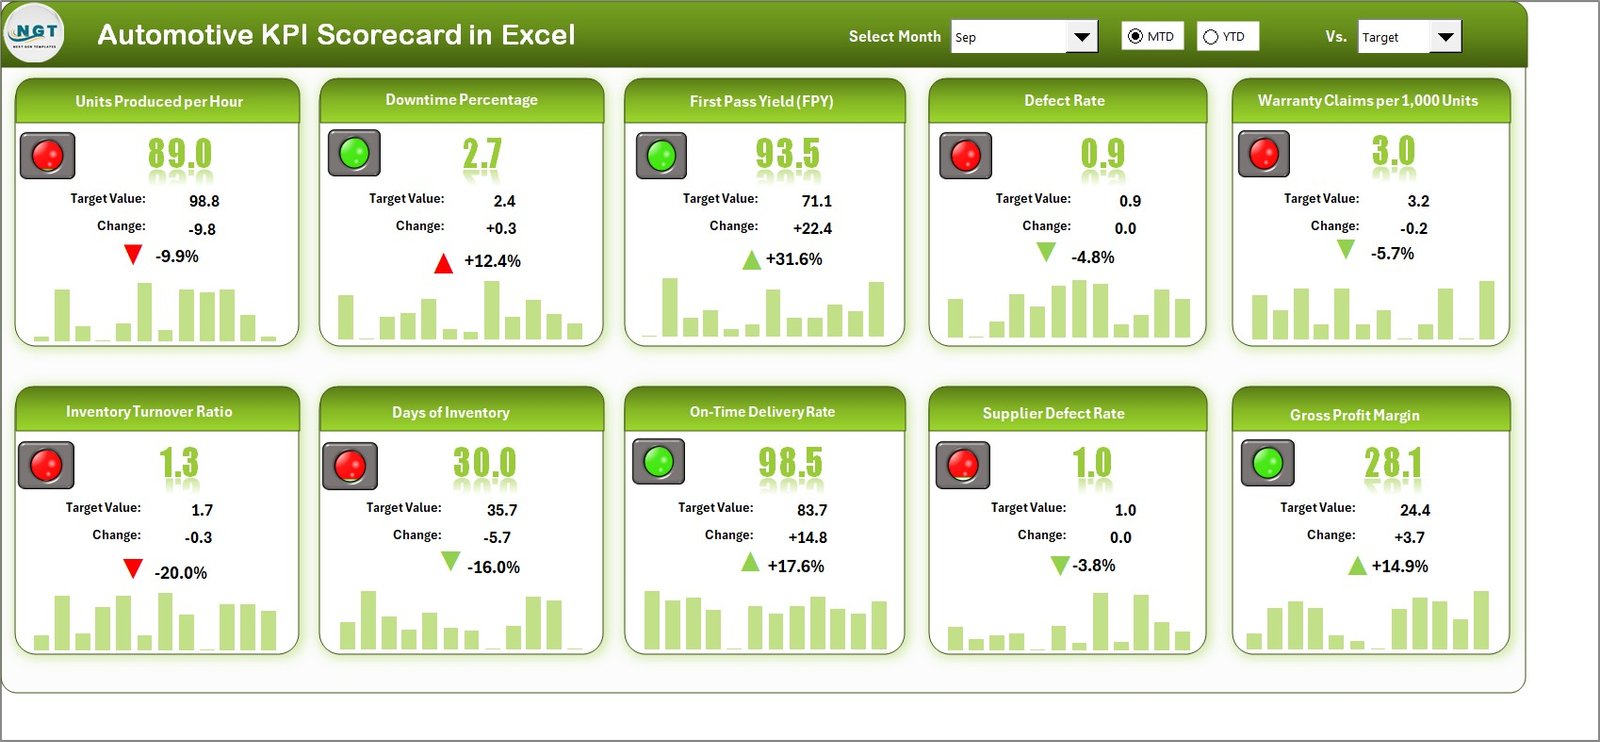
Scorecard Sheet – The Dashboard View
This is the main interface where you can view overall KPI performance in one place.
Key Features:
- Dropdown Menus: Select the desired month and choose MTD or YTD view to analyze performance at different time frames.
- Actual vs Target Values: Instantly compare actual results with the target for each KPI.
- Color-Coded Indicators: Use green, yellow, or red icons to show performance status.
- Comprehensive KPI Overview: Display up to 10 KPIs with MTD and YTD comparisons.
- Smart Navigation: Jump easily between sheets using hyperlinks or buttons.
Click to buy Automotive KPI Scorecard in Excel
This sheet acts as the control center of the entire scorecard.
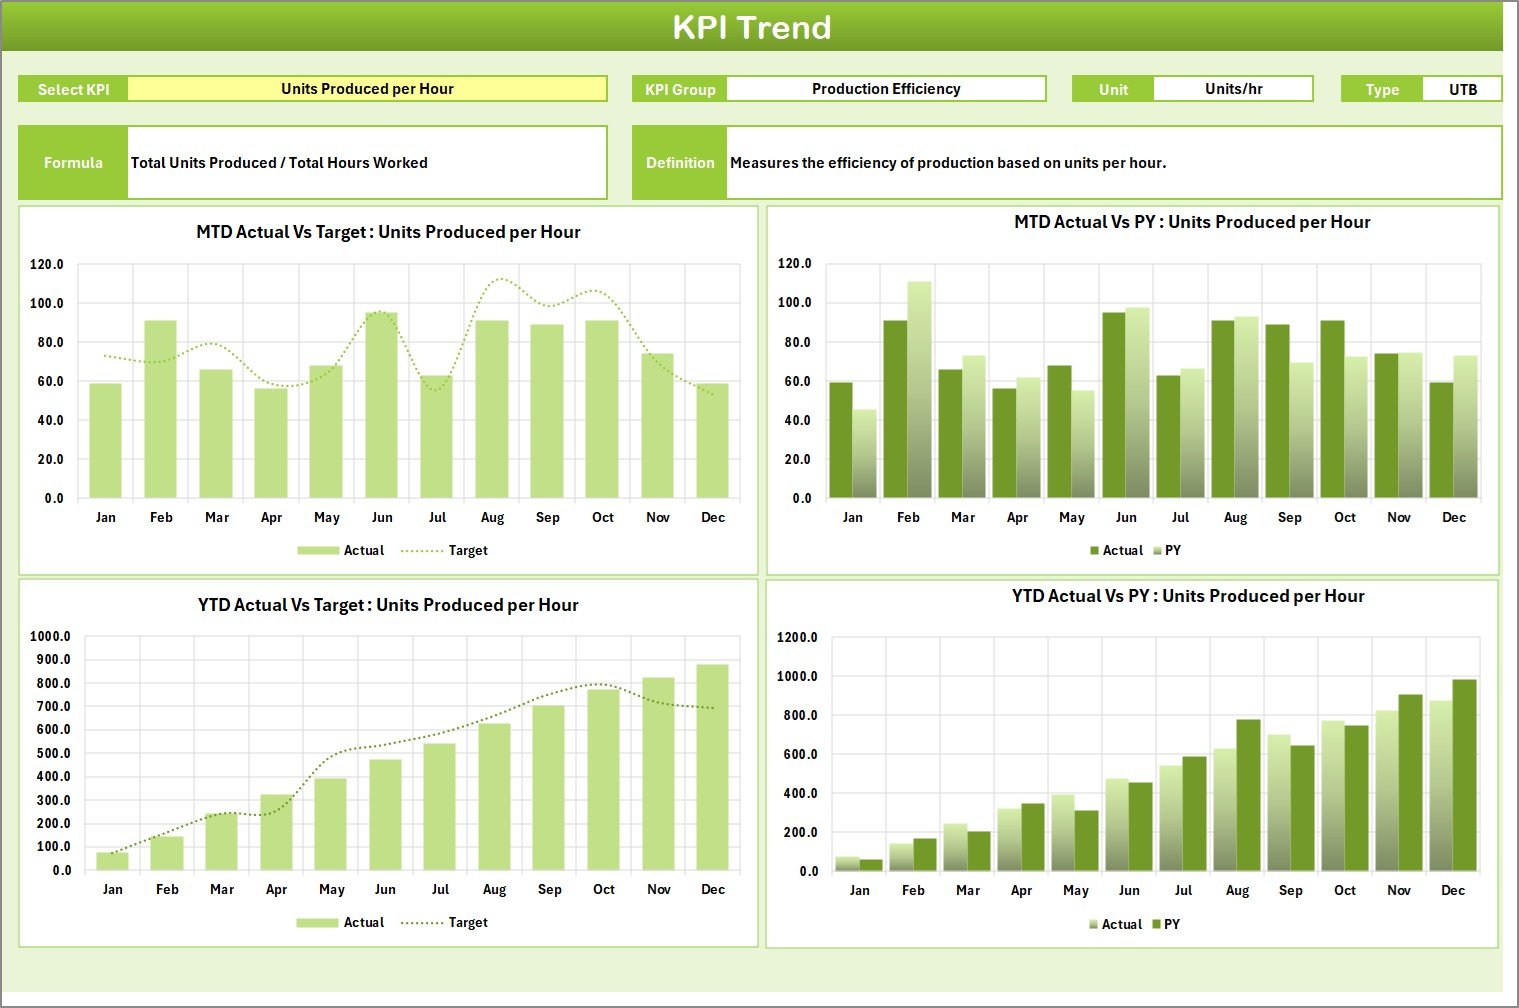
KPI Trend Sheet – Track Progress Over Time
The KPI Trend Sheet gives you detailed insights into how each KPI performs month after month.
Highlights:
- A dropdown (cell C3) lets you select any KPI to view its trend.
- It shows the KPI Group, Unit, Type (UTB or LTB), Formula, and Definition.
- Visual trend charts display MTD and YTD data for Actual, Target, and Previous Year (PY).
- Helps identify seasonal trends and performance gaps.
This sheet is ideal for analyzing long-term patterns in production, sales, or efficiency.
Click to buy Automotive KPI Scorecard in Excel
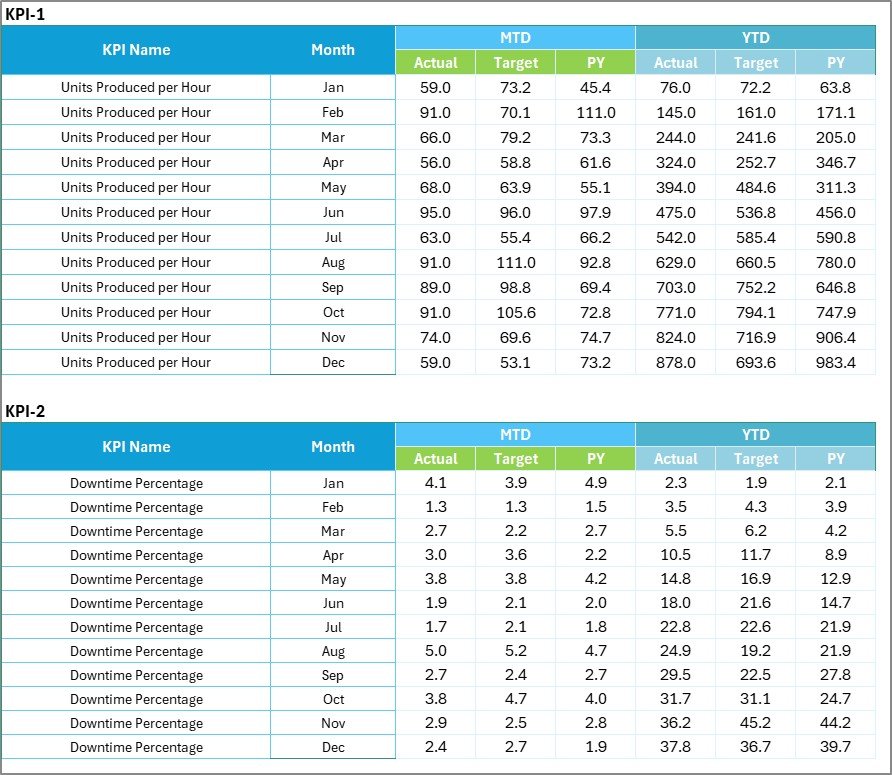
Input Data Sheet – Enter and Manage All KPI Values
The Input Data Sheet is where you record and manage your performance metrics.
Features:
- Store all monthly KPI data, including Actuals, Targets, and Previous Year numbers.
- Easily update figures to keep your scorecard current.
- Maintain historical data for trend and variance analysis.
- Support formulas for auto-calculating totals and averages.
This sheet ensures your data remains consistent and ready for real-time reporting.
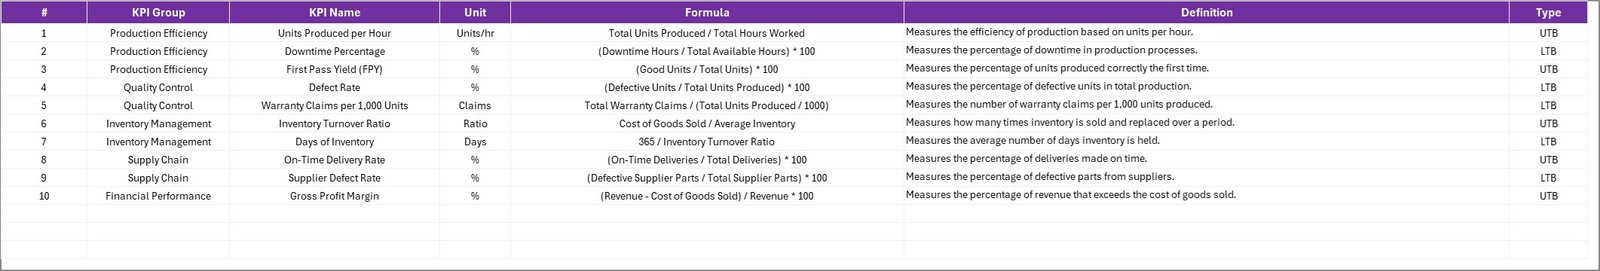
KPI Definition Sheet – Document Every Metric Clearly
This sheet defines the logic and purpose of each KPI.
You can enter:
- KPI Name
- KPI Group (e.g., Production, Sales, Quality, Service)
- Unit of Measurement
- Formula
- KPI Definition
- Performance Type (UTB – Upper the Better / LTB – Lower the Better)
Keeping KPI definitions organized ensures everyone in your team understands how each metric is measured and interpreted.
Click to buy Automotive KPI Scorecard in Excel
Why Use a KPI Scorecard for the Automotive Industry?
The automotive sector involves complex processes — from production and logistics to customer experience. Managing all these areas without data visualization can be overwhelming.
A KPI Scorecard in Excel helps align goals across departments and ensures that every manager focuses on the right indicators.
Here’s why it matters:
- Tracks productivity, sales, and quality in real time
- Improves communication and accountability
- Reduces manual reporting effort
- Highlights underperforming areas early
- Simplifies strategic planning and forecasting
Advantages of the Automotive KPI Scorecard in Excel
- Easy to Use and Customize
Excel’s familiar interface allows users to add or remove KPIs, adjust formulas, and redesign visuals without coding.
- Real-Time Performance Tracking
By regularly updating data, managers can track how departments perform at any time.
- Visual Insights Through Charts
Graphs and conditional formatting instantly highlight which KPIs are performing well and which need attention.
- Improved Decision-Making
Comparing actual vs target and PY data helps you understand trends and prioritize actions.
- Cost-Effective Solution
No need for expensive BI tools — Excel provides all the required functions for small and medium automotive businesses.
- Data Consistency Across Teams
The KPI Definition sheet ensures that all departments use the same performance logic and calculation method.
- Time Saving
Automation of reports and dashboards reduces time spent on manual reporting.
How to Use the Automotive KPI Scorecard in Excel Effectively
Follow these steps to get the most from your scorecard:
- Set Clear KPIs: Identify which KPIs align with your business goals (e.g., reduce defect rate by 10%).
- Input Accurate Data: Regularly update actual and target values in the Input Data Sheet.
- Review Trends: Use the KPI Trend Sheet to identify areas that require improvement.
- Analyze Gaps: Focus on KPIs with the biggest variance between actual and target.
- Take Action: Create action plans for underperforming metrics.
- Share Insights: Use the dashboard for management meetings and performance reviews.
Real-World Applications of the Automotive KPI Scorecard
- Manufacturing Plants
Monitor production efficiency, quality defects, and resource utilization across multiple shifts or lines.
- Dealership Networks
Track monthly sales performance, conversion rates, and revenue targets.
- Service Centers
Evaluate service turnaround time, customer satisfaction, and repeat service rates.
- Supply Chain and Logistics
Monitor vendor reliability, delivery lead times, and transportation costs.
- Finance and Administration
Keep track of cost per vehicle, gross margin, and profitability across models or regions.
Key Components of a High-Performing KPI Scorecard
A powerful KPI Scorecard combines both quantitative metrics and visual storytelling.
Must-Have Elements:
- KPI Name and Group
- Unit and Target
- Actual Values (MTD & YTD)
- Comparison with Previous Year
- Visual Indicators (Arrows or Color Codes)
- Trend Charts
- Filters for Month and Category
These components help managers make fast, informed decisions.
Best Practices for the Automotive KPI Scorecard in Excel
Implementing the right approach ensures accurate insights and better performance tracking.
- Keep It Simple
Avoid overloading your scorecard with too many KPIs. Focus on 10–15 metrics that truly matter. - Use Consistent Units and Definitions
Always define KPIs clearly to prevent confusion between departments. - Automate Data Updates
Link your data source (if possible) or set formulas to auto-update monthly totals. - Maintain Version Control
Save dated versions or use version tracking to prevent overwriting data. - Review Regularly
Schedule monthly reviews with department heads to discuss trends and actions. - Visualize with Purpose
Use charts to tell a story, not just to decorate. Highlight the most important insights. - Align with Business Goals
Ensure each KPI directly contributes to strategic objectives like cost reduction or customer retention.
Opportunities for Improvement
While Excel is powerful, you can further enhance your KPI Scorecard by:
- Integrating Power Query for automated data import
- Using Power BI for advanced visualization
- Adding slicers and pivot tables for deeper analysis
- Protecting formulas and critical cells to prevent accidental edits
- Including dynamic targets and benchmark comparisons
Conclusion
The Automotive KPI Scorecard in Excel transforms complex performance data into simple, actionable insights. It enables business leaders to monitor efficiency, profitability, and quality across departments — all from one unified dashboard.
Whether you’re managing production, service, or sales, this tool provides the visibility you need to make informed decisions and drive continuous improvement.
By following the best practices and updating your data regularly, you can turn your Excel scorecard into a powerful engine for business growth.
Frequently Asked Questions (FAQs)
- What is the purpose of an Automotive KPI Scorecard?
It helps track and measure key performance indicators across departments like production, sales, quality, and service to improve operational efficiency.
- How often should I update my KPI Scorecard?
You should update it monthly for MTD and YTD data, but some KPIs (like production efficiency) can also be tracked weekly.
- Can I customize the KPIs in this Excel template?
Yes, the template is fully editable. You can add, remove, or rename KPIs as per your business requirements.
- What is the difference between MTD and YTD in this scorecard?
- MTD (Month-to-Date) shows results from the start of the month up to today.
- YTD (Year-to-Date) displays results accumulated since the beginning of the year.
- What type of visuals can I use in this scorecard?
You can include charts like bar graphs, line charts, and gauges to show performance trends and progress toward targets.
- Is Excel better than Power BI for KPI dashboards?
Excel is more suitable for small- to medium-sized setups that prefer offline data entry and simple visualization. Power BI is ideal for large datasets and automated reporting.
- Can this scorecard help improve productivity?
Absolutely! By tracking metrics like efficiency, defect rate, and employee performance, you can identify issues early and optimize operations.
- Does this template include conditional formatting?
Yes, it includes color-coded visuals (like green for good, red for poor) to quickly show KPI performance status.
Visit our YouTube channel to learn step-by-step video tutorials
Watch the step-by-step video tutorial:
Click to buy Automotive KPI Scorecard in Excel