In today’s data-driven workplace, HR leaders cannot rely on guesswork to make strategic decisions. Measuring employee performance, monitoring recruitment efficiency, and ensuring workforce satisfaction all demand accurate, timely data. That’s where the Human Resources (HR) KPI Dashboard in Excel becomes a powerful solution.
This ready-to-use Excel dashboard empowers HR professionals to track critical metrics, visualize performance, and optimize workforce operations. Whether you manage a corporate HR department, a small business, or a multi-location enterprise, this dashboard delivers instant insights into employee productivity, hiring performance, and retention trends — all from one dynamic Excel file.
Click to buy Human Resources (HR) KPI Dashboard in Excel
What Is a Human Resources KPI Dashboard in Excel?
A Human Resources (HR) KPI Dashboard in Excel is a visual and analytical tool designed to monitor the key performance indicators (KPIs) that define HR success. It centralizes important metrics — such as turnover rate, employee satisfaction, absenteeism, training efficiency, and recruitment cycle time — into a single interactive platform.
Unlike static reports, this Excel-based dashboard allows HR teams to switch between Month-to-Date (MTD) and Year-to-Date (YTD) views, compare results with targets, and track progress over time. With color-coded visuals and trend charts, it instantly highlights performance gaps and opportunities for improvement.
Structure of the HR KPI Dashboard in Excel
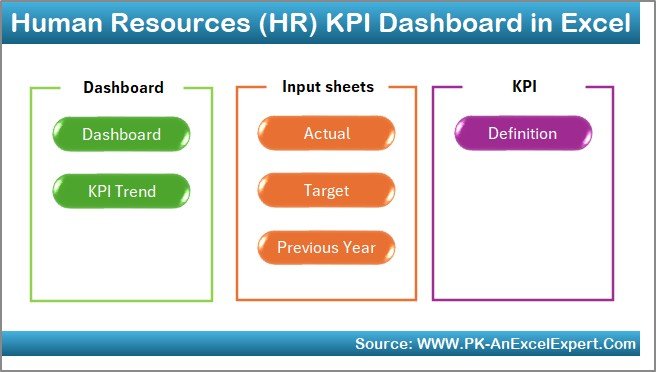
This dashboard template consists of seven powerful worksheet tabs, each serving a specific function to make HR performance tracking simple, visual, and actionable.
Home Sheet
The Home sheet acts as the command center.
It features six navigation buttons that let users jump directly to the relevant sheets — such as Dashboard, KPI Trend, Target, or KPI Definition.
This structure makes it user-friendly and perfect for HR professionals who want to avoid complex navigation.
Click to buy Human Resources (HR) KPI Dashboard in Excel
Dashboard Sheet Tab
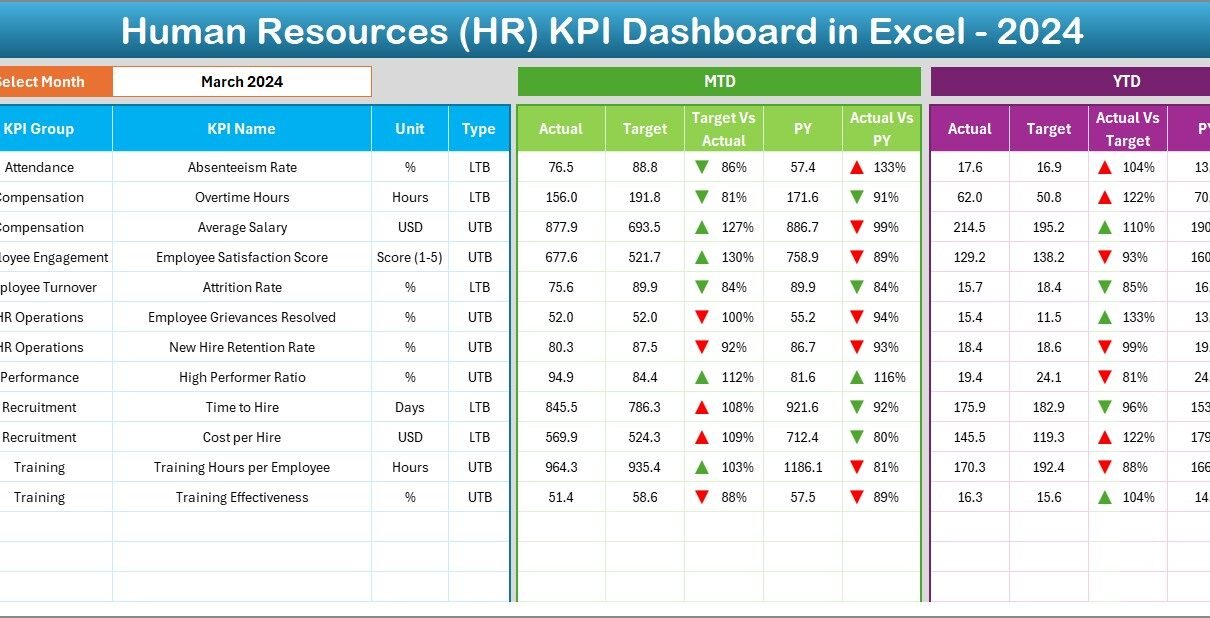
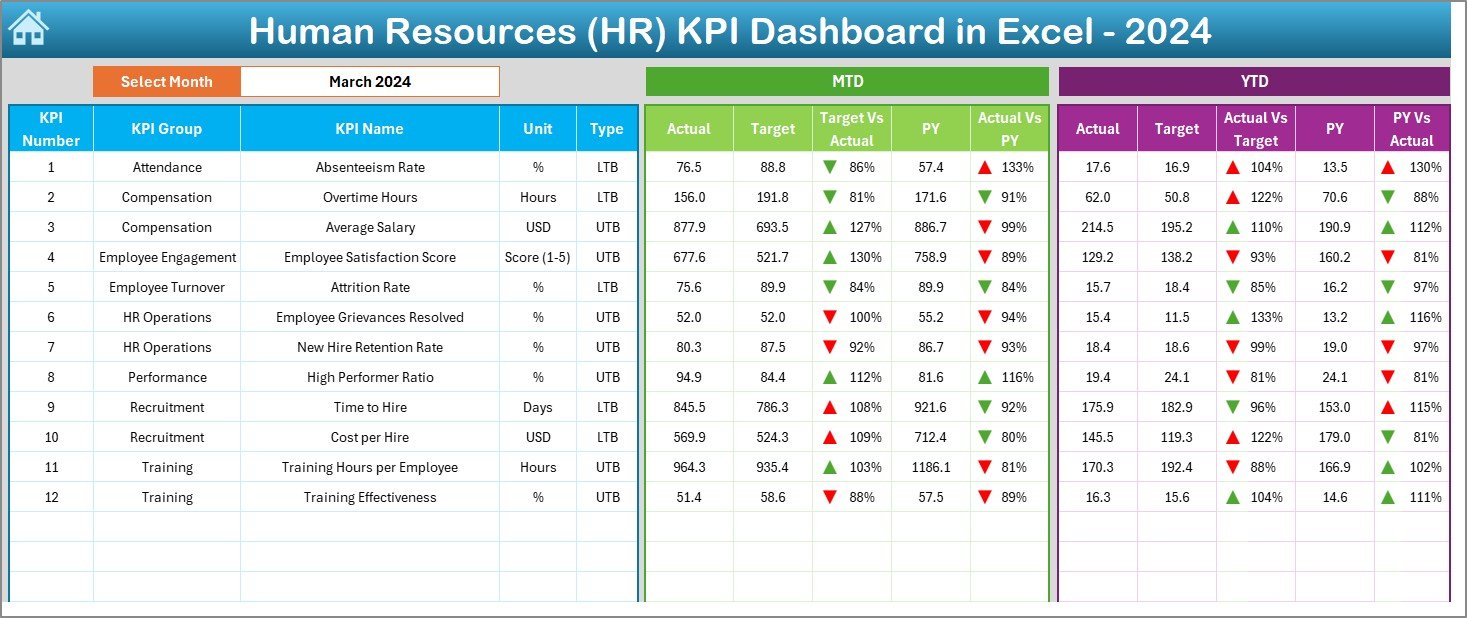
The Dashboard sheet is the main display where all KPIs come to life.
Here’s what makes it exceptional:
- Dynamic Month Selection: Use the drop-down in cell D3 to select any month, and the dashboard instantly updates.
- Performance Views: It presents MTD and YTD performance for each KPI with side-by-side comparisons.
- Conditional Formatting: Red and green arrows indicate whether KPIs are improving or declining.
- Comprehensive Insights: You can compare actual results against targets and previous-year data at a glance.
This interactivity helps HR managers quickly identify which metrics are on track and which need immediate attention.
Click to buy Human Resources (HR) KPI Dashboard in Excel
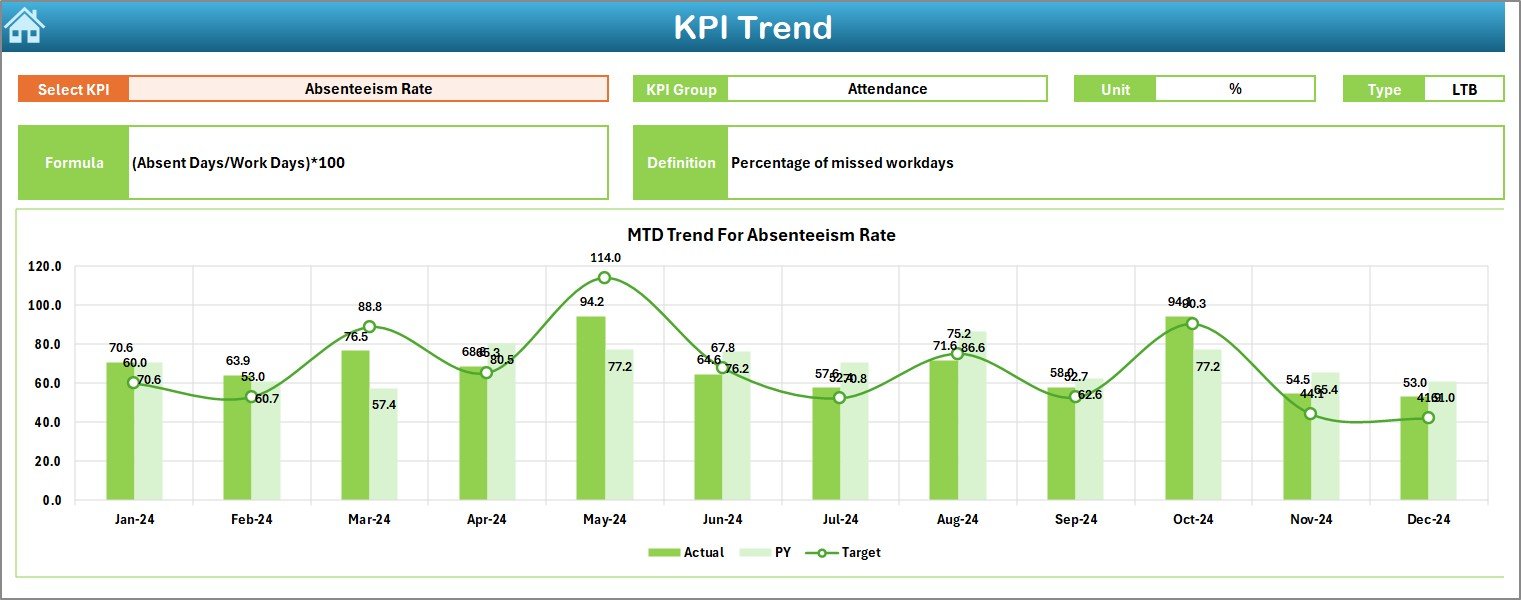
KPI Trend Sheet Tab
The KPI Trend sheet offers detailed analytical insights for each performance metric.
By selecting a KPI from the drop-down in cell C3, you can:
- View its group, unit, and type (UTB or LTB)
- See its formula and definition
- Explore trend charts for MTD and YTD data, covering Actual, Target, and Previous Year numbers
These visuals make trend analysis simple and effective, turning complex data into actionable intelligence.
Click to buy Human Resources (HR) KPI Dashboard in Excel
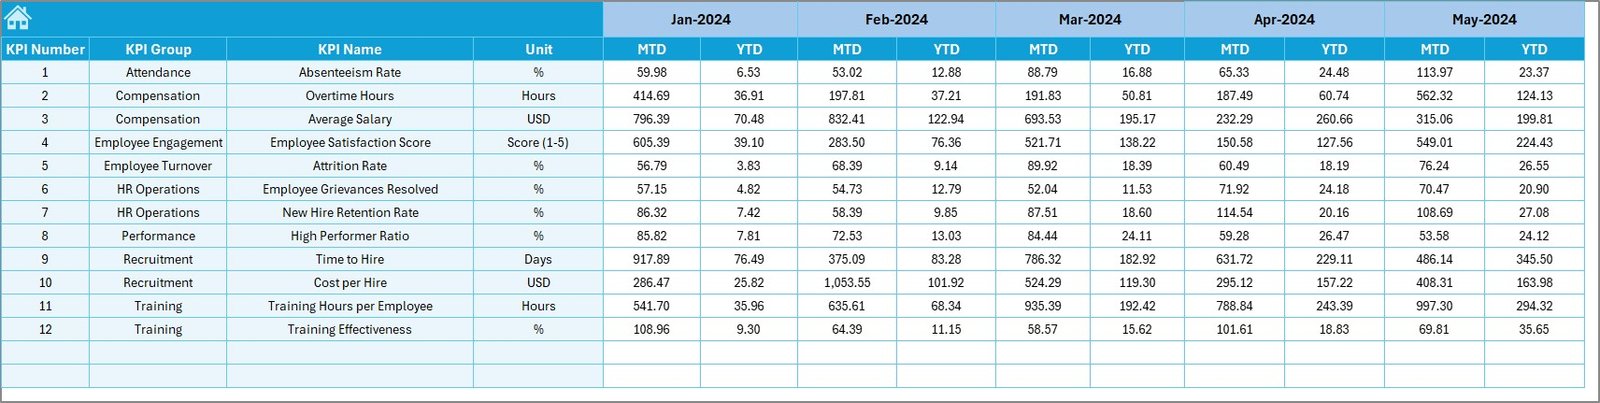
Actual Numbers Input Sheet
This is the data entry zone for all actual HR performance numbers.
You can easily update MTD and YTD figures month by month.
Simply change the month in cell E1 to refresh the data range.
With consistent data entry, the dashboard automatically recalculates all performance metrics, keeping results accurate and up-to-date.
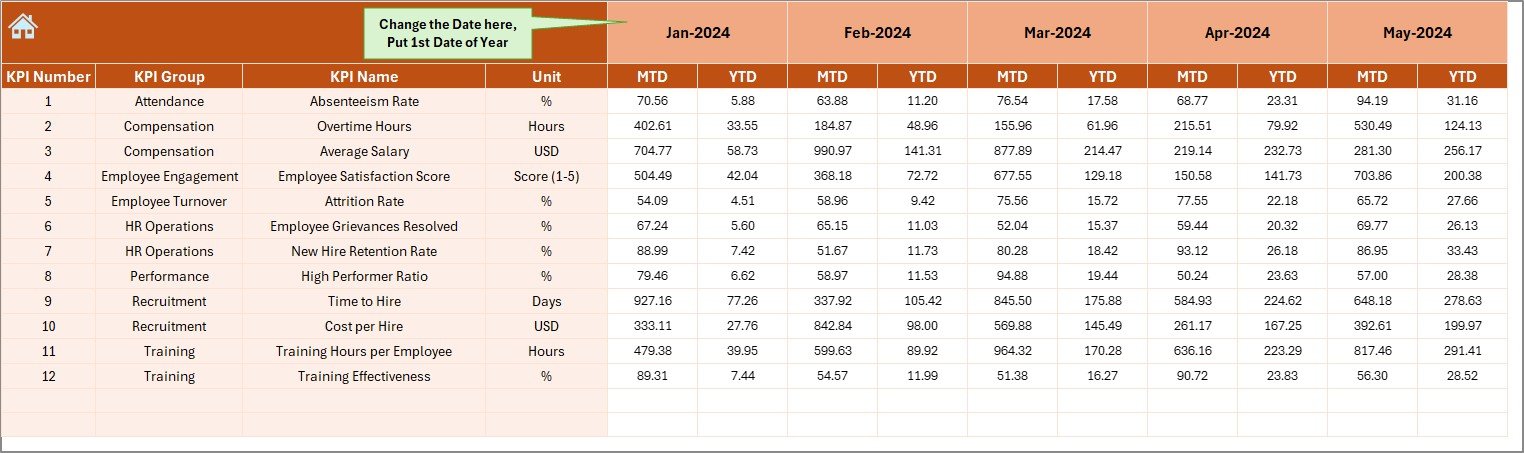
Target Sheet Tab
The Target sheet allows users to set performance goals for every KPI.
Each metric can have monthly MTD and YTD targets.
When combined with actual performance data, this sheet makes it easy to analyze achievement percentages and monitor progress toward HR objectives.
Click to buy Human Resources (HR) KPI Dashboard in Excel
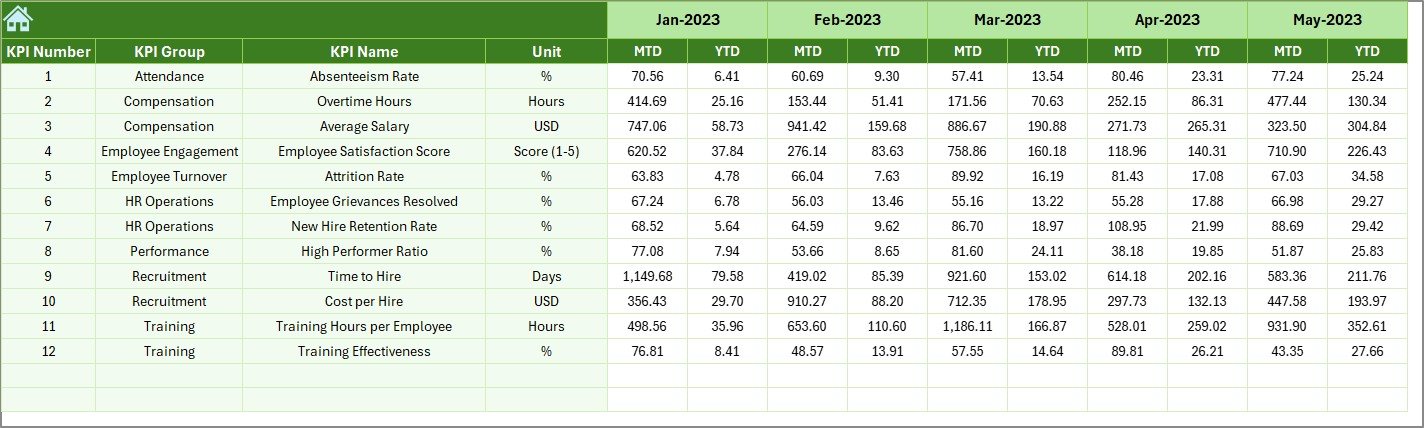
Previous Year Number Sheet
This sheet stores historical performance data.
By comparing current results with previous-year numbers, HR managers can evaluate whether the organization’s performance is improving over time.
It’s particularly useful for identifying long-term HR trends like turnover reduction or improvement in training hours.
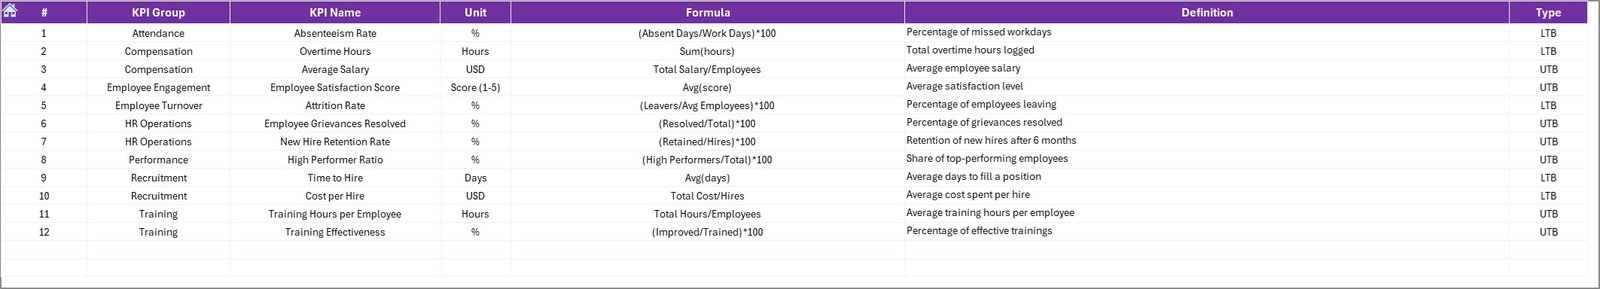
KPI Definition Sheet Tab
In the KPI Definition sheet, every performance indicator is clearly defined.
The sheet includes:
- KPI Name
- KPI Group
- Unit of Measurement
- Formula
- Definition
This ensures clarity and consistency in tracking HR performance across all departments.
Click to buy Human Resources (HR) KPI Dashboard in Excel
Key HR KPIs Tracked in the Dashboard
The HR KPI Dashboard in Excel covers a wide spectrum of metrics to support strategic decision-making. Some of the most common KPIs include:
- Employee Turnover Rate: Measures how often employees leave the organization.
- Absenteeism Rate: Tracks how frequently employees miss work.
- Time to Fill Positions: Monitors how long it takes to fill open roles.
- Employee Satisfaction Score: Evaluates staff morale and engagement.
- Training Hours per Employee: Tracks learning and development investments.
- Cost per Hire: Calculates the total cost associated with new hires.
- Goal Achievement Percentage: Shows how many HR targets are being met.
These KPIs together create a holistic view of HR performance — from hiring and retention to employee engagement and development.
Why Use Excel for HR Dashboards?
While specialized HR analytics tools exist, Excel remains a favorite for many professionals due to its flexibility, accessibility, and cost-effectiveness.
Here are key reasons why Excel is ideal for building HR dashboards:
- Easy Customization: Modify KPI names, add departments, or change visuals without coding.
- Universal Compatibility: Excel works across organizations of all sizes.
- Interactive Visuals: Use charts, slicers, and conditional formatting for dynamic views.
- No Software Cost: Save money on expensive subscriptions.
- Quick Implementation: Start tracking HR KPIs within hours, not days.
Excel’s combination of data analysis power and simplicity makes it perfect for organizations transitioning toward data-driven HR management.
How the HR KPI Dashboard Improves Decision-Making
The HR KPI Dashboard goes beyond simple reporting — it empowers strategic decisions. Here’s how:
- Faster Insights: Instantly view which areas of HR need attention.
- Better Accountability: Each KPI shows responsibility and ownership.
- Improved Planning: Use historical data and trends to forecast staffing needs.
- Informed Budgeting: Align training and hiring budgets with performance results.
- Employee Retention: Identify patterns leading to attrition and take preventive action.
By converting raw data into actionable intelligence, HR teams can make evidence-based decisions rather than assumptions.
Advantages of Human Resources KPI Dashboard in Excel
Let’s explore the key benefits of this powerful Excel-based solution.
1. Centralized Performance Monitoring
All HR metrics are consolidated in one place, eliminating scattered reports and manual tracking.
2. Time Efficiency
Automated calculations and visual updates reduce the need for manual work, saving countless hours every month.
3. Clear Visualization
Color-coded indicators and trend charts simplify complex HR data and highlight performance instantly.
4. Better Forecasting
Historical and trend data provide insights for workforce planning and recruitment forecasting.
5. Easy Sharing and Collaboration
The Excel file can be shared across teams, departments, or cloud drives, making it ideal for collaborative HR environments.
Opportunities for Improvement
Even with its many strengths, there’s always room to enhance your HR dashboard experience.
- Automate Data Imports: Link to external HR systems or Google Sheets for live data updates.
- Add Department-Level KPIs: Introduce deeper departmental segmentation (Recruitment, Payroll, L&D).
- Incorporate Employee Feedback: Use survey data for real-time satisfaction tracking.
- Use Power Query or Power BI: For organizations with larger datasets, integrate advanced visualization tools.
- Add Predictive Analysis: Incorporate formulas to predict attrition or hiring trends.
These improvements can take your HR dashboard from operational reporting to predictive analytics.
Best Practices for Using the HR KPI Dashboard
To maximize accuracy and usability, follow these best practices:
- Keep Data Consistent
- Ensure that KPI names, units, and formulas remain standardized across all sheets.
- Update Data Regularly
- Input actual numbers monthly to maintain dashboard reliability.
- Validate Data Accuracy
- Cross-check values before generating final dashboards to prevent decision errors.
- Align KPIs with Strategy
- Select KPIs that align with your HR and business objectives — not just for reporting purposes.
- Train Team Members
Provide a quick tutorial or guide to help all HR staff use and interpret the dashboard effectively.
Real-World Use Cases
The Human Resources KPI Dashboard in Excel has diverse applications across industries:
- Corporate HR: Track employee engagement, hiring cost, and retention metrics.
- Manufacturing Firms: Monitor training hours, safety compliance, and labor productivity.
- Educational Institutions: Evaluate teacher-student ratios and staff performance.
- Healthcare Organizations: Measure absenteeism, overtime, and shift management.
- Startups: Keep an eye on recruitment efficiency and cultural fit.
Each use case benefits from Excel’s versatility and the dashboard’s structured, data-driven insights.
How to Use the HR KPI Dashboard Step by Step
Here’s a simple guide to using this Excel tool effectively:
- Start with the Home Sheet: Use navigation buttons to move between sheets.
- Input Targets: Fill in MTD and YTD targets in the Target sheet.
- Add Actual Data: Enter current performance numbers in the Actual Numbers Input sheet.
- Compare Past Performance: Update the Previous Year sheet with last year’s results.
- Analyze Trends: Select KPIs in the KPI Trend sheet to review progress.
- Review Dashboard: Switch months in the Dashboard sheet (cell D3) to analyze different periods.
Within minutes, you’ll have a comprehensive HR performance summary.
Conclusion
The Human Resources KPI Dashboard in Excel is more than just a data tool — it’s a complete performance management solution.
It transforms how HR teams measure, monitor, and improve workforce efficiency. With its interactive visuals, automation, and clarity, it helps leaders make strategic decisions that drive real organizational impact.
Whether you’re an HR manager, business analyst, or organizational leader, this Excel dashboard simplifies complex HR analytics into clear, actionable insights — helping your business grow with confidence and precision.
Frequently Asked Questions (FAQs)
- What is the main purpose of an HR KPI Dashboard in Excel?
It helps HR teams track, analyze, and visualize performance metrics related to recruitment, retention, and workforce efficiency.
- Can I customize the dashboard for my organization?
Yes! You can easily modify KPI names, units, and visuals to match your company’s needs.
- Does this dashboard require advanced Excel knowledge?
Not at all. The template is user-friendly, with clear instructions and drop-downs for easy navigation.
- How often should I update the dashboard?
It’s best to update it monthly to keep data current and ensure accurate insights.
- Can I connect it with external HR software?
Yes, you can integrate it with other HR or payroll systems using Excel Power Query or APIs for automated updates.
- What are the most important HR KPIs to track?
Common KPIs include Employee Turnover, Absenteeism Rate, Time to Hire, Employee Satisfaction, and Training Hours per Employee.
- Why should I use Excel instead of online HR tools?
Excel provides flexibility, affordability, and full control over customization — without the need for expensive software licenses.
Visit our YouTube channel to learn step-by-step video tutorials
Watch the step-by-step video tutorial:
Click to buy Human Resources (HR) KPI Dashboard in Excel