In the world of marketing, data speaks louder than opinions. Businesses invest heavily in advertising across digital and traditional platforms, but without effective performance tracking, it’s impossible to know what truly works. That’s where the Advertising KPI Scorecard in Excel comes in — a ready-to-use, data-driven solution that transforms complex performance metrics into clear, actionable insights.
This blog post explores everything you need to know about this powerful Excel-based scorecard — from structure and features to advantages, best practices, and FAQs. Whether you’re an advertiser, agency, or marketing manager, this article will help you master KPI-based decision-making.
Click to buy Advertising KPI Scorecard in Excel
What Is an Advertising KPI Scorecard in Excel?
An Advertising KPI Scorecard in Excel is a structured tool designed to monitor, evaluate, and visualize the performance of advertising campaigns using measurable Key Performance Indicators (KPIs).
Instead of juggling multiple platforms or generating manual reports, this Excel-based scorecard gives you a centralized dashboard to view metrics like impressions, clicks, conversions, cost per acquisition, and return on ad spend (ROAS) — all in one place.
It helps marketers compare actual vs. target results, identify performance gaps, and make data-driven adjustments to optimize advertising outcomes.
Why Use Excel for Advertising KPI Tracking?
While many marketing tools offer analytics dashboards, Excel remains a top choice for professionals who value flexibility, customization, and control.
Here’s why Excel-based scorecards stand out:
- Easy Customization: Modify KPIs, charts, and layouts based on your unique goals.
- No Subscription Needed: Once you download it, there’s no ongoing cost.
- Real-Time Updates: Update your data anytime and instantly view results.
- Powerful Formulas: Use built-in Excel functions to calculate trends and performance ratios.
- Universal Compatibility: Share and collaborate seamlessly across teams.
With Excel, your advertising data stays organized, secure, and easy to interpret.
Key Features of the Advertising KPI Scorecard in Excel
This ready-to-use scorecard template comes with four key worksheet tabs, each designed for a specific function and insight.
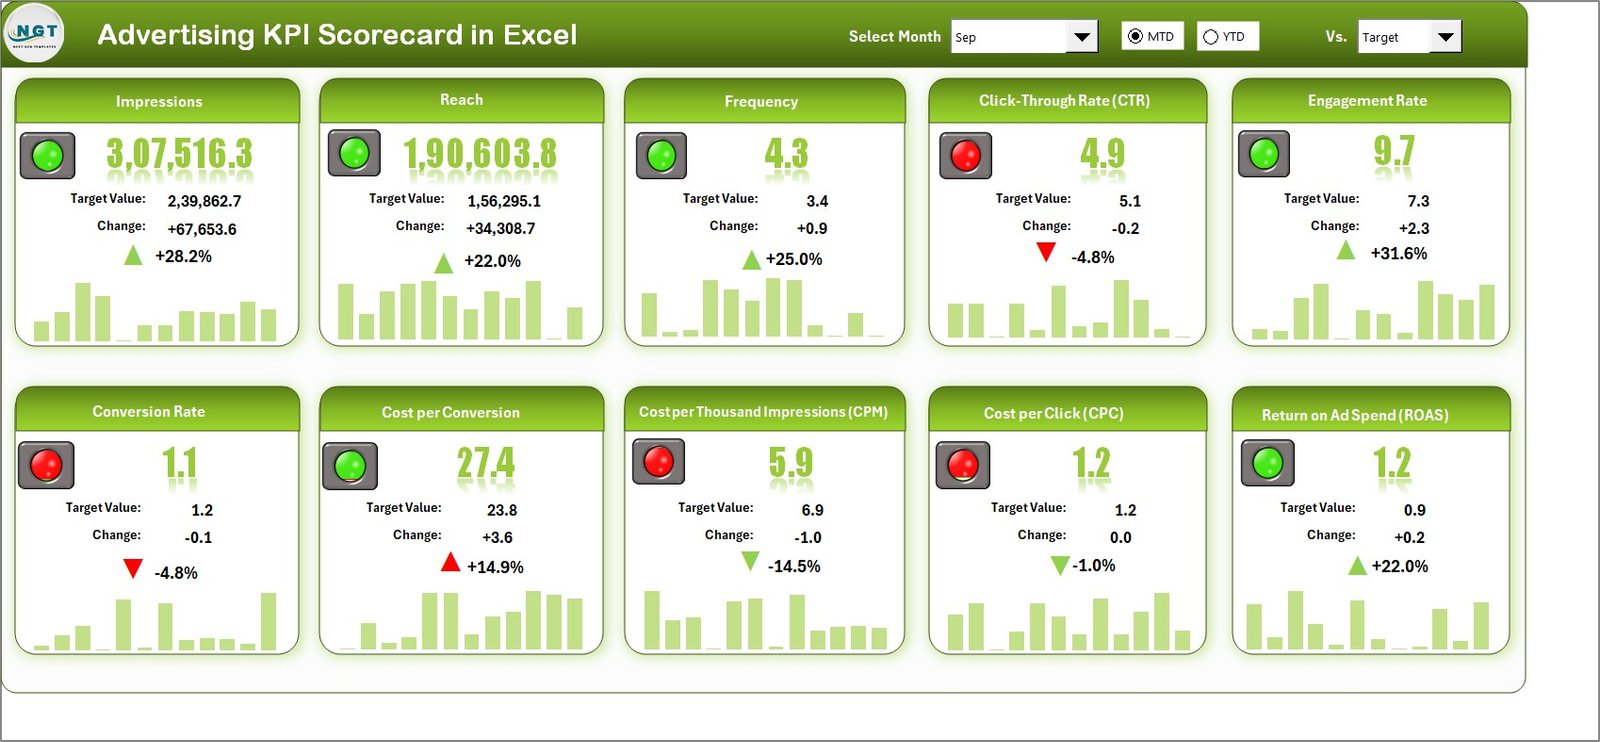
Scorecard Sheet – The Central Performance Hub
The Scorecard Sheet serves as the main dashboard, displaying all KPIs in a single, user-friendly view. It is where decision-makers analyze results and evaluate campaign performance at a glance.
Key Features:
- Dropdown Menus: Select the desired month and choose between MTD (Month-to-Date) or YTD (Year-to-Date) views.
- Actual vs. Target Values: Instantly compare performance metrics against goals.
- Color-Coded Indicators: Conditional formatting highlights good and poor performance using green, yellow, and red signals.
- Comprehensive Overview: Displays all major KPIs with clarity, allowing quick decision-making.
- Compact View: Analyze up to 10 KPIs at once for faster reporting.
This interactive sheet gives teams a single glance at what’s working — and what needs improvement.
Click to buy Advertising KPI Scorecard in Excel
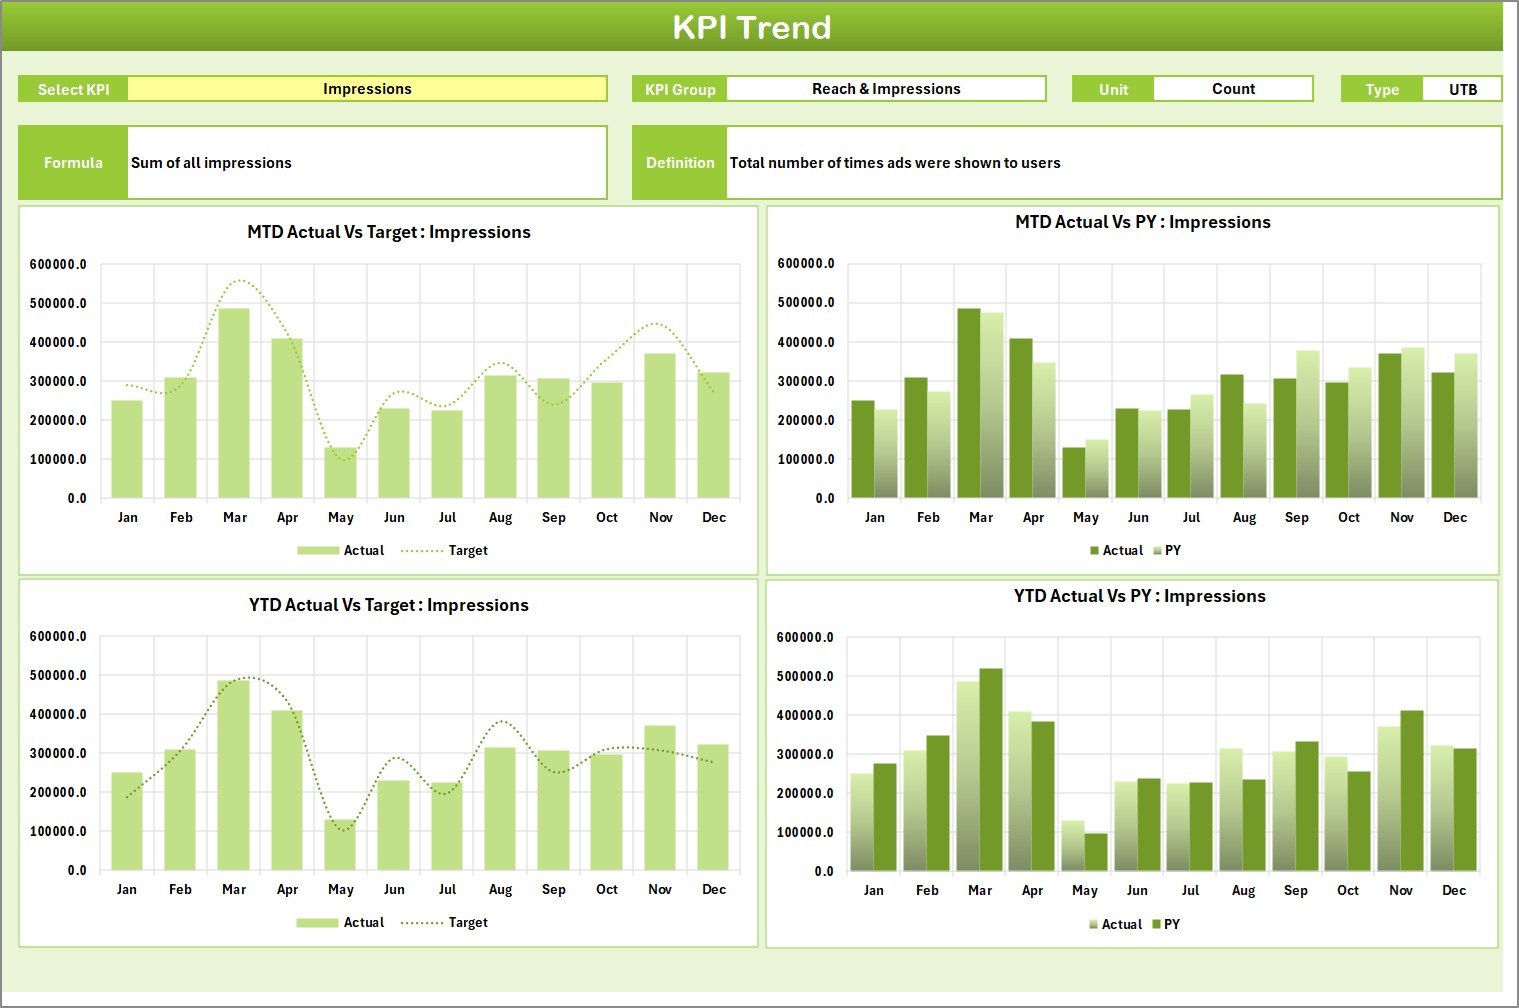
KPI Trend Sheet – Visualizing Performance Over Time
The KPI Trend Sheet helps users visualize how each KPI performs across months. Trends are crucial because they reveal patterns that static numbers can’t.
Highlights:
- KPI Selection Dropdown (Cell C3): Choose any KPI from the list to view detailed performance charts.
- Detailed KPI Metadata: Shows KPI Group, Unit, Type (Upper or Lower the Better), Formula, and Definition.
- Dynamic Trend Charts: Line or column charts display MTD and YTD trends for Actual, Target, and Previous Year (PY) values.
- Insightful Comparisons: Spot deviations from targets or identify growth trajectories easily.
This sheet turns raw data into visual stories that support smarter campaign optimization.
Click to buy Advertising KPI Scorecard in Excel
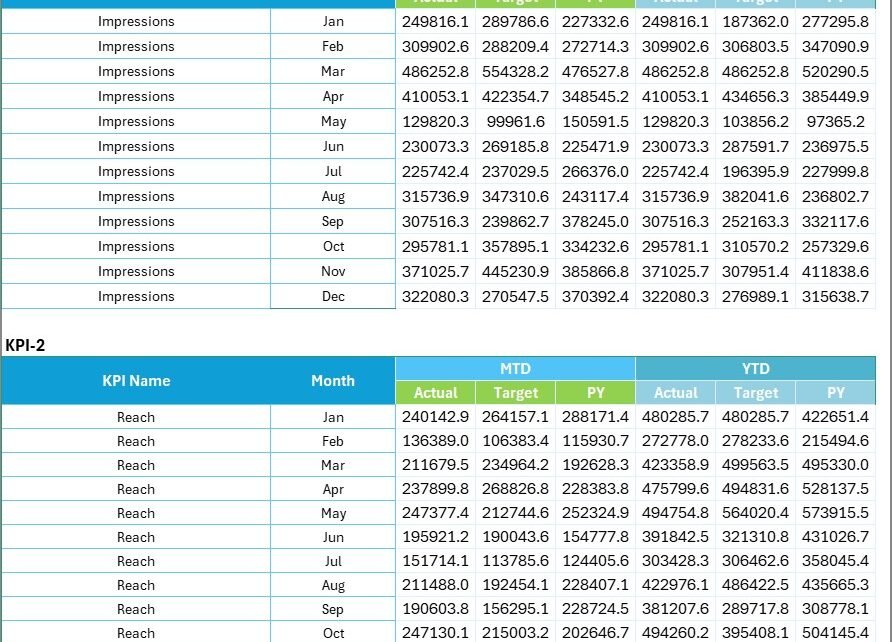
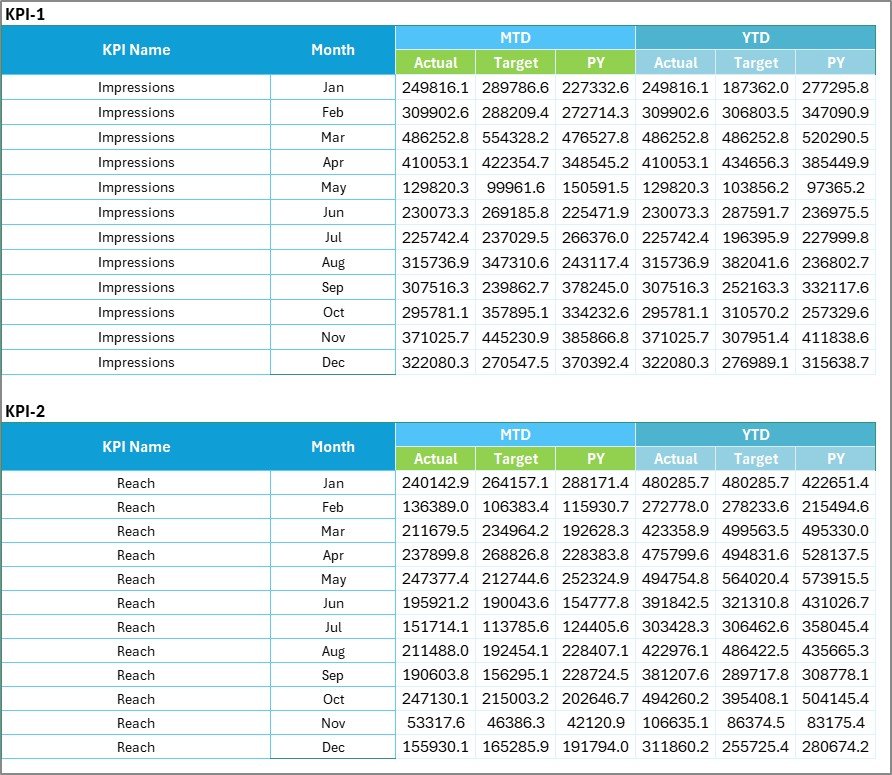
Input Data Sheet – The Foundation of Accuracy
The Input Data Sheet acts as the data backbone of the scorecard. This is where users enter or import monthly advertising data.
Functions:
- Structured Data Entry: Record all actual and target KPI values in an organized format.
- Editable and Flexible: Easily update values whenever new campaign results come in.
- Error-Free Updates: Predefined columns ensure consistent data entry.
- Seamless Integration: Data automatically flows into the Scorecard and KPI Trend sheets.
Regularly updating this sheet keeps your scorecard current and your insights reliable.
Click to buy Advertising KPI Scorecard in Excel
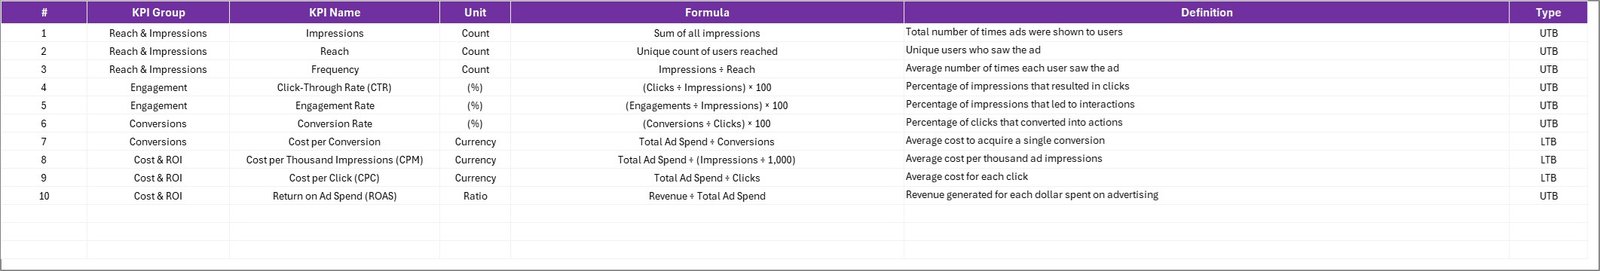
KPI Definition Sheet – Clarifying What Each Metric Means
The KPI Definition Sheet helps maintain transparency and standardization across teams. Every KPI used in the scorecard is defined clearly to avoid confusion.
Contents:
- KPI Name & Group: Identifies the KPI and its category (e.g., Traffic, Engagement, Conversion).
- Unit of Measurement: Specifies if the KPI is measured in %, count, or monetary value.
- Formula Used: Shows the exact calculation logic for consistency.
- Definition: Explains the KPI purpose and how it impacts campaign goals.
This sheet ensures all team members interpret metrics in the same way — critical for collaborative analysis.
Click to buy Advertising KPI Scorecard in Excel
How to Use the Advertising KPI Scorecard Effectively
Follow these steps to get the most out of the template:
- Set Up KPIs: Define all key metrics in the KPI Definition Sheet.
- Enter Data: Input monthly actual and target values into the Input Data Sheet.
- Review the Scorecard: Use the Scorecard Sheet to compare Actual vs. Target vs. PY values.
- Analyze Trends: Use the KPI Trend Sheet to visualize performance over time.
- Make Decisions: Identify improvement areas and adjust campaign strategies accordingly.
By following this structured workflow, your team can manage advertising efficiency with clarity and confidence.
Advantages of Advertising KPI Scorecard in Excel
Implementing an Advertising KPI Scorecard offers numerous benefits that go beyond simple reporting.
- Centralized Performance Tracking
It brings together all campaign metrics — from impressions to ROAS — in one place, reducing the need to switch between multiple tools.
- Real-Time Insights
Automatic updates allow instant visibility into whether campaigns are on track or underperforming.
- Data-Driven Decision-Making
By visualizing trends, marketers can identify successful strategies and replicate them across other campaigns.
- Cost Efficiency
Unlike expensive marketing platforms, Excel offers a low-cost yet powerful analytics solution.
- Enhanced Collaboration
Since Excel files can be shared easily, teams across departments or regions can analyze data simultaneously.
- Clear Visualization
Conditional formatting and charts make complex information easy to interpret — even for non-technical users.
- Continuous Improvement
Regularly updating KPIs encourages constant optimization of ad strategies, improving ROI over time.
Opportunities for Improvement
Although Excel scorecards are robust, there are always areas where users can improve their analysis process:
- Automate Data Entry: Use Power Query or VBA scripts to pull data directly from ad platforms like Google Ads or Facebook.
- Add Benchmark Comparisons: Include industry averages to assess competitive performance.
- Enhance Visualization: Use slicers, timelines, or interactive charts to improve user experience.
- Integrate Forecasting Models: Predict future campaign outcomes using regression or trend lines.
- Build Departmental Views: Separate dashboards for marketing, sales, and finance can improve focus.
These refinements can transform a standard scorecard into a full-fledged analytics system.
Best Practices for the Advertising KPI Scorecard in Excel
To ensure consistent and meaningful results, follow these best practices:
- Keep KPIs SMART
Each KPI should be Specific, Measurable, Achievable, Relevant, and Time-bound. Avoid vanity metrics that don’t impact business goals.
- Use Consistent Data Sources
Always pull data from verified and consistent systems (e.g., Google Analytics, Facebook Ads Manager, CRM).
- Review KPIs Monthly
Regular review ensures timely action before small issues become big problems.
- Balance Short-Term and Long-Term Metrics
Combine immediate metrics (CTR, CPC) with strategic ones (ROAS, CLV) for a holistic view.
- Ensure Visualization Clarity
Avoid clutter. Keep charts simple, labeled, and focused on actionable insights.
- Protect Data Integrity
Lock formula cells, restrict editing access, and use Excel’s data validation tools to prevent errors.
- Track Trends, Not Just Totals
Month-over-month or year-over-year comparisons reveal growth patterns that static data hides.
Following these guidelines ensures your scorecard remains reliable and decision-ready.
How This Scorecard Supports Decision-Makers
Executives and marketers rely on actionable intelligence to allocate budgets effectively. The Advertising KPI Scorecard acts as their performance compass:
- For CMOs: It provides a quick snapshot of overall advertising ROI.
- For Marketing Managers: It identifies which campaigns need optimization.
- For Analysts: It delivers clean, structured data for deeper insights.
- For Agencies: It simplifies client reporting with visual summaries.
This tool bridges the gap between raw data and strategic actions.
Conclusion
The Advertising KPI Scorecard in Excel is more than just a spreadsheet — it’s a strategic ally for advertisers and marketers. It helps you monitor, compare, and improve advertising performance with clarity and precision.
From monthly trend tracking to goal alignment, this tool streamlines your workflow, saving hours of manual reporting while ensuring every dollar spent is backed by data.
When used consistently, this scorecard becomes a foundation for smarter campaigns, higher ROI, and sustainable growth.
Frequently Asked Questions (FAQs)
- What are Advertising KPIs?
Advertising KPIs (Key Performance Indicators) are measurable values that show how effectively your campaigns achieve business objectives. Examples include CTR, CPA, ROAS, and Conversion Rate.
- How often should I update my KPI Scorecard?
You should update your scorecard monthly or weekly, depending on campaign volume. Regular updates ensure timely decisions and accurate insights.
- Can I customize the KPIs in this template?
Yes, absolutely! The scorecard allows you to add, remove, or rename KPIs based on your organization’s unique advertising goals.
- Is Excel powerful enough for KPI analysis?
Yes. With its advanced formulas, charts, and conditional formatting, Excel offers everything needed for KPI analysis without complex software.
- How can I automate data updates in Excel?
You can use Power Query, VBA scripts, or connect Excel to online platforms like Google Ads or Facebook via API or CSV export.
- What’s the difference between MTD and YTD in this scorecard?
- MTD (Month-to-Date) shows performance for the current month.
- YTD (Year-to-Date) shows cumulative performance from the start of the year.
- Who should use this scorecard?
This template is ideal for marketing agencies, advertisers, media planners, analysts, and business owners who want structured performance tracking.
- How does this scorecard improve ROI?
By continuously comparing actual vs. target results, it helps identify underperforming areas, enabling faster corrective actions and improved ROI.
- Can I use this scorecard for multiple campaigns?
Yes. You can easily filter data by campaign, channel, or month to track multiple initiatives simultaneously.
- Where can I download the Advertising KPI Scorecard in Excel?
You can download the ready-to-use template from NextGenTemplates.com, your one-stop solution for data-driven business templates.
Visit our YouTube channel to learn step-by-step video tutorials
Watch the step-by-step video tutorial:
Click to buy Advertising KPI Scorecard in Excel