Ensuring public safety is one of the most critical responsibilities of any government, municipality, or community organization. Whether managing emergency services, monitoring crime rates, or ensuring disaster readiness, public safety leaders need data-driven insights to make informed decisions. However, raw data from different departments and systems often remains scattered, making it difficult to analyze and act quickly.
That’s where the Public Safety KPI Dashboard in Excel comes in.
This powerful, ready-to-use Excel-based solution provides a centralized view of key performance indicators (KPIs) related to public safety operations. It enables decision-makers to track monthly and yearly performance, compare results with targets, identify trends, and take corrective actions — all within a familiar, user-friendly Excel interface.
In this article, we’ll explore everything you need to know about this dashboard: its structure, features, benefits, advantages, and best practices — along with a detailed FAQ section at the end.
Click to buy Public Safety KPI Dashboard in Excel
What Is a Public Safety KPI Dashboard in Excel?
A Public Safety KPI Dashboard in Excel is an analytical tool that consolidates key metrics from police, fire, emergency, and public service departments into a single, interactive Excel workbook. It tracks both Month-to-Date (MTD) and Year-to-Date (YTD) performance for critical indicators such as response time, incident resolution rate, public satisfaction, and operational costs.
This dashboard not only provides a high-level overview but also allows you to drill down into specific KPIs, departments, and regions. With its pre-built formulas, charts, and conditional formatting, it helps public safety teams visualize trends, identify performance gaps, and make faster, data-backed decisions.
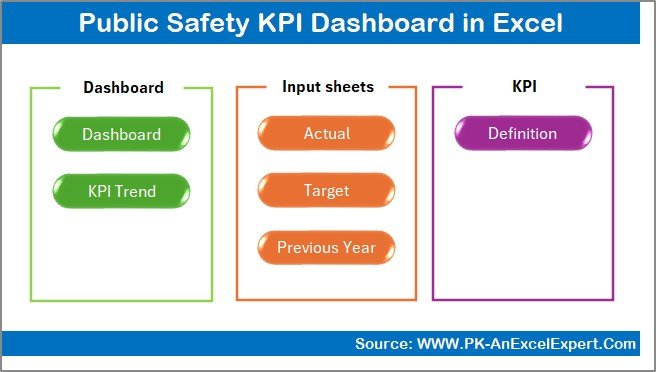
Dashboard Structure Overview
The Public Safety KPI Dashboard in Excel includes seven structured worksheets, each serving a specific purpose to streamline data entry, analysis, and reporting.
Home Sheet
The Home sheet serves as the central hub of the workbook.
- It contains navigation buttons that link directly to all key sheets — making the dashboard easy to navigate, even for non-technical users.
- Users can jump to any worksheet (Dashboard, KPI Trend, Input Sheets, etc.) with a single click.
- This sheet gives a professional, organized entry point to the entire system.
Click to buy Public Safety KPI Dashboard in Excel
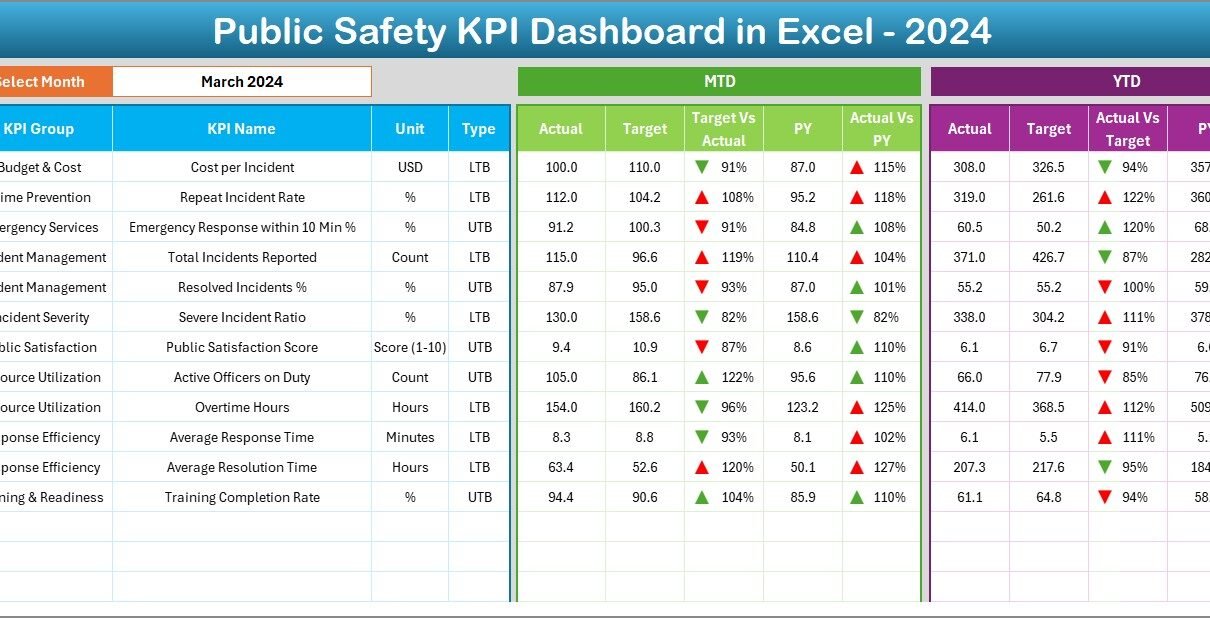
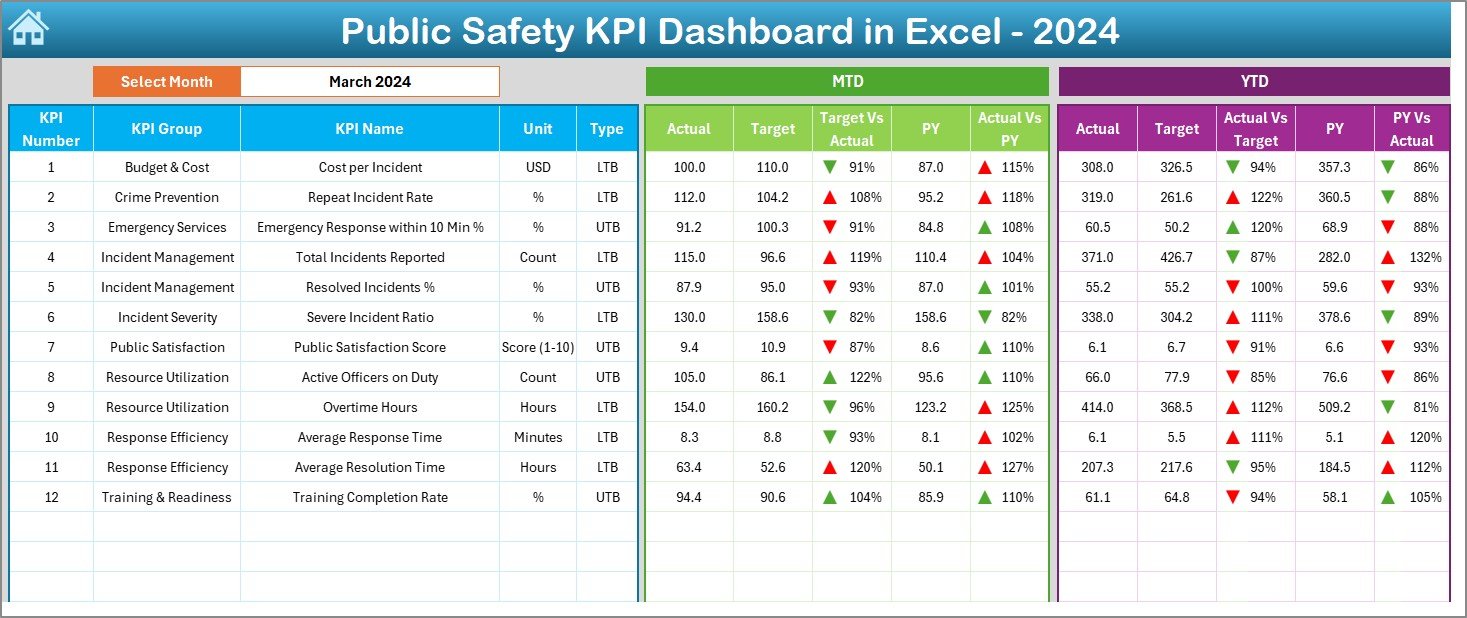
Dashboard Sheet
The Dashboard Sheet is the visual heart of the workbook.
- Users can select the reporting month from a drop-down list (cell D3).
- The dashboard automatically updates all KPI values based on the selected month.
- It displays MTD and YTD Actuals, Targets, and Previous Year (PY) data.
- Conditional formatting arrows (green for improvement, red for decline) make performance interpretation quick and intuitive.
- Comparison sections like Target vs Actual and PY vs Actual help users assess progress against benchmarks.
This page provides an instant snapshot of operational performance across multiple dimensions — ideal for leadership reviews and department briefings.
Click to buy Public Safety KPI Dashboard in Excel
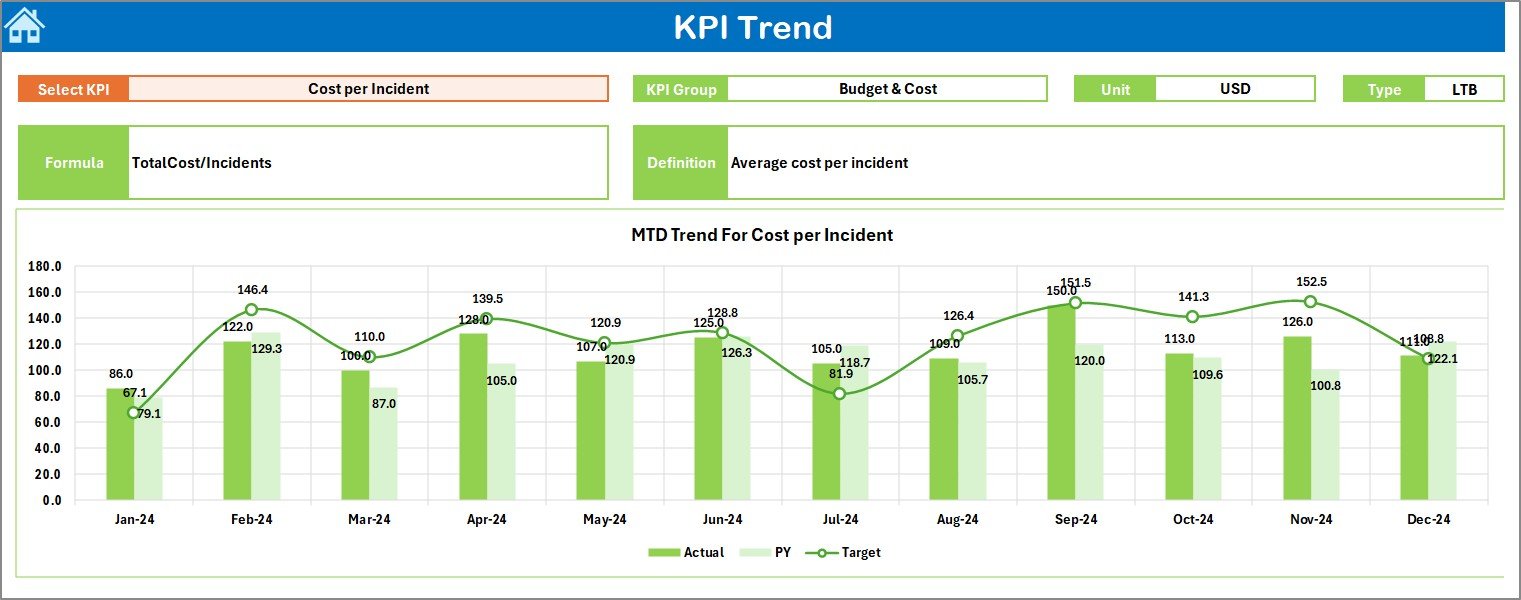
KPI Trend Sheet
The KPI Trend Sheet helps analyze performance over time.
- A drop-down list (cell C3) allows the user to select a specific KPI.
- The sheet automatically displays detailed information about the KPI:
- KPI Group
- Unit of Measurement
- KPI Type (LTB – Lower the Better, UTB – Upper the Better)
- Formula and Definition
- The page features dynamic trend charts showing MTD and YTD performance for Actual, Target, and Previous Year values.
This sheet is essential for spotting upward or downward trends and ensuring long-term strategic alignment.
Click to buy Public Safety KPI Dashboard in Excel
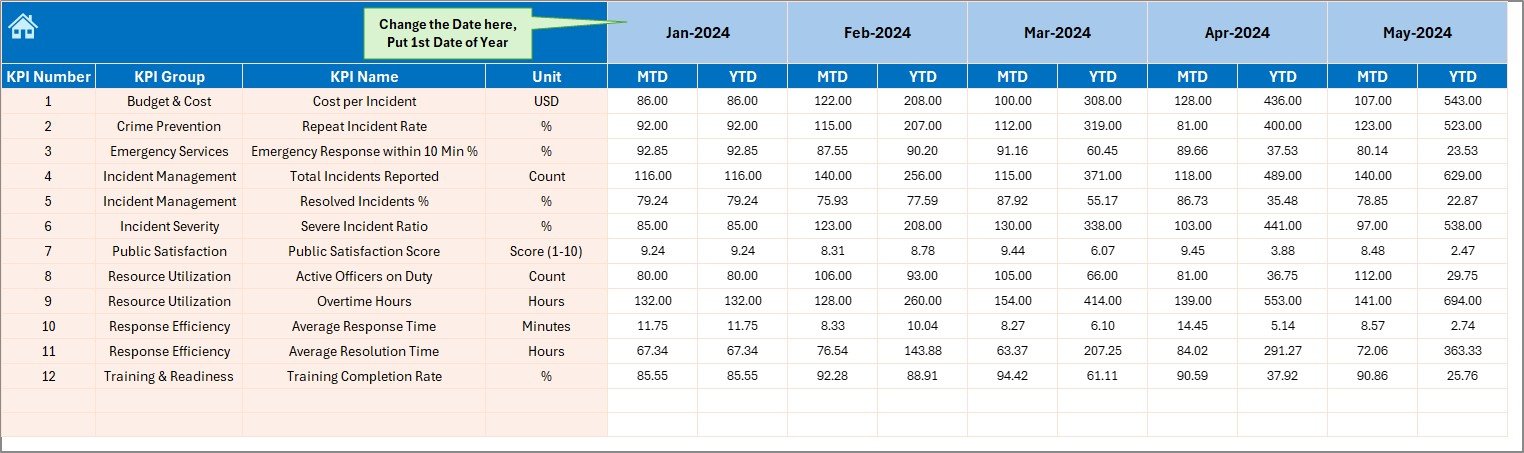
Actual Numbers Input Sheet
This sheet is where operational data entry happens.
- Users can input actual monthly and cumulative values for each KPI.
- The month selector (cell E1) allows users to define the starting month of the year.
- Once actual data is entered, it automatically feeds into dashboard calculations and charts.
This design ensures transparency and accuracy without complex data management systems.
Click to buy Public Safety KPI Dashboard in Excel
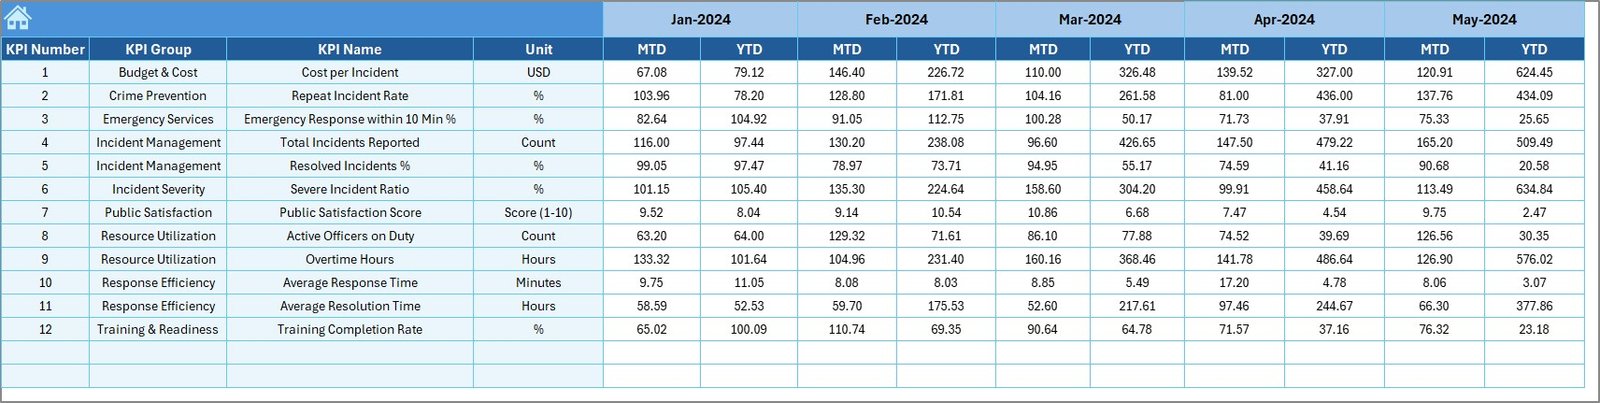
Target Sheet
Targets provide the baseline for evaluating performance.
- Users can enter monthly and yearly targets for each KPI.
- MTD and YTD target values can be maintained side by side.
- The dashboard automatically compares these targets with actual results to highlight achievements or areas needing improvement.
Click to buy Public Safety KPI Dashboard in Excel
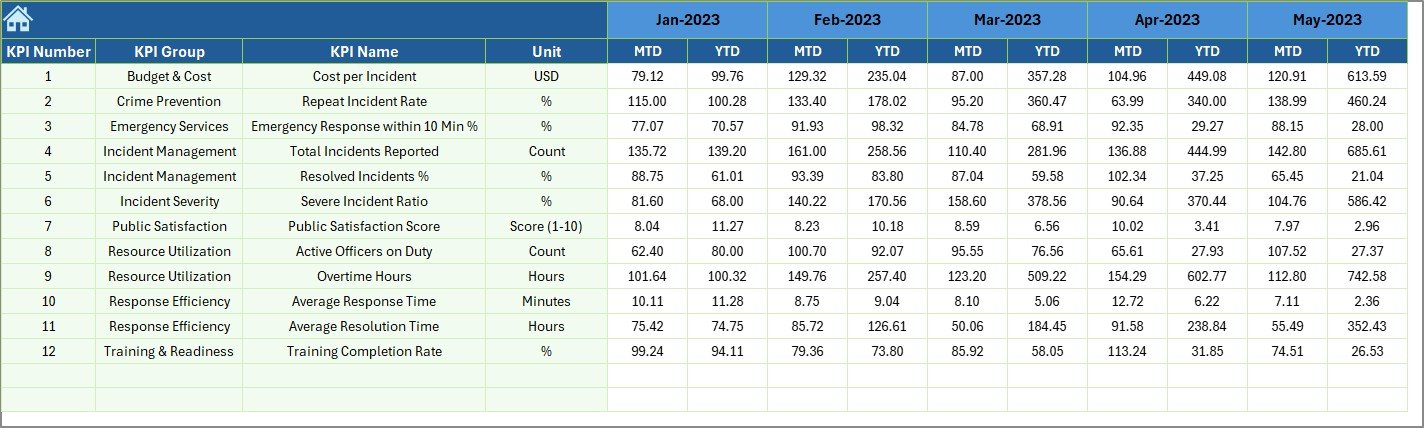
Previous Year Data Sheet
Historical context is vital for trend analysis.
- This sheet allows users to record previous year’s data for every KPI.
- The dashboard uses these values for year-over-year comparisons to measure progress and consistency.
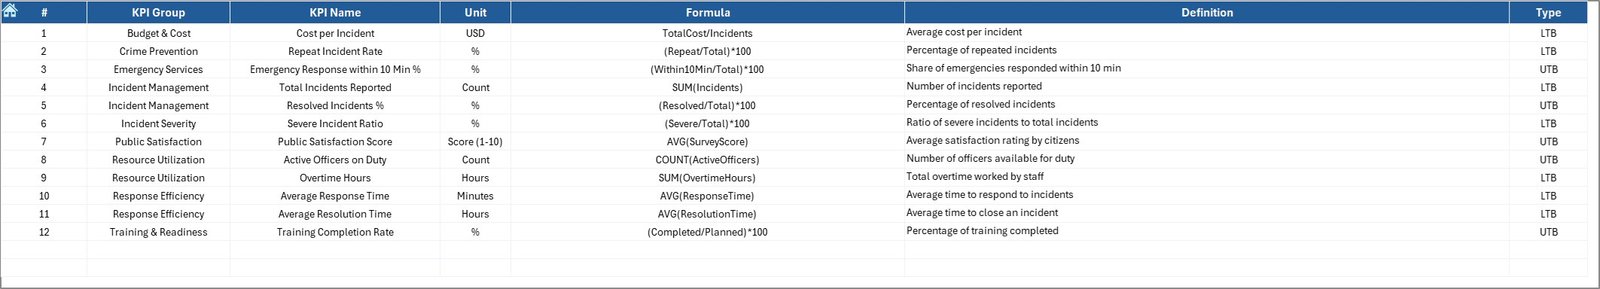
KPI Definition Sheet
Clarity begins with well-defined metrics.
- This sheet lists every KPI along with its Group, Unit, Formula, and Definition.
- It serves as a reference guide to ensure all stakeholders interpret each KPI consistently.
Click to buy Public Safety KPI Dashboard in Excel
Key Features of the Public Safety KPI Dashboard in Excel
Interactive and Automated: Change the month or KPI, and all visuals update instantly.
Comprehensive Coverage: Includes KPIs for emergency response, crime management, satisfaction, costs, and efficiency.
MTD & YTD Tracking: View monthly and annual trends simultaneously.
Target vs Actual vs Previous Year: Multi-layer comparison for deeper insight.
Conditional Formatting: Red and green arrows instantly show progress.
Drill-down Analysis: Analyze each KPI’s performance trend in detail.
No Coding Required: 100% Excel-based with built-in formulas and dynamic charts.
User-friendly Navigation: Quick access buttons simplify dashboard movement.
Why Is a Public Safety KPI Dashboard Important?
Public safety agencies deal with vast amounts of data — from emergency calls to incident resolution times. Without proper analysis tools, it’s challenging to turn this data into actionable intelligence. The Public Safety KPI Dashboard bridges that gap.
Key Benefits:
- Improved Decision-Making: Data-driven insights allow leaders to prioritize resources where they’re needed most.
- Transparency and Accountability: Clear visualization of KPIs promotes responsibility across departments.
- Operational Efficiency: Identifies bottlenecks, reduces response time, and optimizes workforce allocation.
- Community Trust: Tracking and sharing results with the public builds transparency and confidence.
- Strategic Planning: Enables proactive rather than reactive management.
Advantages of Using the Public Safety KPI Dashboard in Excel
- Cost-Effective Solution
Unlike expensive BI tools, Excel is affordable and easily accessible. This dashboard provides advanced analytical capabilities without additional software costs.
- Easy Implementation
You can deploy this dashboard within minutes. Since it’s Excel-based, it doesn’t require special installation or training.
- Real-Time Performance Tracking
Instant updates ensure you always see the latest results. With conditional formatting and dynamic charts, performance evaluation becomes visual and immediate.
- Centralized Information
All data — from actuals to targets to definitions — resides in one file. This reduces confusion, redundancy, and reporting errors.
- Scalable Design
Whether managing a single district or multiple regions, this dashboard can be expanded with more KPIs, departments, or locations.
Top KPIs You Can Track in the Dashboard
The following KPIs are commonly used in public safety performance tracking and can be customized based on organizational needs:
- Crime Clearance Rate
- Emergency Response Time (minutes)
- Medical Assistance Response Time
- Fire Incident Resolution %
- Calls Responded Within Target Time
- Public Satisfaction Index (%)
- Cost per Incident (USD)
- Training Hours per Officer
- Equipment Readiness Rate
- Community Outreach Events Conducted
Each of these KPIs helps monitor different dimensions of public safety — from operational efficiency to public engagement.
How to Use the Public Safety KPI Dashboard
Start with KPI Setup:
Define your organization’s KPIs in the KPI Definition Sheet. Include the unit, formula, and type.
Input Target Data:
Use the Target Sheet to define monthly and annual performance goals.
Add Historical Data:
Enter previous year’s figures to enable comparison in the Previous Year Sheet.
Feed Current Data:
Input actual performance numbers for each KPI in the Actual Numbers Sheet.
View the Dashboard:
Navigate to the Dashboard Sheet and select a month. Instantly visualize your progress with automated charts and arrows.
Analyze Trends:
Open the KPI Trend Sheet to examine monthly and yearly patterns.
This process ensures you always have up-to-date insights at your fingertips.
Best Practices for Using the Public Safety KPI Dashboard
Define Clear KPIs:
Ensure every KPI is measurable, specific, and aligned with your safety goals.
Update Data Regularly:
Keep your Actual, Target, and Previous Year sheets updated monthly for accurate analysis.
Set Realistic Targets:
Base your targets on historical data and resource availability. Unrealistic goals can distort performance perception.
Use Conditional Formatting Wisely:
Highlight key metrics with color indicators for instant visual cues.
Validate Data Accuracy:
Cross-check data entries to maintain credibility in reports.
Review KPI Definitions Periodically:
As operations evolve, update KPI definitions to reflect new realities.
Encourage Data-Driven Discussions:
Use dashboard insights in regular meetings to foster transparency and improvement.
Conclusion
Public safety management thrives on accurate, timely data. The Public Safety KPI Dashboard in Excel is not just a spreadsheet — it’s a decision-support system. By consolidating critical metrics, automating updates, and offering instant visual analysis, it empowers leaders to improve service delivery, reduce incidents, and strengthen community trust.
Whether you’re overseeing a police department, fire service, or municipal authority, this Excel-based tool can revolutionize how you measure and manage performance.
Frequently Asked Questions (FAQs)
- What is the purpose of a Public Safety KPI Dashboard in Excel?
It helps public safety organizations monitor operational and service performance metrics, enabling quick decision-making through visual analysis.
- Do I need technical expertise to use this dashboard?
No. The dashboard is entirely Excel-based and designed for non-technical users. Simple drop-downs and buttons make it easy to use.
- Can I customize the KPIs?
Yes. You can easily edit or add new KPIs in the KPI Definition Sheet and update corresponding data across other sheets.
- How often should I update the data?
It’s best to update monthly to ensure MTD and YTD comparisons remain accurate and relevant.
- Does the dashboard support multiple departments or regions?
Yes. You can expand the dataset to include additional regions, teams, or divisions without changing the overall structure.
- Can it be used by small municipalities?
Absolutely. The dashboard’s flexibility makes it ideal for small towns, large cities, or even national agencies.
- How does this dashboard help improve public safety?
By providing real-time visibility into performance metrics, it helps agencies identify issues early, allocate resources efficiently, and boost accountability.
Visit our YouTube channel to learn step-by-step video tutorials
Watch the step-by-step video tutorial:
Click to buy Public Safety KPI Dashboard in Excel