In today’s digital-first world, a company’s online reputation can determine its success or failure. Every review, comment, and social media mention shapes how customers see your brand. That’s why monitoring and managing your reputation with real-time insights is vital.
To achieve this, organizations rely on the Online Reputation KPI Dashboard in Power BI — a powerful, data-driven tool that turns scattered online data into meaningful visuals. It helps you measure, analyze, and improve how your brand performs across digital channels.
This article will explore the structure, features, advantages, best practices, and frequently asked questions about the Online Reputation KPI Dashboard in Power BI. Let’s begin.
Click to buy Online Reputation KPI Dashboard in Power BI
What Is an Online Reputation KPI Dashboard in Power BI?
An Online Reputation KPI Dashboard in Power BI is a visual analytics solution designed to monitor how your brand is perceived across digital platforms — including review websites, social media, and search engines.
Using Power BI, this dashboard consolidates various Key Performance Indicators (KPIs) such as:
- Customer sentiment scores,
- Star ratings,
- Review counts,
- Response times,
- Social engagement levels,
- Positive vs. negative mentions.
It transforms complex data into dynamic visual reports, enabling marketing and reputation teams to track trends, benchmark performance, and make proactive decisions.
Why Online Reputation Management Matters
Your reputation online is your digital identity. Even one negative review can discourage potential buyers. According to recent studies, over 90% of consumers read online reviews before making a purchase.
An effective KPI dashboard helps you:
- Identify issues before they escalate.
- Monitor feedback patterns.
- Improve customer satisfaction.
- Strengthen brand trust and visibility.
In short, it’s your brand’s real-time pulse, showing what customers truly think about your products, services, or company.
Key Features of the Online Reputation KPI Dashboard in Power BI
This dashboard is structured across multiple interactive pages, each focusing on a specific aspect of online reputation performance.
Summary Page
The Summary Page serves as the entry point and index of your dashboard.
- It includes six navigation buttons for quick access to all other pages.
- Users can instantly jump to KPI trends, definitions, or data inputs.
- It provides a clean overview of current reputation metrics, such as overall sentiment score, total reviews, and average rating.
This page acts like a command center where users can quickly understand performance at a glance.
Click to buy Online Reputation KPI Dashboard in Power BI
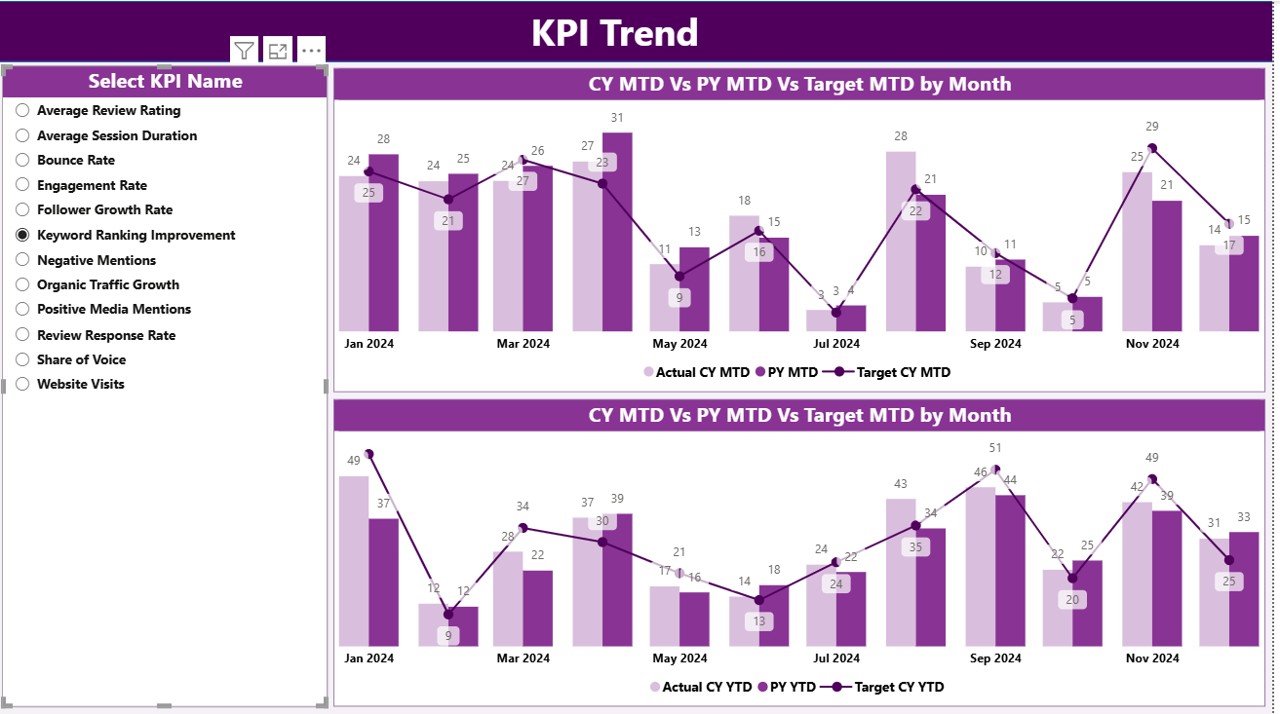
KPI Trend Page
The KPI Trend Page is the analytical heart of the dashboard.
Here, you can explore how your KPIs evolve over time and identify fluctuations or patterns.
Key highlights include:
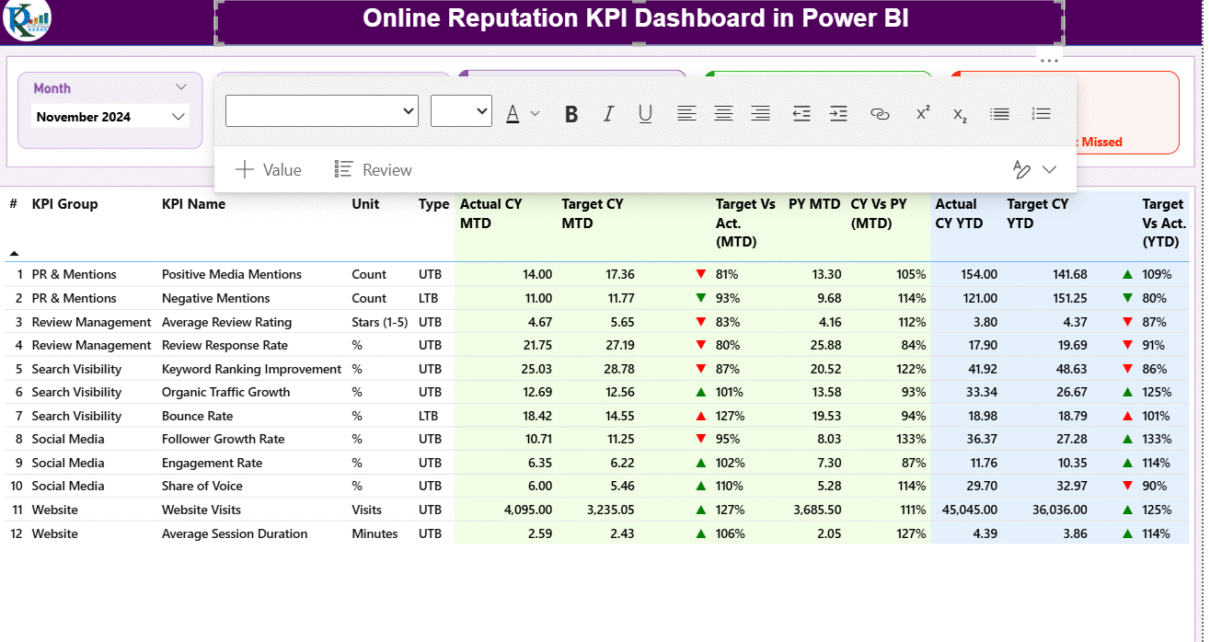
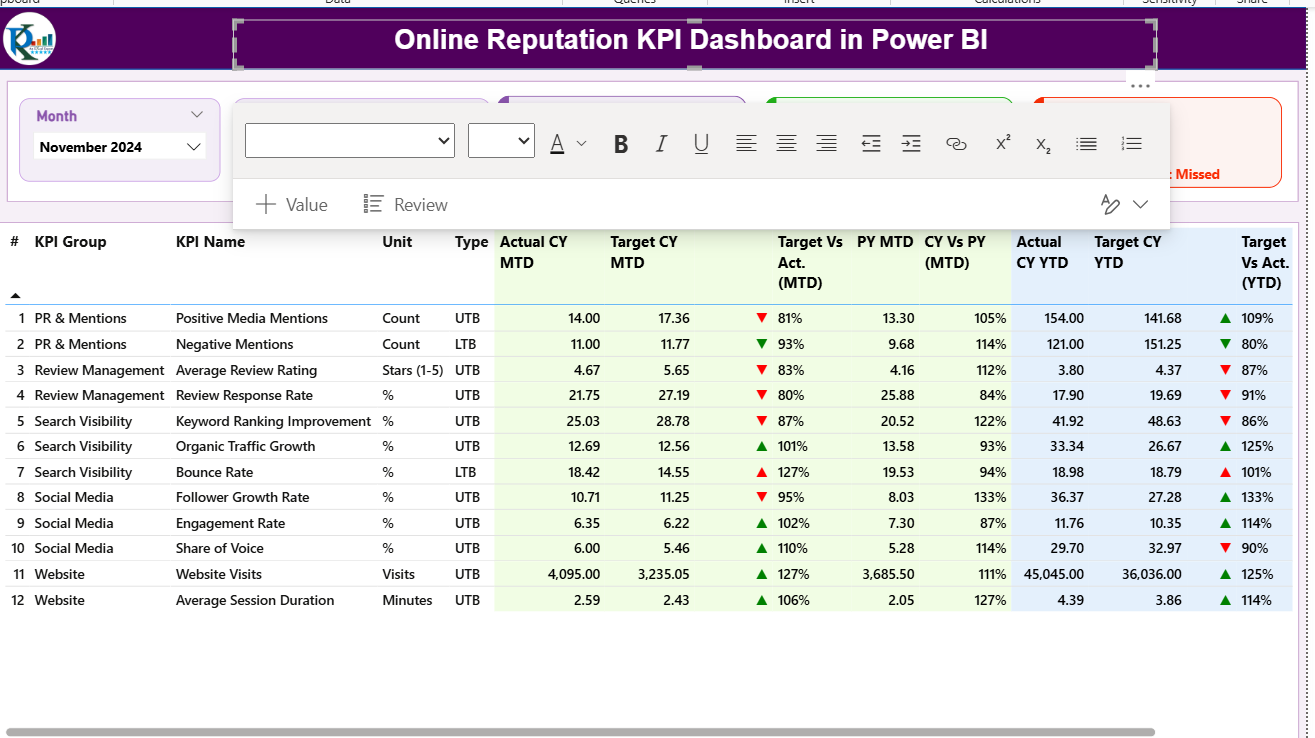
- A month selector (cell D3) that filters the entire dashboard dynamically.
- MTD (Month-to-Date) and YTD (Year-to-Date) comparisons for Actual, Target, and Previous Year (PY).
- Conditional formatting with up and down arrows to visualize growth or decline.
- Instant understanding of whether KPIs are meeting expectations.
For example, if your brand’s average rating drops this month compared to last year, the dashboard instantly highlights the issue in red — prompting immediate action.
Click to buy Online Reputation KPI Dashboard in Power BI
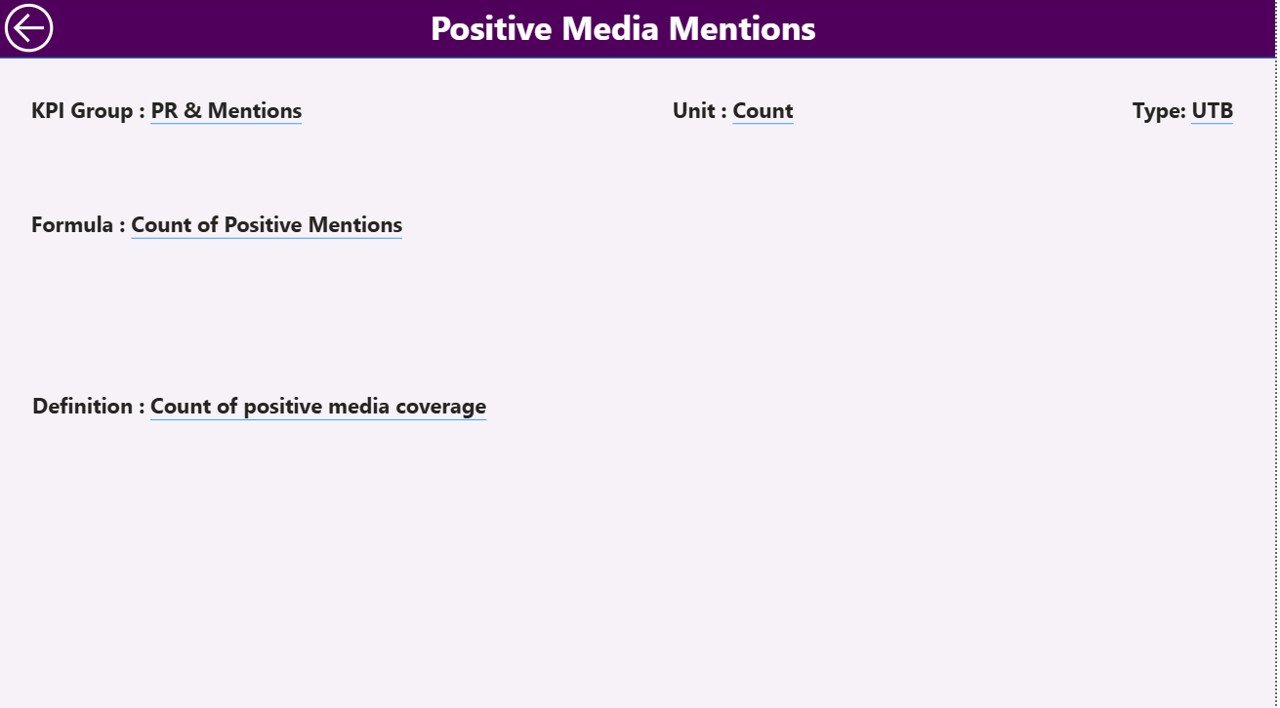
KPI Definition Page
Transparency and clarity are critical in performance measurement. The KPI Definition Page explains each metric in simple terms.
It includes:
- KPI Group (e.g., Customer Feedback, Social Media, Brand Mentions)
- Unit of Measurement (%, Count, Score, etc.)
- Formula used for calculation
- KPI Type (UTB: Upper The Better, or LTB: Lower The Better)
- Short Definition of each KPI
Additionally, this page visualizes MTD and YTD trend charts for every KPI, allowing users to see performance trajectories.
Data Foundation of the Dashboard
Behind the scenes, three structured Excel sheets feed the Power BI model. These sheets ensure consistent and automated data refreshes.
Click to buy Online Reputation KPI Dashboard in Power BI
Input_Actual Sheet
This sheet captures the actual performance values for each KPI.
Columns include:
- KPI Name
- Month (using the first day for consistency)
- MTD Value
- YTD Value
For instance, if the “Average Response Time” for September is 3 hours, this sheet records it for Power BI to visualize.
Input_Target Sheet
Targets define success benchmarks. This sheet stores target values for each KPI.
Columns include:
- KPI Name
- Month
- MTD Target
- YTD Target
By comparing these values with actuals, Power BI highlights performance gaps — helping teams set realistic and measurable goals.
KPI Definition Sheet
This is the metadata backbone of the dashboard. It outlines every KPI’s logic and relevance.
Columns include:
- KPI Number
- KPI Group
- KPI Name
- Unit of Measurement
- Formula
- Short Definition
- Type (UTB or LTB)
This structure ensures every metric is well-defined, standardized, and consistent across reports.
Click to buy Online Reputation KPI Dashboard in Power BI
Advantages of Using an Online Reputation KPI Dashboard
A well-designed Power BI dashboard offers countless benefits. Let’s explore the most impactful ones.
Real-Time Reputation Tracking
You can monitor performance live — whether your star ratings improve or negative mentions increase. This immediacy helps you take quick corrective actions.
Centralized Data View
The dashboard consolidates data from multiple sources like Google Reviews, Trustpilot, Twitter, and Facebook into one platform.
Data-Driven Decision Making
Managers don’t need to rely on assumptions. Power BI visuals show facts through charts, KPIs, and trends.
Easy Customization
You can modify KPIs, filters, or visualization themes as your reputation strategy evolves.
Improved Team Accountability
Each department — customer service, marketing, or PR — can see their impact clearly. This transparency encourages ownership and consistent improvement.
Better Strategic Planning
With historical data and visual insights, companies can identify what’s working and what’s not — helping refine long-term strategies.
How Power BI Enhances Online Reputation Analysis
Power BI turns complex data models into interactive and easy-to-understand visuals.
Dynamic Filters
Users can filter data by month, platform, or KPI — instantly updating charts and cards.
Interactive Visuals
The dashboard uses bar charts, trend lines, and KPI cards with icons and colors for intuitive storytelling.
Automated Data Refresh
When you update Excel sheets or connect APIs from social platforms, Power BI automatically updates the dashboard visuals.
Drill-Through Functionality
Clicking on a specific KPI (like “Negative Mentions”) opens deeper insights — for example, which channels contributed most to that metric.
These features make it simple to monitor performance without technical skills.
Opportunities for Improvement
Even the best dashboards can evolve. Here are some ideas to enhance your Online Reputation KPI Dashboard:
- Integrate real-time social media APIs for instant updates.
- Include geographical analysis (heat maps showing review origin).
- Add AI-powered sentiment classification to understand tone and context.
- Enable automated alerts when KPIs fall below thresholds.
- Develop a mobile-friendly version for managers on the go.
These upgrades can make the tool even more powerful for proactive reputation management.
Best Practices for Using the Online Reputation KPI Dashboard in Power BI?
Follow these best practices to maximize accuracy and value:
- Keep Data Updated Regularly – Schedule weekly or monthly refreshes.
- Define Clear KPI Ownership – Assign responsible departments for each metric.
- Standardize Data Entry Formats – Use consistent date and value formats in Excel or data sources.
- Use Conditional Formatting Wisely – Highlight critical insights using intuitive visuals.
- Focus on Actionable Metrics – Avoid cluttering the dashboard with too many KPIs.
- Encourage Cross-Department Collaboration – Share reputation insights with customer support, marketing, and operations teams.
- Review and Improve Periodically – Conduct quarterly reviews to refine KPIs and data models.
Conclusion
In today’s transparent digital era, a company’s online reputation can change overnight. The Online Reputation KPI Dashboard in Power BI empowers organizations to stay ahead by continuously tracking, analyzing, and improving their brand perception.
With structured data inputs, dynamic visuals, and automated updates, this dashboard transforms raw reputation data into strategic insights. It helps you not only measure success but also shape how the world sees your brand.
Investing in this dashboard means investing in your brand’s credibility, customer trust, and long-term growth.
Frequently Asked Questions (FAQs)
- What is the main purpose of the Online Reputation KPI Dashboard?
It helps organizations monitor and analyze online reviews, ratings, and mentions in one place. This allows them to take data-driven actions to improve their reputation.
- Can small businesses use this dashboard?
Yes, small and medium-sized businesses can use it easily. Power BI’s flexibility and low cost make it accessible for all company sizes.
- How often should I update the data?
Ideally, refresh the data weekly or monthly, depending on review frequency and data volume.
- What are the key KPIs in reputation management?
Key metrics include average rating, review count, response time, sentiment score, and social engagement rate.
- Can the dashboard connect to live social media data?
Yes. With APIs, Power BI can pull real-time data from platforms like Twitter, Google Reviews, and Facebook.
- Is Power BI suitable for non-technical users?
Absolutely. Power BI’s interface is intuitive and visual, making it easy for anyone to navigate without coding knowledge.
- How can this dashboard improve customer satisfaction?
By monitoring feedback trends, companies can address concerns quickly, improve service quality, and enhance customer experience.
Visit our YouTube channel to learn step-by-step video tutorials
Watch the step-by-step video tutorial:
Click to buy Online Reputation KPI Dashboard in Power BI