In the fast-paced world of online retail, data is the driving force behind every successful e-commerce business. Whether you run a small Shopify store or a large online marketplace, tracking the right Key Performance Indicators (KPIs) can make or break your growth strategy.
To help e-commerce professionals make informed, data-driven decisions, the E-commerce KPI Scorecard in Excel offers a powerful and ready-to-use solution. This scorecard turns raw performance data into meaningful insights, allowing you to monitor every critical aspect of your business — from website traffic to order fulfillment and customer retention.
In this detailed article, we’ll explore what this scorecard is, how it works, its structure, features, advantages, best practices, and frequently asked questions.
Click to buy E-commerce KPI Scorecard in Excel
What Is an E-commerce KPI Scorecard in Excel?
An E-commerce KPI Scorecard in Excel is a performance management tool designed to help online retailers measure, track, and analyze their business metrics effectively.
It consolidates various KPIs — such as sales, conversion rate, customer acquisition cost, return rate, and order fulfillment time — into a single, visually engaging dashboard.
Unlike complex business intelligence tools, this Excel-based scorecard provides simplicity, flexibility, and real-time insights without requiring any coding or advanced software.
With dropdown menus, trend charts, and interactive visuals, this scorecard allows business owners and managers to assess Month-to-Date (MTD) and Year-to-Date (YTD) performance against targets and previous year values.
Key Features of the E-commerce KPI Scorecard in Excel
This ready-to-use Excel template comes with four powerful worksheets, each designed for a specific analytical purpose.
Let’s break them down one by one.
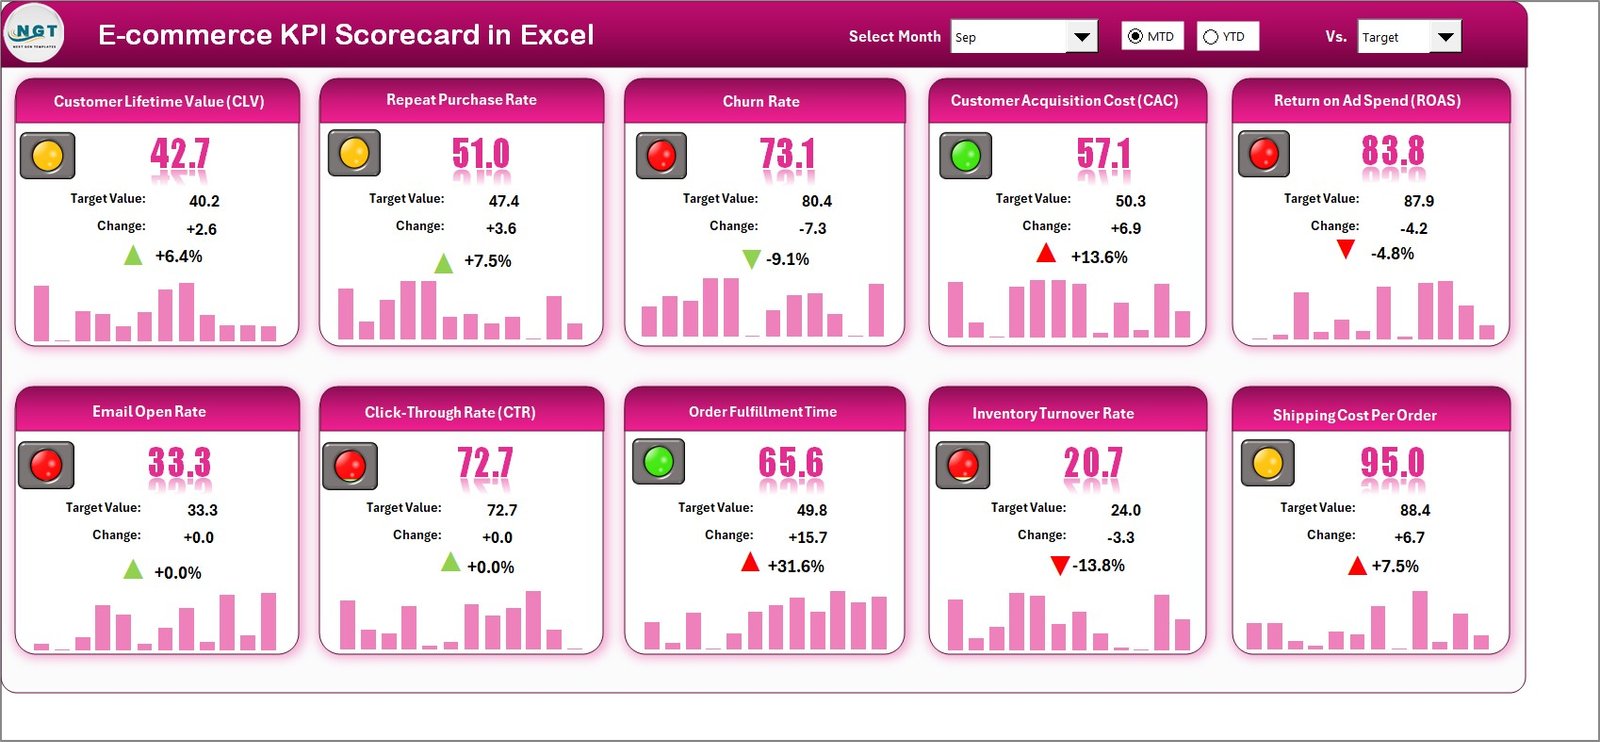
Scorecard Sheet – The Main Performance Hub
The Scorecard sheet is the central dashboard where users can view performance metrics and compare them against goals.
Key highlights include:
- Dropdown Menus: Easily select any month and view data for MTD or YTD performance.
- Actual vs Target Comparison: Instantly compare actual values against targets to evaluate goal achievement.
- Visual Indicators: Color-coded symbols and conditional formatting make it easy to spot underperforming or overperforming KPIs.
- Comprehensive KPI Overview: Displays all relevant metrics, including current, previous, and target values.
- Multiple KPIs in One View: View and analyze up to 10 KPIs simultaneously.
This sheet is designed for decision-makers who need a snapshot of the overall business performance at a glance.
Click to buy E-commerce KPI Scorecard in Excel
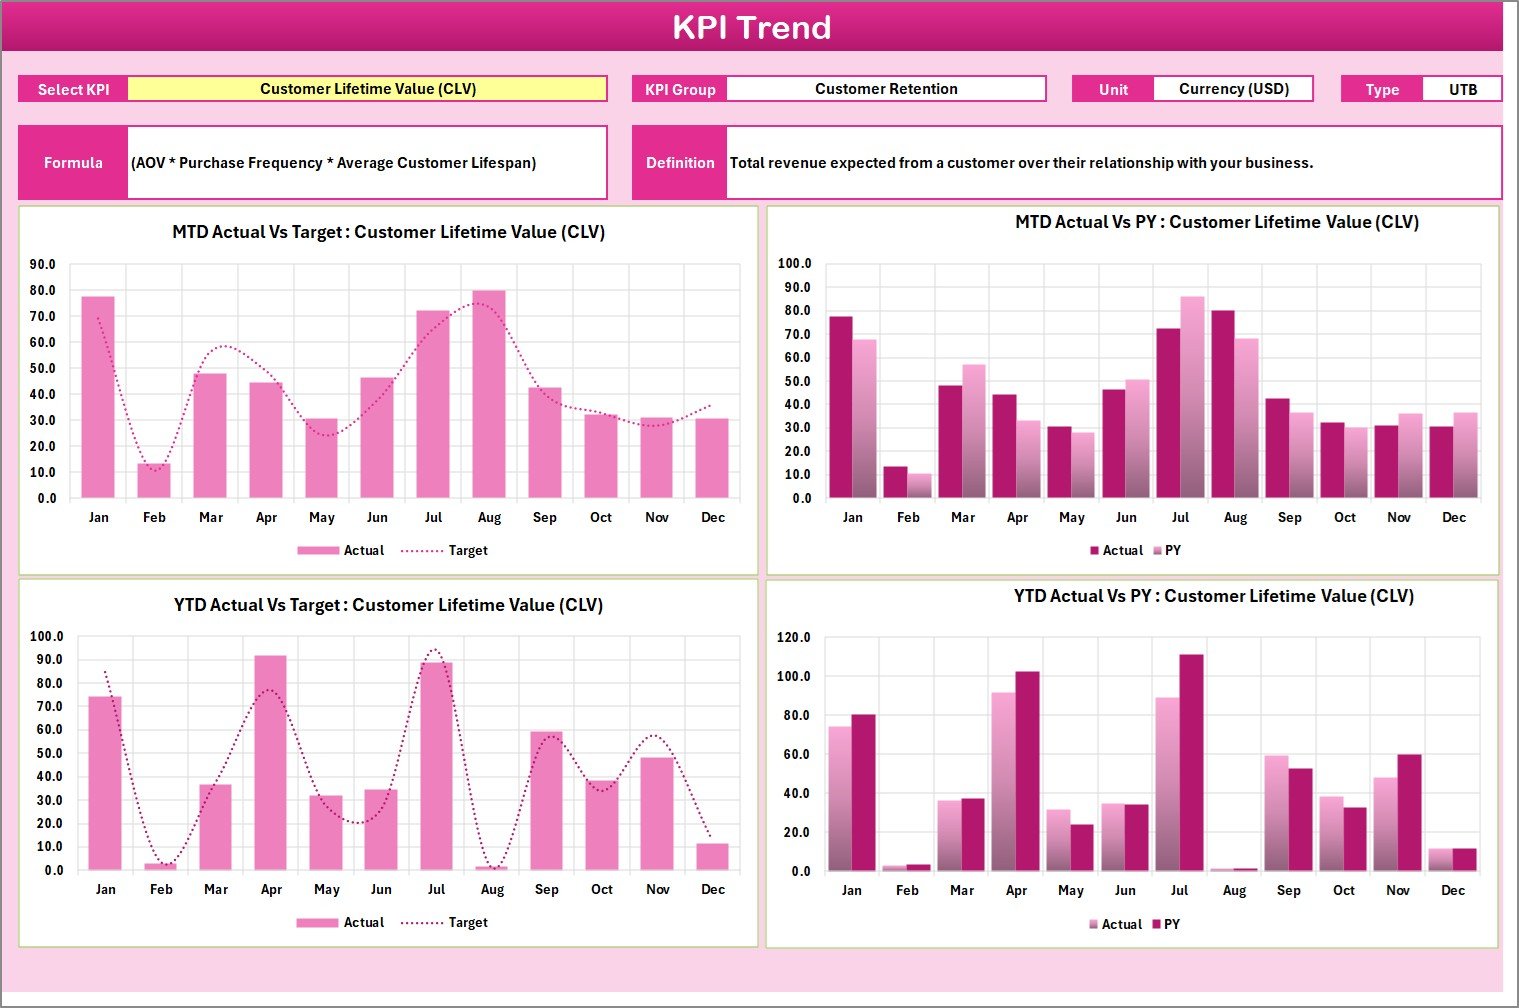
KPI Trend Sheet – Analyzing Performance Over Time
The KPI Trend Sheet focuses on tracking progress and spotting trends.
Key components:
- Dynamic Dropdown: Select any KPI name from the dropdown in cell C3 to display specific data.
- KPI Metadata: Displays details such as KPI Group, Unit of Measurement, KPI Type (UTB – Upper the Better, LTB – Lower the Better), Formula, and Definition.
- Trend Charts: Provides MTD and YTD trend visualizations for Actual, Target, and Previous Year data.
This sheet helps analysts and business leaders understand performance trajectories and identify improvement opportunities.
Click to buy E-commerce KPI Scorecard in Excel
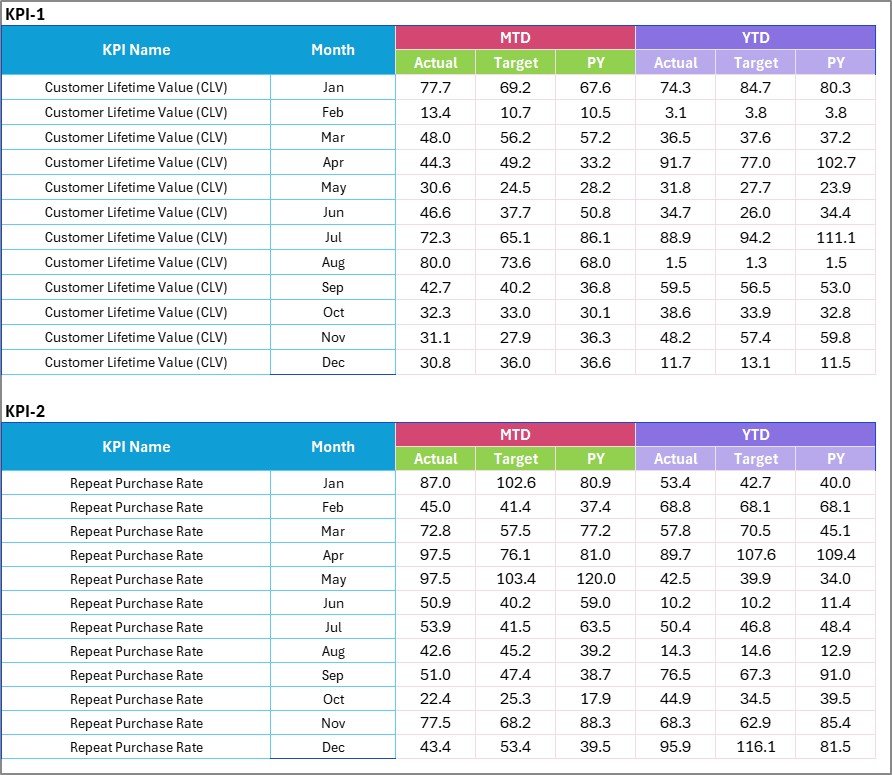
Input Data Sheet – The Backbone of Data Entry
The Input Data Sheet is where users feed in their performance data.
Here’s how it functions:
- Data Entry Fields: Enter actuals, targets, and other supporting data for each KPI.
- Dynamic Updates: As new results are added, the scorecard updates automatically.
- Data Flexibility: Supports multiple time periods, product categories, and regions, making it suitable for any e-commerce structure.
This sheet keeps your data centralized and ensures accurate insights across all other tabs.
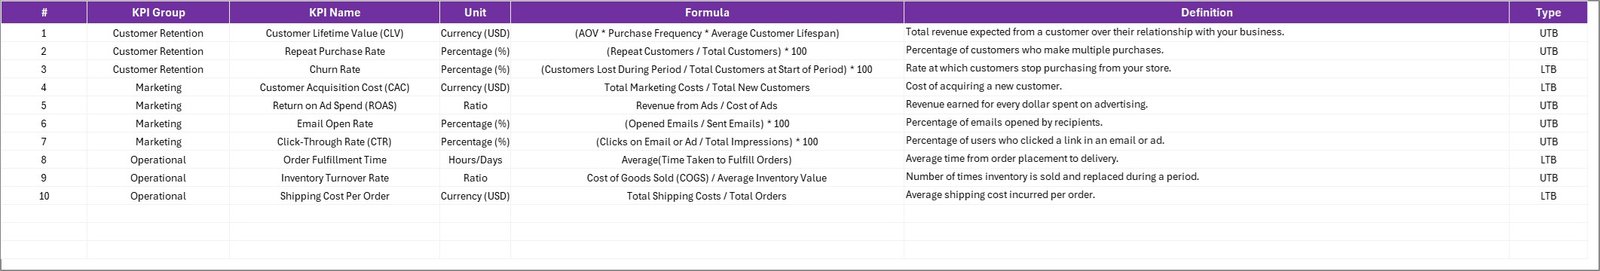
KPI Definition Sheet – The Reference Hub
The KPI Definition Sheet acts as a guide for users to understand how each KPI is defined and calculated.
It includes:
- KPI Name: Unique identifier for each performance metric.
- KPI Group: Categorizes KPIs under headings like Sales, Marketing, Operations, and Customer Experience.
- Unit: Defines the measurement unit (e.g., %, $, Number, Days).
- Formula: Explains how the KPI value is calculated.
- Definition: Provides a brief explanation of the KPI’s meaning and importance.
This reference ensures consistency and helps new users interpret the data correctly.
Why Use an E-commerce KPI Scorecard in Excel?
Modern e-commerce operations generate vast amounts of data daily — sales, ads, logistics, customer service, and more. Without a structured system to measure performance, it’s easy to lose focus on what truly drives success.
Here’s why every e-commerce business should use this Excel-based KPI Scorecard:
- Simplifies complex data analysis with easy-to-understand visuals.
- Tracks performance trends over time for better forecasting.
- Encourages accountability across departments.
- Supports both MTD and YTD comparisons for in-depth reporting.
- Reduces dependency on expensive BI tools while providing professional-level insights.
- Helps identify gaps and areas for improvement.
Advantages of Using the E-commerce KPI Scorecard in Excel
Let’s look at the main benefits this scorecard offers to e-commerce businesses:
- Real-time Performance Tracking
Monitor how your business performs every day, week, or month — with live data updates.
- Improved Decision-Making
Make quick, informed decisions backed by accurate insights instead of assumptions.
- Visual Clarity
The color-coded visuals and charts make complex numbers easy to interpret.
- Ease of Use
Excel’s familiar interface ensures anyone can use it without training or coding.
- Customization
You can modify KPIs, formulas, and charts as your business evolves.
- Cost Efficiency
Unlike costly BI platforms, this Excel template provides professional-grade analytics at no extra cost.
- Comprehensive Reporting
It combines performance data from multiple departments — sales, marketing, logistics, and customer service — into one cohesive view.
Best Practices for Using the E-commerce KPI Scorecard
To maximize the value of your KPI Scorecard, follow these proven best practices:
- Define Clear KPI Goals
Make sure every KPI aligns with your business objectives and has a measurable target. - Maintain Data Accuracy
Double-check all entries in the Input Data Sheet to ensure reliable insights. - Update Data Regularly
Refresh your data weekly or monthly to keep the scorecard relevant and actionable. - Segment Data by Category
Analyze KPIs by product type, region, or customer segment for more precise insights. - Visualize Trends Over Time
Use the Trend Sheet to identify seasonal patterns and anomalies. - Share Results with Teams
Use the Scorecard as a communication tool during meetings and performance reviews. - Automate Data Entry (Optional)
Link the Input Sheet to your e-commerce platform or Google Analytics for real-time updates for unified performance tracking.
- E-commerce platforms (Shopify, WooCommerce, Magento) for automated data import.
Conclusion
The E-commerce KPI Scorecard in Excel is more than just a spreadsheet — it’s a complete business intelligence solution for online retailers.
With its structured design, intuitive visuals, and analytical depth, it helps you stay focused on what truly matters — growing your sales, improving customer satisfaction, and optimizing every process in your online store.
Whether you’re a startup founder or a seasoned e-commerce manager, this scorecard gives you the clarity to make informed, data-backed decisions that elevate your brand’s performance.
Frequently Asked Questions (FAQs)
- What is an E-commerce KPI Scorecard used for?
It helps track and measure key business metrics like sales, marketing performance, and customer satisfaction — all in one Excel dashboard.
- How many KPIs can I track in this scorecard?
You can view up to 10 KPIs simultaneously on the main Scorecard sheet, but you can add more as needed.
- Can I customize the KPIs or formulas?
Yes, the template is fully editable. You can change KPI names, formulas, and target values according to your business needs.
- Does this scorecard support MTD and YTD analysis?
Absolutely! You can toggle between Month-to-Date and Year-to-Date views using dropdown menus.
- Is any coding or VBA required?
No. The scorecard is built entirely with Excel formulas and formatting — no programming needed.
- How often should I update the data?
For the best results, update data weekly or monthly depending on your reporting frequency.
- Can I use it with Google Sheets or Power BI?
Yes. You can upload it to Google Sheets for collaboration or connect it to Power BI for advanced visualization.
- What makes this scorecard different from others?
Its simplicity, flexibility, and real-time insights make it ideal for both small and large e-commerce teams.
Visit our YouTube channel to learn step-by-step video tutorials
Watch the step-by-step video tutorial:
Click to buy E-commerce KPI Scorecard in Excel

