The fitness industry thrives on progress, precision, and performance. Whether you manage a gym, fitness chain, yoga studio, or personal training business, tracking results is crucial for success. But without structured data, it’s hard to know what’s working and where improvements are needed.
That’s where the Fitness Industry KPI Scorecard in Excel comes in. This ready-to-use template empowers business owners, managers, and fitness professionals to monitor performance, analyze growth trends, and make data-driven decisions — all in one centralized, easy-to-use Excel dashboard.
In this article, we’ll explore what the Fitness Industry KPI Scorecard in Excel is, its key features, structure, advantages, best practices, and frequently asked questions — all explained in clear, simple terms.
Click to buy Fitness Industry KPI Scorecard in Excel
What Is the Fitness Industry KPI Scorecard in Excel?
A KPI (Key Performance Indicator) Scorecard is a data tool that measures your organization’s success against defined goals. In the context of the fitness industry, KPIs help track everything from membership growth and revenue per client to trainer utilization and class attendance.
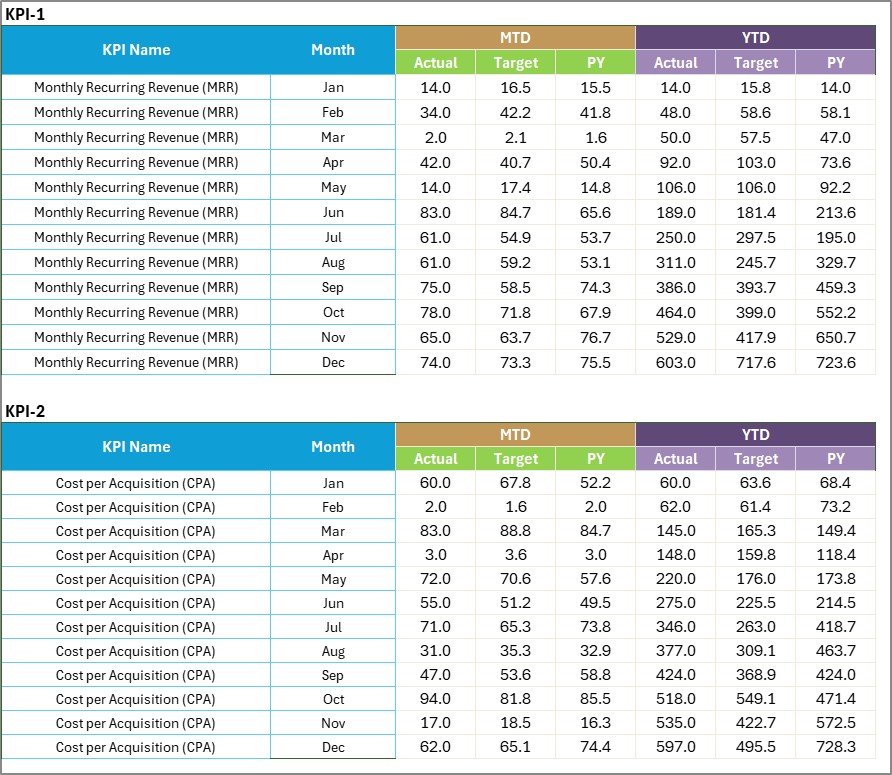
The Fitness Industry KPI Scorecard in Excel consolidates these metrics into one visual dashboard. It allows users to view month-to-date (MTD) and year-to-date (YTD) results, compare targets versus actuals, and identify improvement areas with color-coded visual indicators.
Built entirely in Excel, this scorecard requires no coding or complex setup — just input your data, and the dashboard updates automatically.
Structure of the Fitness Industry KPI Scorecard
The template consists of four interactive worksheets designed to keep your performance tracking organized, dynamic, and insightful.
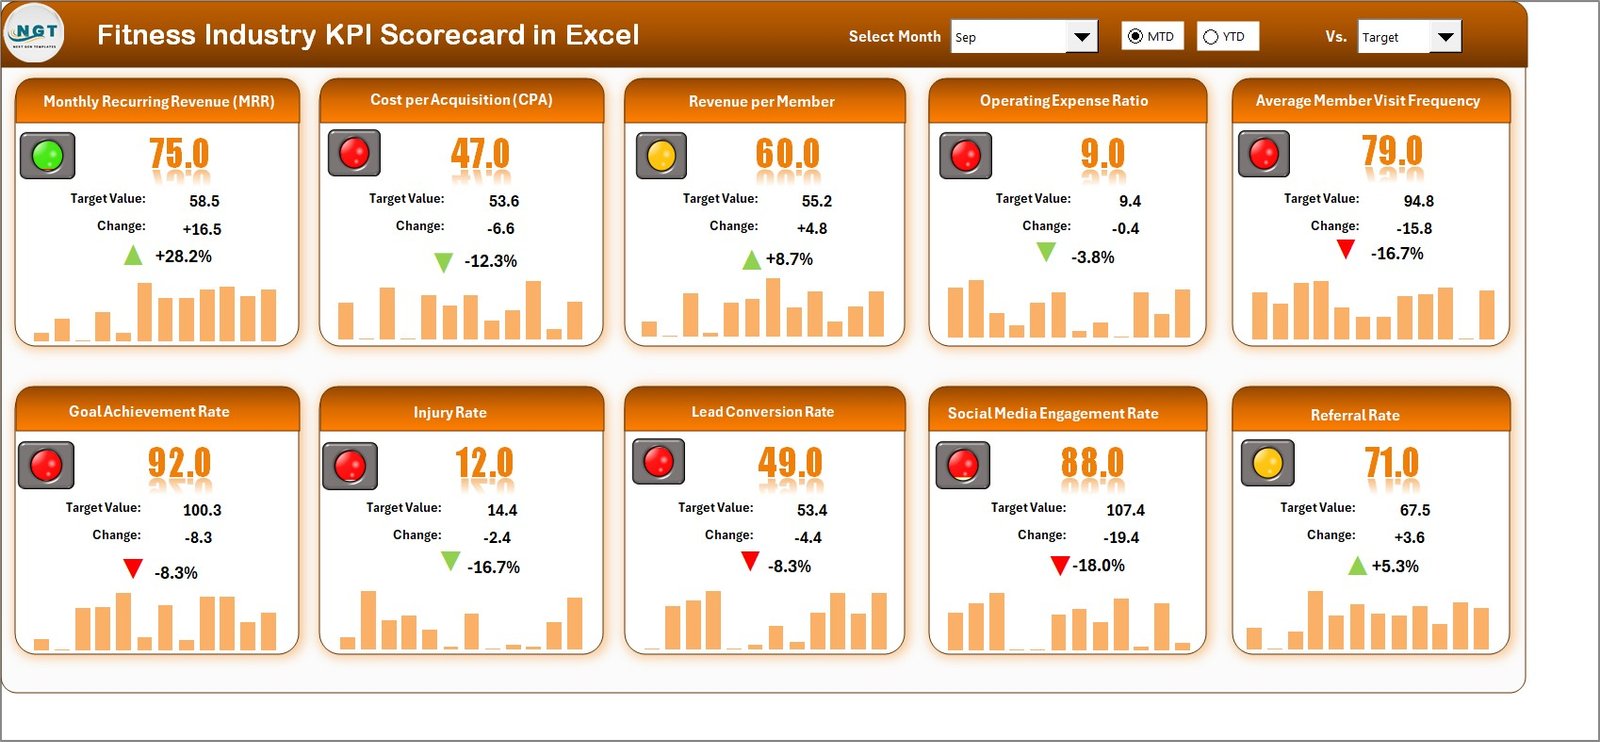
Scorecard Sheet (Main Dashboard)
The Scorecard Sheet is the central interface where users can view KPI performance at a glance.
Key Features:
- Dropdown Menus:
Choose the month or toggle between MTD (Month-to-Date) and YTD (Year-to-Date) views for flexible analysis. - Actual vs Target Comparison:
Compare real performance against set goals to quickly identify success and underperformance. - Visual Indicators:
Traffic-light color coding makes interpretation easy:
Green = Target Achieved,
Yellow = Near Target,
Red = Below Target. - Comprehensive Overview:
Each KPI displays its actual, target, and previous year’s data — giving a complete performance snapshot. - Multi-KPI View:
View 10 KPIs simultaneously for faster management insights.
Click to buy Fitness Industry KPI Scorecard in Excel
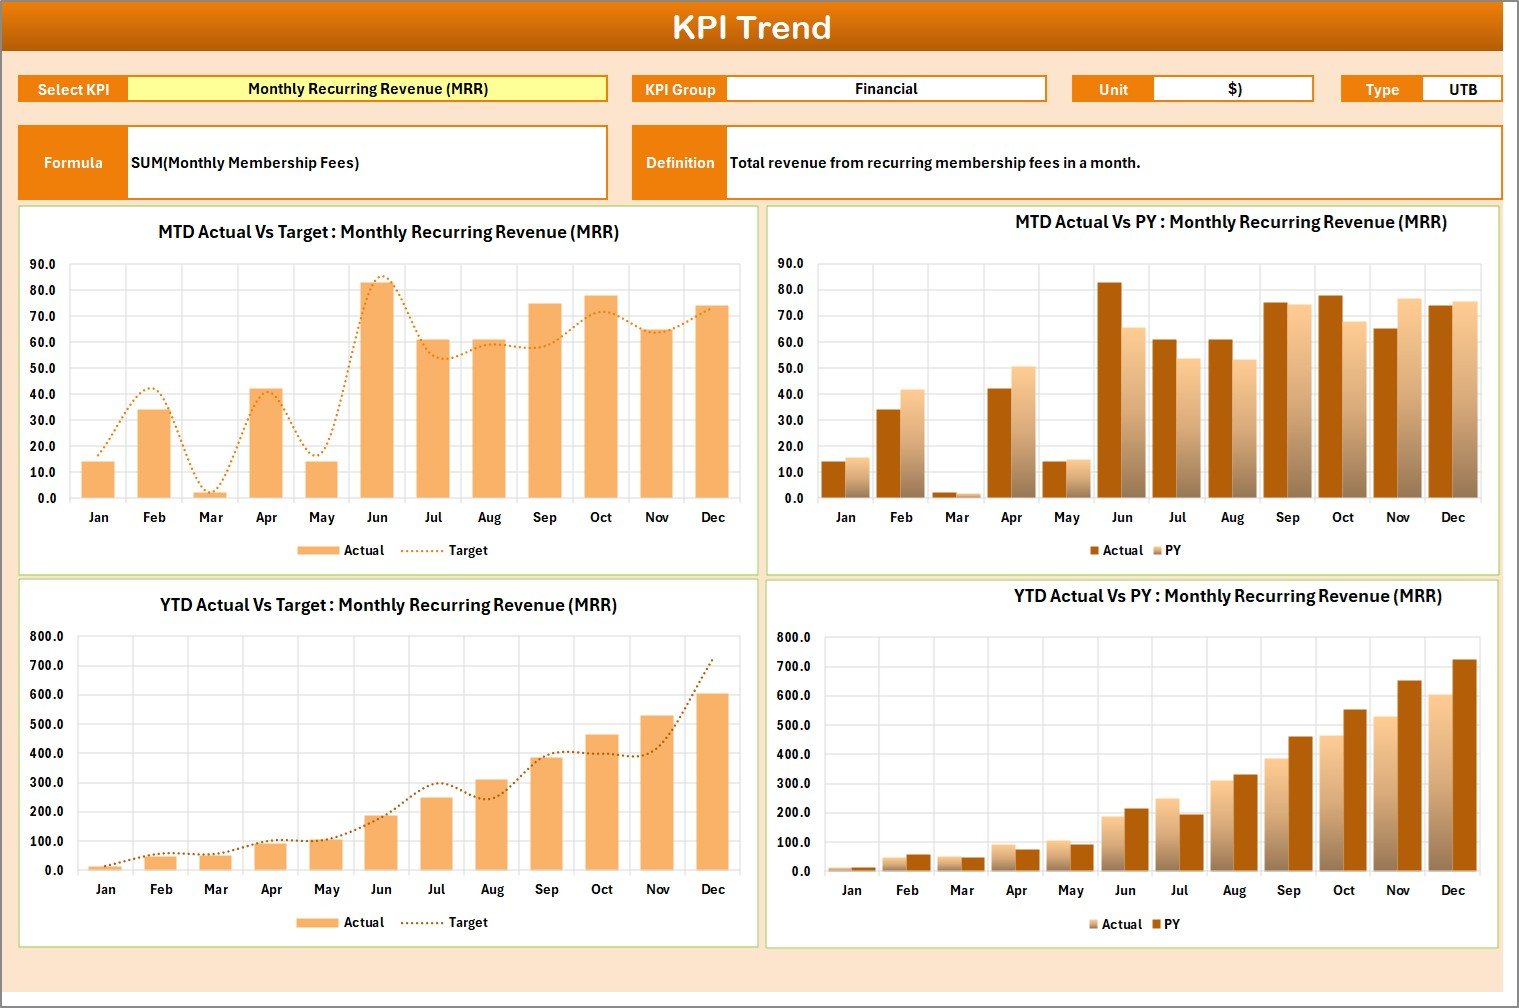
KPI Trend Sheet
The KPI Trend Sheet helps users analyze patterns over time. By selecting a KPI from the dropdown in cell C3, you can visualize performance movement across months or years.
Key Features:
- Displays KPI Group, Unit, KPI Type (e.g., Higher the Better or Lower the Better).
- Includes the Formula and Definition of each KPI for easy reference.
- Provides a trend chart for Actual, Target, and Previous Year (PY) values — ideal for spotting performance fluctuations.
This visual comparison helps managers recognize consistent growth, identify seasonal trends, and plan data-backed strategies.
Click to buy Fitness Industry KPI Scorecard in Excel
Input Data Sheet
The Input Data Sheet acts as the database of your scorecard.
Key Functions:
- Data Entry: Enter monthly actuals, targets, and prior year values for all KPIs.
- Automatic Refresh: Once you update data, all linked sheets and visuals update instantly.
- Editable Format: Add or remove KPIs without breaking the structure.
- Flexibility: You can track performance across multiple centers, trainers, or membership types.
This sheet is ideal for fitness managers who want complete control over their data input and prefer Excel’s simplicity.
Click to buy Fitness Industry KPI Scorecard in Excel
KPI Definition Sheet
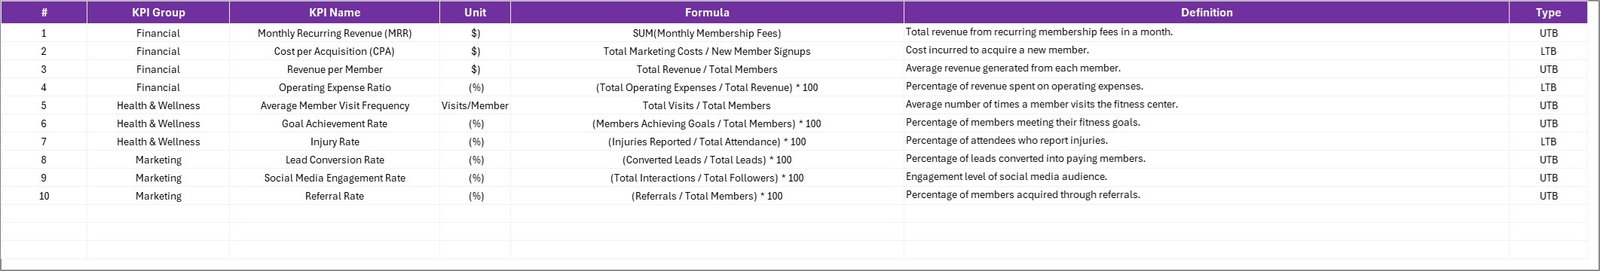
The KPI Definition Sheet brings clarity and consistency across your measurement process.
Contents:
- KPI Name
- KPI Group (e.g., Membership, Finance, Operations)
- Unit (e.g., %, Count, USD)
- Formula (for calculation transparency)
- Definition (for interpretation consistency)
Having this centralized reference ensures that all team members understand what each KPI means and how it is calculated — a critical element for data integrity.
Why KPI Scorecards Matter in the Fitness Industry
In today’s competitive fitness environment, success depends on tracking performance continuously. Intuition alone isn’t enough — measurable data drives informed business decisions.
Here’s why KPI scorecards are essential for fitness organizations:
- Data-Driven Decisions: Turn numbers into actionable insights.
- Performance Visibility: See which areas need immediate attention.
- Employee Motivation: Clear targets help trainers and staff stay accountable.
- Customer Retention: Identify what keeps members satisfied and loyal.
- Profitability Tracking: Understand revenue patterns and operational costs.
A structured scorecard turns complex business data into a simple, visual performance story.
Top 10 KPIs to Track in the Fitness Industry
A well-designed KPI scorecard covers all key business dimensions. Here are ten crucial metrics you can track in your Fitness Industry KPI Scorecard in Excel:
- Membership Growth Rate (%) – Measures new member sign-ups compared to the previous month or year.
- Member Retention Rate (%) – Tracks the percentage of members who renew subscriptions.
- Average Revenue per Member (USD) – Helps gauge profitability per client.
- Trainer Utilization Rate (%) – Shows how efficiently trainers’ working hours are utilized.
- Class Attendance Rate (%) – Indicates how many members attend classes compared to total available slots.
- Revenue Growth (%) – Reflects financial performance and business expansion.
- Customer Satisfaction Score (1–10) – Collects feedback on services, ambiance, and equipment quality.
- Operational Cost per Member (USD) – Helps assess expense efficiency.
- New vs Returning Members Ratio – Reveals acquisition vs retention balance.
- Net Profit Margin (%) – Determines the overall profitability of operations.
How the Scorecard Helps Fitness Centers Succeed
The Fitness Industry KPI Scorecard in Excel simplifies management and reporting by providing structured insights across departments.
- Financial Analysis
Track revenue trends, cost patterns, and profit margins to assess the financial health of your business.
- Member Insights
Analyze new sign-ups, churn rates, and satisfaction scores to enhance retention strategies.
- Operational Efficiency
Monitor trainer workloads, class capacities, and space utilization for better resource allocation.
- Marketing Effectiveness
Understand which campaigns drive the highest memberships and engagement.
- Strategic Decision-Making
Identify long-term trends and align business goals accordingly.
Advantages of Fitness Industry KPI Scorecard in Excel
Implementing this Excel-based scorecard brings a wide range of benefits. Here are the most important ones:
- User-Friendly Interface
No need for advanced technical knowledge — Excel’s familiar environment makes navigation intuitive.
- Customizable
Easily add, remove, or rename KPIs according to your gym or studio’s needs.
- Instant Insights
Charts and color indicators update automatically whenever data changes.
- Cost-Effective
Unlike expensive BI tools, this Excel scorecard provides powerful analysis at minimal cost.
- Centralized Reporting
Consolidates all metrics into one visual dashboard — ideal for performance meetings.
- Visual Clarity
Use of traffic-light visuals and arrows simplifies performance evaluation.
- Decision Support
Managers can make faster, evidence-based decisions using real-time insights.
- Time Efficiency
Automates calculations and comparisons, reducing manual reporting time.
How to Use the Fitness Industry KPI Scorecard
Using this Excel template is simple and efficient. Here’s how to get started:
- Step 1: Open the file and go to the Input Data Sheet.
- Step 2: Enter actual, target, and previous year data for each KPI.
- Step 3: Switch to the Scorecard Sheet to view performance metrics.
- Step 4: Use dropdowns to select month, MTD, or YTD view.
- Step 5: Check the color indicators and analyze which areas need improvement.
- Step 6: Visit the KPI Trend Sheet to see performance charts and patterns.
- Step 7: Review the KPI Definition Sheet for formula clarity.
That’s it! You now have a complete visual performance dashboard ready for business reviews and strategy discussions.
Best Practices for Using the Fitness Industry KPI Scorecard in Excel
To get the maximum value from your scorecard, follow these best practices:
Define Clear Targets
Set realistic, measurable goals for each KPI. Avoid vague targets.
Keep Data Updated
Regularly update your actual and target values to ensure insights stay relevant.
Standardize Definitions
Maintain consistency in KPI definitions to avoid confusion during analysis.
Use Conditional Formatting
Visual cues like red, yellow, and green indicators improve readability.
Review Trends Monthly
Monitor patterns to identify recurring performance issues or achievements.
Encourage Team Involvement
Share insights with trainers, marketing staff, and operations teams to promote collaboration.
Validate Data Regularly
Check data sources to prevent incorrect conclusions from inaccurate inputs.
Document KPI Ownership
Assign responsible team members for each KPI to improve accountability.
Keep the Dashboard Simple
Avoid cluttered visuals. Simplicity leads to faster comprehension.
Integrate Feedback
Incorporate user feedback to improve scorecard usability over time.
How This Template Supports Business Growth
A well-implemented KPI scorecard does more than track numbers — it transforms how you manage your fitness business.
- Improves Strategic Focus: Keeps attention on the metrics that truly matter.
- Enables Proactive Management: Early detection of declining performance enables quicker action.
- Enhances Transparency: Everyone in the team understands goals and outcomes.
- Strengthens Customer Loyalty: Tracking satisfaction ensures continuous improvement.
- Boosts Profitability: Data-backed decision-making increases efficiency and reduces waste.
By following structured performance management, fitness businesses can achieve sustainable growth with measurable results.
Conclusion
The Fitness Industry KPI Scorecard in Excel is more than just a spreadsheet — it’s a complete performance monitoring system. With its dynamic dashboard, trend analysis charts, and automated visuals, this tool helps gyms, studios, and fitness centers evaluate every aspect of their operations.
By using this scorecard, you can measure what matters most: member satisfaction, operational efficiency, and financial growth — all while saving time and reducing manual effort.
In short, this Excel template is your roadmap to measurable fitness business success.
Frequently Asked Questions (FAQs)
- What is a Fitness KPI Scorecard?
A Fitness KPI Scorecard is a management tool that tracks key metrics — such as membership growth, trainer performance, and customer satisfaction — to assess business success.
- Why use Excel for a KPI Scorecard?
Excel is easy to use, widely available, and cost-effective. It allows for custom formulas, conditional formatting, and charts without requiring specialized software.
- How often should I update the KPI Scorecard?
You should update it monthly or weekly, depending on your reporting cycle and data availability.
- Can I customize the KPIs?
Yes. You can add, edit, or remove KPIs in the Input Data and Definition sheets to match your business needs.
- What are the key benefits of using this scorecard?
It improves data visibility, enhances decision-making, saves reporting time, and promotes team accountability.
- Is it suitable for small gyms and personal trainers?
Absolutely. This Excel scorecard is scalable for both small fitness centers and large multi-location gyms.
- Do I need Excel expertise to use it?
No advanced skills required. Basic Excel knowledge is enough to operate and customize the dashboard.
- Can this scorecard track multiple branches?
Yes, you can extend the Input Data Sheet to include branch or region columns for consolidated analysis.
- How does color coding work?
Conditional formatting automatically changes colors — green, yellow, or red — based on how close actual results are to targets.
- Can I export visuals for presentations?
Yes. You can copy charts or dashboard snapshots directly into PowerPoint or PDF reports for management meetings.
Visit our YouTube channel to learn step-by-step video tutorials
Watch the step-by-step video tutorial:
Click to buy Fitness Industry KPI Scorecard in Excel