In today’s fast-moving fashion world, data is the new trendsetter. Every brand — from global labels to boutique designers — needs accurate, real-time insights into their sales, stock, designs, and customer behavior. Without a structured approach, it becomes difficult to balance creativity with business performance.
That’s where the Fashion & Apparel KPI Dashboard in Excel becomes a game-changing tool. It empowers fashion professionals to measure, monitor, and manage key performance indicators (KPIs) efficiently — without needing any complicated software or coding.
This article explores everything you need to know about this ready-to-use Excel template — how it works, what it includes, and how it can help your business stay ahead of fashion trends with data-driven precision.
Click to buy Fashion & Apparel KPI Dashboard in Excel
What Is a Fashion & Apparel KPI Dashboard in Excel?
A Fashion & Apparel KPI Dashboard in Excel is a smart analytical tool designed to consolidate and visualize performance data for fashion businesses. It helps managers and designers understand how their collections, sales, inventory, and marketing campaigns are performing in real time.
Instead of spending hours manually calculating metrics or preparing monthly reports, this Excel dashboard automates everything — giving you instant access to meaningful insights through clean visuals, charts, and tables.
It’s built for:
- Fashion retailers and wholesalers
- Apparel manufacturers and exporters
- E-commerce clothing brands
- Boutique stores and design studios
Why Is Tracking KPIs Important in the Fashion Industry?
The fashion industry is one of the most dynamic and competitive sectors in the world. Consumer trends change rapidly, production cycles are short, and margins can fluctuate easily. Tracking KPIs (Key Performance Indicators) allows businesses to:
- Monitor financial health: Keep a close watch on sales, profit margins, and expenses.
- Manage stock effectively: Track fast-moving and slow-moving products.
- Understand customer demand: Identify what styles, colors, or price ranges perform best.
- Improve operational efficiency: Measure productivity and turnaround time.
- Align business goals: Ensure every team — design, production, sales, and marketing — works toward the same objectives.
Key Features of the Fashion & Apparel KPI Dashboard in Excel
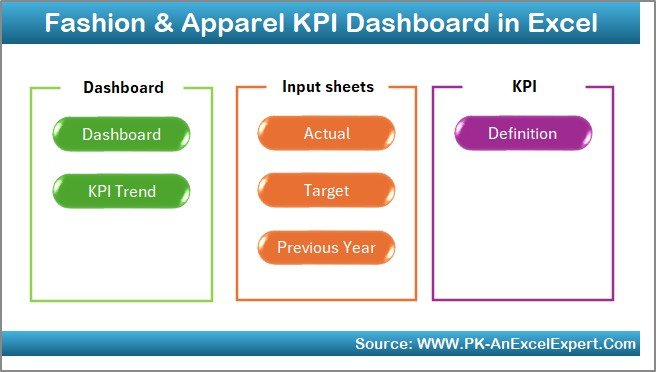
The Fashion & Apparel KPI Dashboard includes seven structured worksheets designed for seamless navigation, real-time tracking, and in-depth performance analysis.
Let’s explore each worksheet in detail 👇
Summary Page – Your Quick Navigation Hub
The Summary Page acts as the control center for your entire dashboard.
It features six navigation buttons that let you jump directly to other sheets such as Dashboard, Trend, Actual Numbers, Targets, Previous Year Data, and KPI Definition.
This interactive design makes it simple for users — even beginners — to move across different sections without scrolling or searching manually.
Highlights:
- User-friendly navigation buttons
- Organized structure for faster access
- Saves time and enhances usability
Click to buy Fashion & Apparel KPI Dashboard in Excel
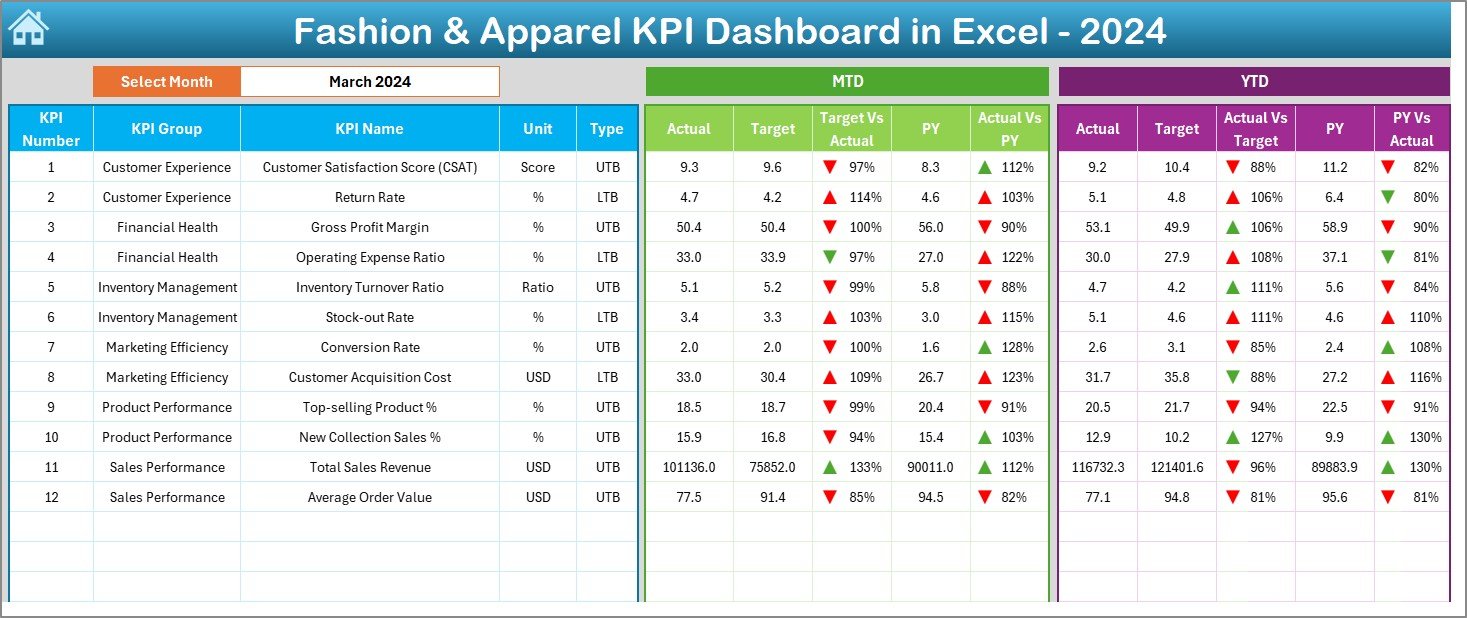
Dashboard Sheet – The Heart of the Template
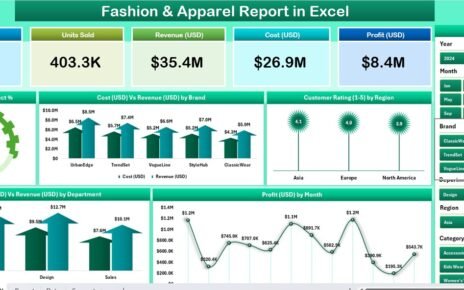
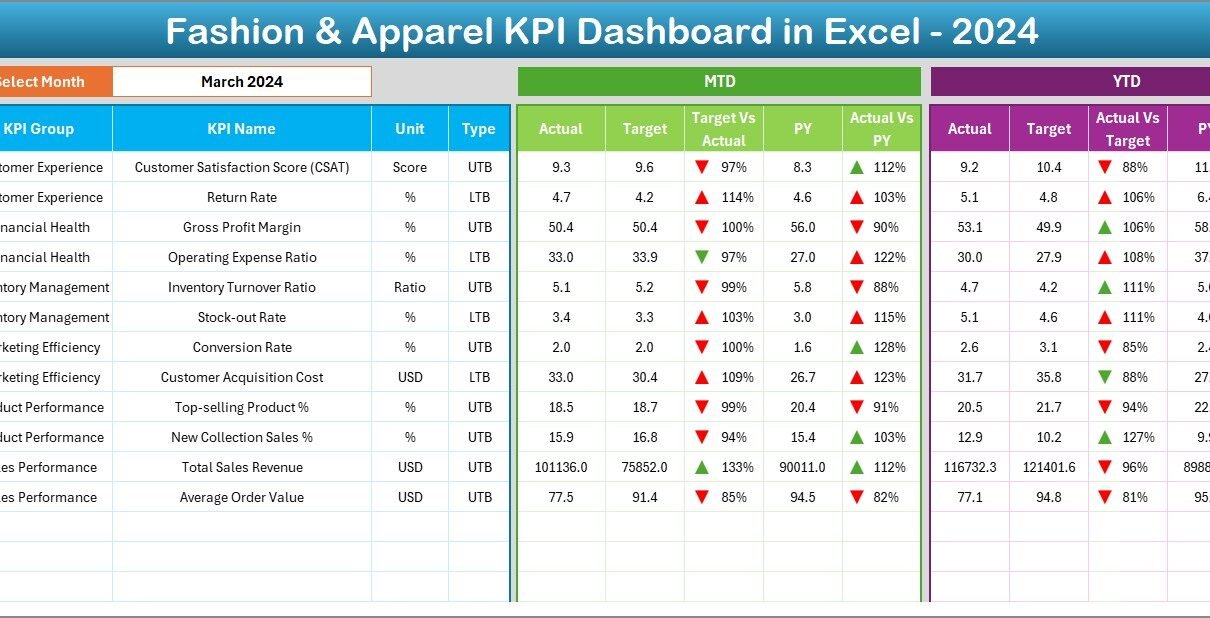
The Dashboard Sheet is the main analytical page where you view all key KPIs at a glance.
At the top (Range D3), you can select the month from a drop-down menu. Instantly, all KPI data updates across the sheet to reflect that month’s performance.
This page shows both Month-to-Date (MTD) and Year-to-Date (YTD) performance for:
- Actual Values
- Targets
- Previous Year Data (PY)
It also displays comparisons such as:
- Target vs Actual
- PY vs Actual
To make the insights visually clear, conditional formatting uses up/down arrows and color indicators — green for improvement and red for decline.
Click to buy Fashion & Apparel KPI Dashboard in Excel
Dashboard Benefits:
- Real-time KPI monitoring
- Visual indicators for performance status
- Instant comparison between target, actual, and previous year
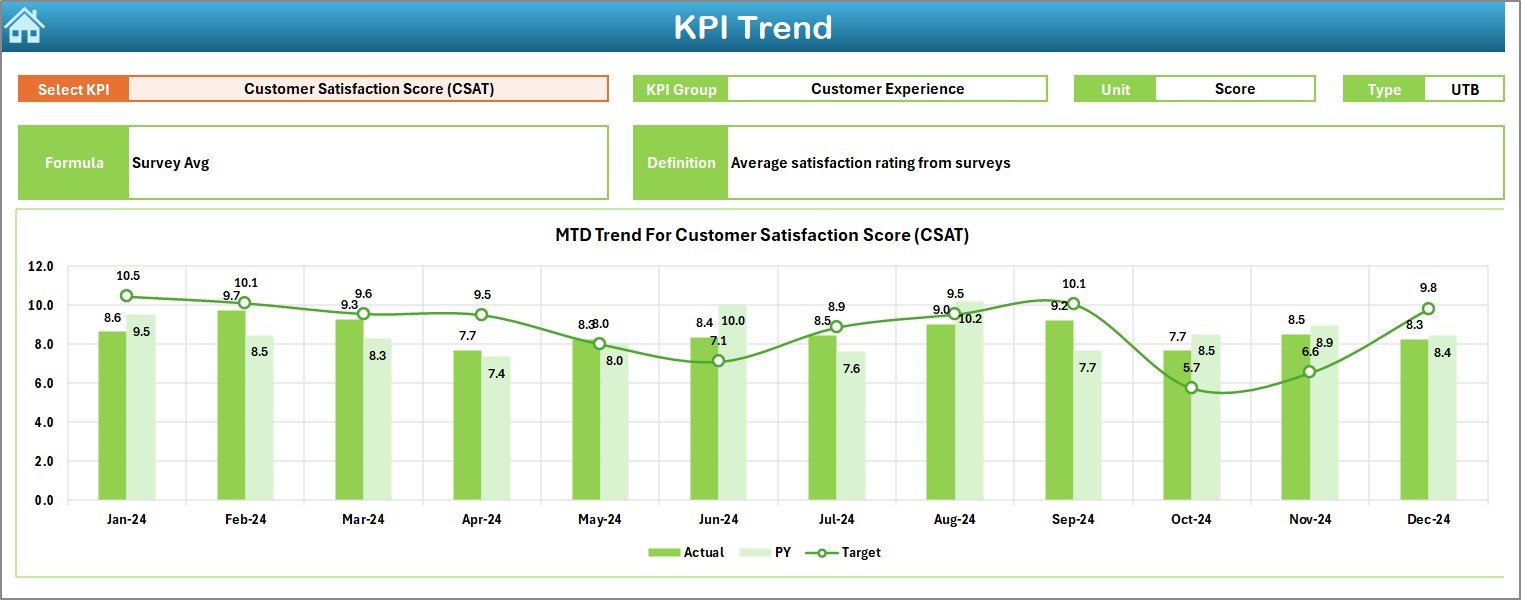
Trend Sheet – Analyze KPI Movement Over Time
The Trend Sheet helps users analyze how each KPI behaves over time.
You can select any KPI name from a drop-down list in cell C3, and the sheet automatically displays:
- KPI Group (e.g., Sales, Operations, Customer Service)
- Unit of Measurement (e.g., %, USD, pieces, etc.)
- Type of KPI – UTB (Upper the Better) or LTB (Lower the Better)
- Formula Used
- Definition of KPI
The sheet also presents MTD and YTD trend charts for Actual, Target, and Previous Year values, allowing you to visualize performance trajectories.
Trend Sheet Benefits:
- Understand seasonal or monthly performance variations
- Identify which KPIs are improving or declining
- Support long-term planning and forecasting
Click to buy Fashion & Apparel KPI Dashboard in Excel
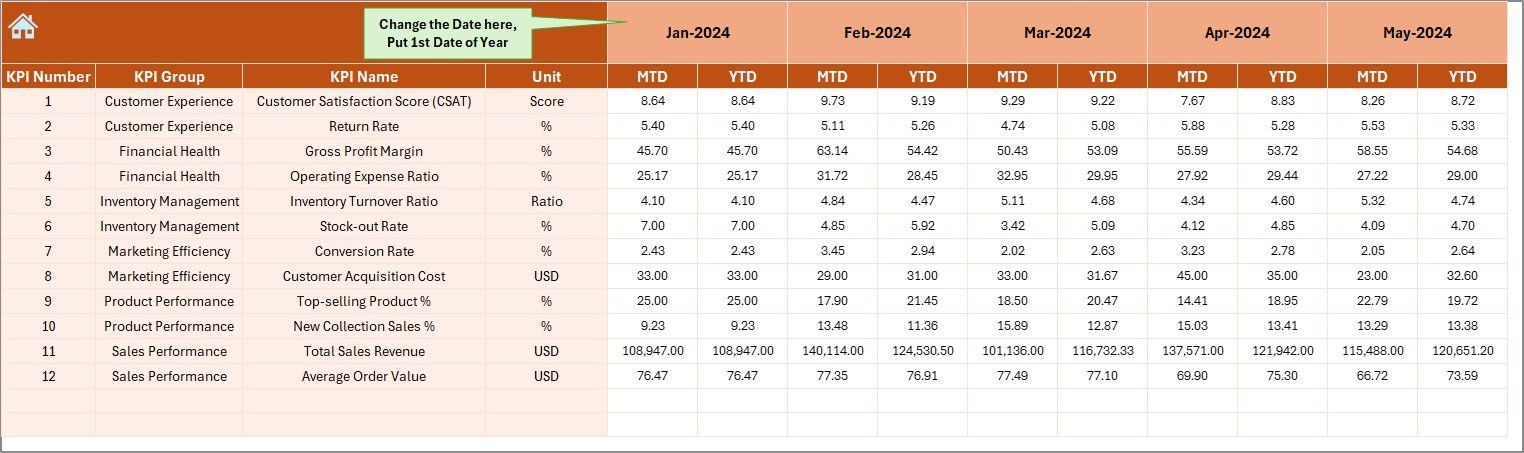
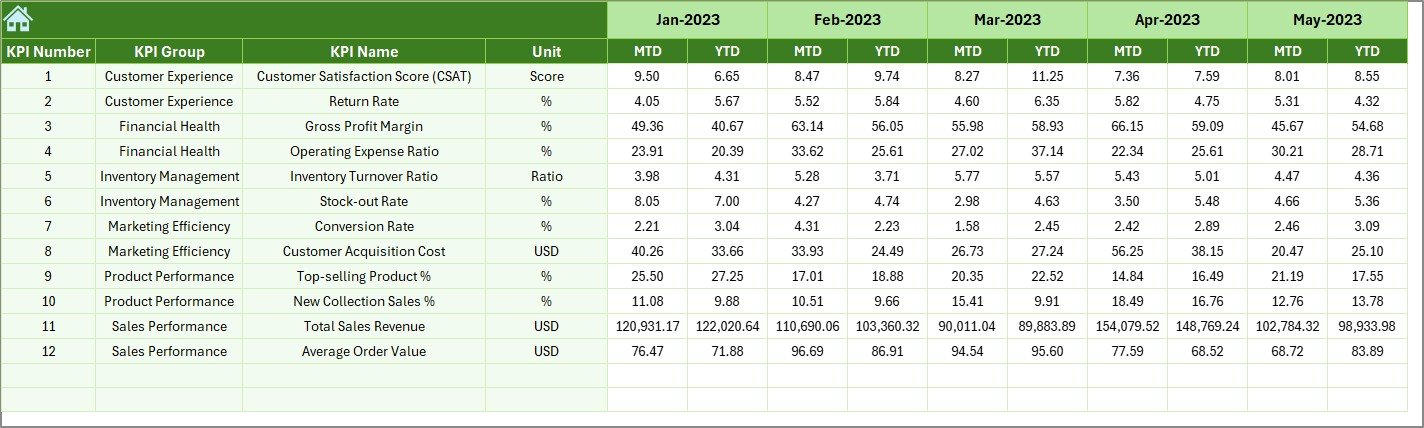
Actual Numbers Input Sheet – Your Data Entry Hub
The Actual Numbers Input Sheet is where you enter the real business data for the current year.
You can set the starting month in cell E1 (for example, January), and the sheet automatically adjusts subsequent months.
Input your MTD and YTD values for each KPI, and the dashboard updates instantly.
Advantages:
- Simplifies data entry
- Auto-adjusts for each financial year
- Ensures accurate and consistent reporting
Click to buy Fashion & Apparel KPI Dashboard in Excel
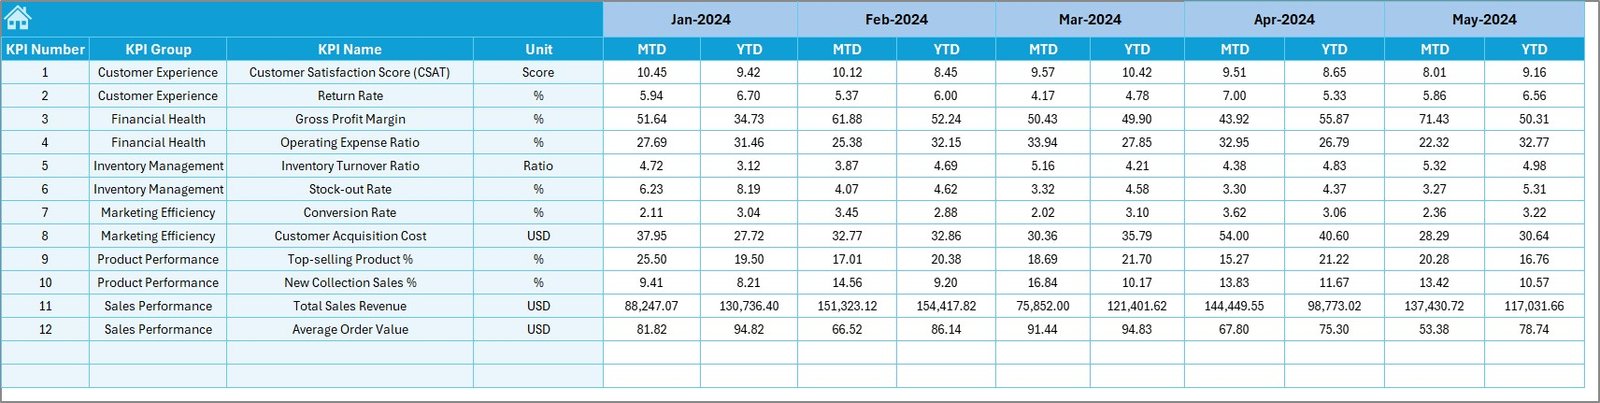
Target Sheet – Define Performance Goals
Every successful fashion business sets performance goals — and this sheet helps you do just that.
The Target Sheet lets you enter monthly targets for both MTD and YTD values of each KPI.
It helps you:
- Establish realistic performance benchmarks
- Align business objectives with measurable targets
- Enable continuous improvement across teams
Highlights:
- Target vs Actual analysis at a glance
- Enables strategic planning and accountability
Click to buy Fashion & Apparel KPI Dashboard in Excel
Previous Year Numbers Sheet – Benchmark Against History
The Previous Year Numbers Sheet allows you to record last year’s figures for comparison.
This makes it easy to track year-over-year (YoY) growth, identify trends, and understand long-term changes in performance.
Benefits:
- Clear performance benchmarking
- Historical data preservation
- Helps identify patterns for better forecasting
KPI Definition Sheet – The Knowledge Base
The KPI Definition Sheet serves as a reference point for every metric in the dashboard.
It includes columns for:
- KPI Name
- KPI Group
- Unit
- Formula
- Definition
- Type (UTB/LTB)
This ensures that everyone in your organization understands how each KPI is calculated and what it represents.
Advantages of Using a Fashion & Apparel KPI Dashboard in Excel
Implementing a KPI Dashboard brings multiple benefits to your fashion business. Let’s look at the top advantages:
- Centralized Performance Tracking
- All key metrics — from sales to production — are stored and analyzed in one place. This eliminates scattered reports and saves valuable time.
- Real-Time Decision Making
- With dynamic drop-downs and auto-updating charts, you can see your business performance instantly and make timely adjustments.
- Customizable for Any Fashion Business
- Whether you’re managing a retail outlet, a manufacturing plant, or an online boutique, this dashboard can easily be customized to suit your workflow.
- Clear Visualization and Insights
- Color-coded charts, arrows, and performance indicators make data easy to interpret — even for non-technical users.
- Historical Comparison and Forecasting
- You can quickly evaluate how your current performance compares to previous years and plan for the future accordingly.
- User-Friendly and Cost-Effective
Built entirely in Excel, this template is easy to use, doesn’t require any coding, and works offline — making it a budget-friendly business intelligence solution.
Best Practices for Using the Fashion & Apparel KPI Dashboard
To get the most out of your Excel dashboard, follow these best practices 👇
- Update Data Regularly
Consistency is key. Enter actual and target data at the end of every month to maintain accuracy.
- Use Standardized KPI Definitions
Ensure every team member uses the same formula and understanding for each KPI. This avoids discrepancies in analysis.
- Keep It Simple and Focused
Avoid overcrowding the dashboard with too many metrics. Focus on KPIs that directly impact your goals — like sales growth, inventory turnover, or return rate.
- Review Trends, Not Just Snapshots
Use the Trend Sheet frequently to study how performance evolves over time rather than relying only on monthly figures.
- Automate Where Possible
Use Excel formulas, conditional formatting, and pivot tables to reduce manual calculations and improve efficiency.
- Validate Data Quality
Double-check source data for errors or missing values. Clean, consistent data ensures more reliable analysis.
- Encourage Data-Driven Decisions
Share insights with design, production, and marketing teams so decisions are guided by facts — not assumptions.
The Fashion & Apparel KPI Dashboard in Excel transforms raw data into business intelligence. Here’s how it supports better decision-making:
- Improves visibility: Get a 360-degree view of business performance.
- Identifies weak spots: Highlight underperforming areas for quick action.
- Supports planning: Use historical and trend data to forecast future sales.
- Boosts accountability: Clear metrics help every department understand their contribution.
How to Use the Dashboard – Step by Step
Here’s a quick guide to getting started:
Open the Template: Download and open the Excel file.
Go to the KPI Definition Sheet: Define all KPIs relevant to your business.
Enter Target Values: Add your monthly and yearly targets in the Target Sheet.
Input Actual Data: Fill in the real-time numbers in the Actual Numbers Input Sheet.
Add Previous Year Data: Record last year’s figures for comparison.
Review the Dashboard: Check the Dashboard sheet to visualize performance.
Analyze Trends: Visit the Trend Sheet to study long-term movement.
By following this process, your dashboard becomes a live performance tracking system — tailored for your brand.
Conclusion
In a world where fashion meets data, the Fashion & Apparel KPI Dashboard in Excel offers the perfect blend of simplicity and intelligence.
It helps brands understand their performance, identify opportunities, and make confident business decisions — all within the familiar environment of Microsoft Excel.
With its interactive sheets, automated calculations, and visually rich reports, this dashboard serves as a complete business monitoring solution for any fashion enterprise.
Whether you’re managing a fast-fashion brand or a luxury label, this Excel template ensures your business performance stays as polished as your latest collection.
Frequently Asked Questions (FAQs)
Who can use the Fashion & Apparel KPI Dashboard in Excel?
Anyone in the fashion industry — including retailers, manufacturers, designers, and marketing professionals — can use this dashboard to track and analyze key metrics.
Do I need Excel expertise to use it?
No. The dashboard is user-friendly and designed for all skill levels. Simple drop-downs and auto-updating charts make it intuitive to use.
Can I customize the KPIs?
Yes. You can easily modify KPI names, formulas, and groups according to your business requirements in the KPI Definition Sheet.
Does it work on both Windows and Mac?
Yes. The dashboard works seamlessly on both platforms with Excel 2016 or later versions.
How often should I update the data?
It’s best to update the data monthly to ensure accurate MTD and YTD tracking.
Can I add more charts or visuals?
Absolutely. You can insert additional pivot charts or visuals to suit your reporting preferences.
What’s the biggest benefit of this dashboard?
It consolidates all business insights — sales, production, quality, and customer engagement — into one simple, dynamic Excel file.
Visit our YouTube channel to learn step-by-step video tutorials
Watch the step-by-step video tutorial:
Click to buy Fashion & Apparel KPI Dashboard in Excel