In today’s fast-moving digital marketing world, data tells the real story behind every campaign. Marketers run dozens of ads across platforms like Google, Facebook, Instagram, and LinkedIn—but tracking their performance can quickly become confusing. That’s where the Advertising Dashboard in Excel comes in.
This ready-to-use dashboard helps marketing professionals monitor campaign performance, analyze ROI, and make informed decisions without using expensive analytics tools. With one powerful Excel file, you can track all advertising metrics—such as impressions, clicks, conversions, cost, and revenue—through clear visuals and data summaries.
Let’s explore everything about the Advertising Dashboard in Excel, including its structure, benefits, best practices, and answers to common questions.
Click to buy Advertising Dashboard in Excel
What Is an Advertising Dashboard in Excel?
An Advertising Dashboard in Excel is a data-visualization tool that consolidates advertising data from different channels (Google Ads, Facebook, Instagram, etc.) into one organized view. It allows you to track key performance indicators (KPIs) and visualize campaign performance using charts, cards, and tables.
Instead of juggling multiple reports from different platforms, you can use this Excel dashboard to:
- Analyze campaign effectiveness in real-time
- Compare actual vs target metrics
- Monitor Return on Investment (ROI) and Conversion Rates
- Identify top-performing channels, formats, and regions
- Track monthly and regional trends with interactive visuals
This dashboard is ideal for marketing agencies, freelancers, and in-house teams that want to simplify ad performance tracking while maintaining full control over their data.
Dashboard Structure and Sheet Tabs
This Excel-based Advertising Dashboard is designed with multiple worksheets, each serving a distinct purpose. Here’s a breakdown of its structure:
Overview Sheet Tab
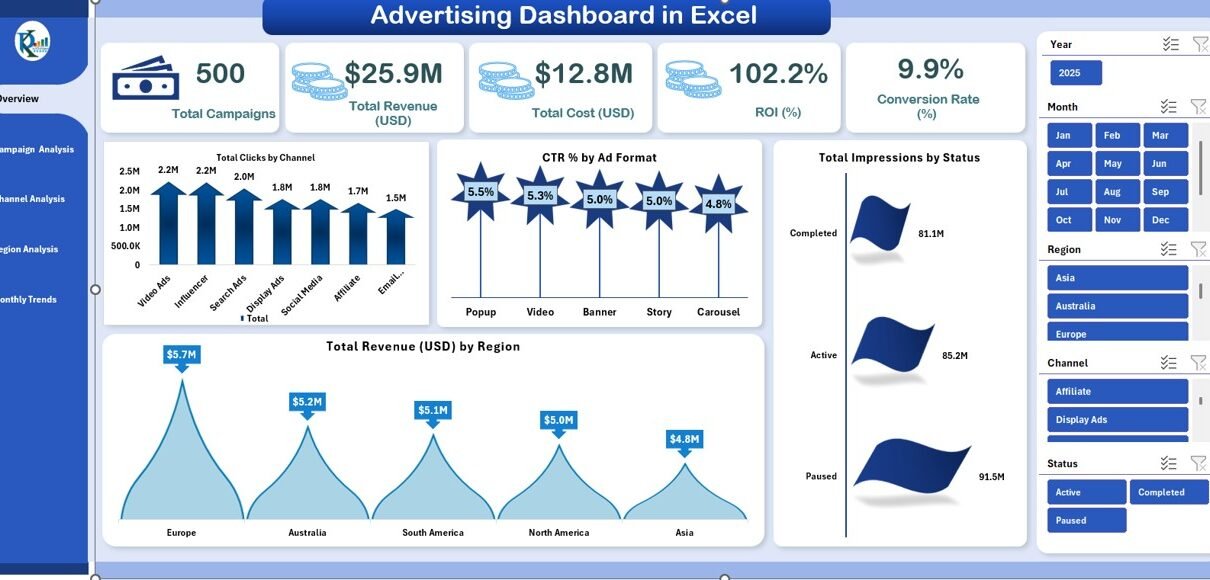
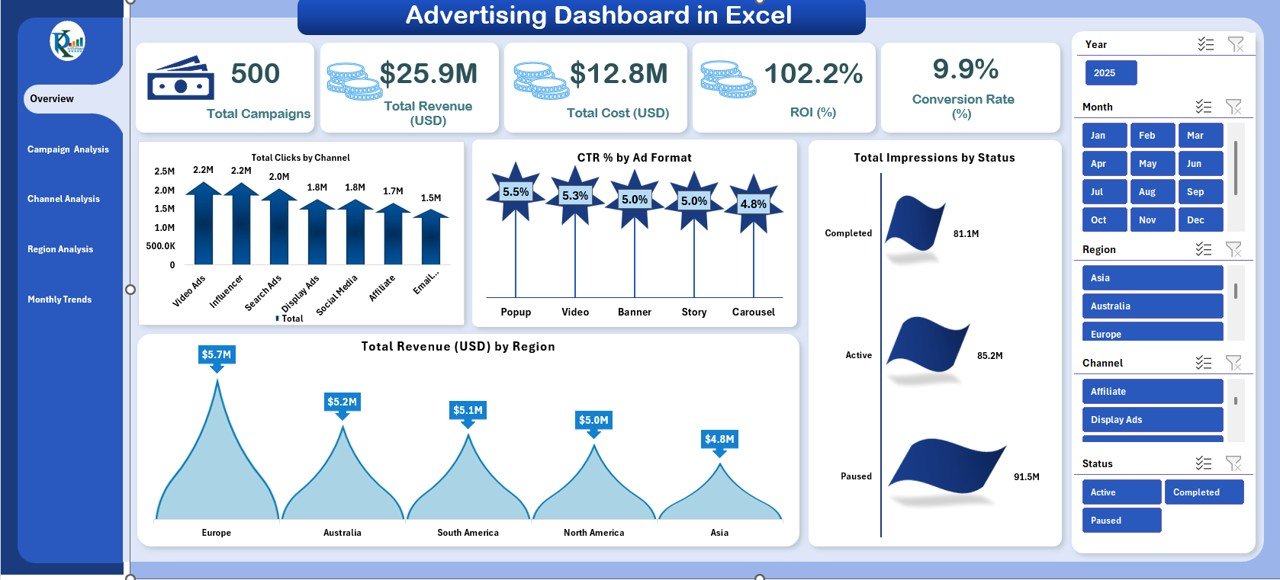
The Overview Sheet is the main interface where users can view the overall advertising performance at a glance.
It includes the following visual cards and KPIs:
- Total Campaigns: Displays the number of active and completed campaigns.
- Total Revenue (USD): Shows total earnings generated from all campaigns.
- Total Cost (USD): Reflects the total ad spend across channels.
- ROI (%): Indicates the overall return on investment for your campaigns.
- Conversion Rate (%): Measures the percentage of users who completed desired actions.
Visual Highlights:
- Total Clicks by Channel: A bar chart showing how each platform performs.
- CTR (%) by Ad Format: Compares click-through rates across banner, video, or carousel ads.
- Total Revenue by Region: Helps you identify high-performing geographical areas.
- Total Impressions by Status: Differentiates active vs completed campaigns visually.
This tab provides a bird’s-eye view of all campaigns so decision-makers can spot strengths and weaknesses instantly.
Click to buy Advertising Dashboard in Excel
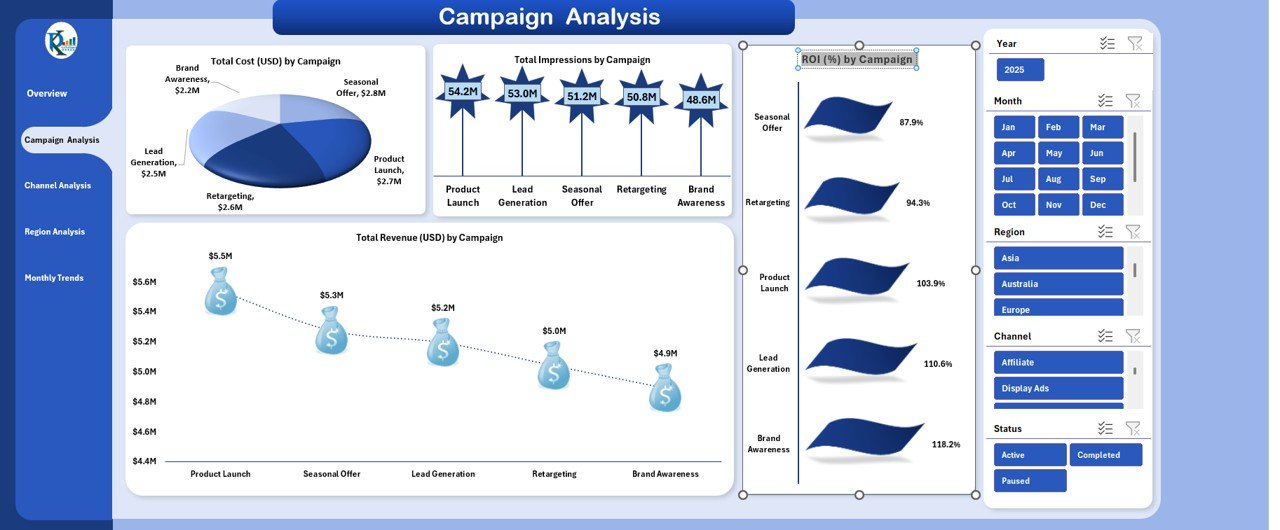
Campaign Analysis Sheet
The Campaign Analysis Sheet allows you to dive deeper into individual campaign performance.
Here you can explore:
- Total Impressions by Campaign – To understand reach and audience size
- Total Revenue (USD) by Campaign – To see which campaign brings maximum revenue
- ROI (%) by Campaign – To analyze profitability at the campaign level
Using filters or dropdowns, users can select specific months, campaign types, or regions to isolate performance data. This helps in refining strategies and reallocating budgets to high-impact campaigns.
Click to buy Advertising Dashboard in Excel
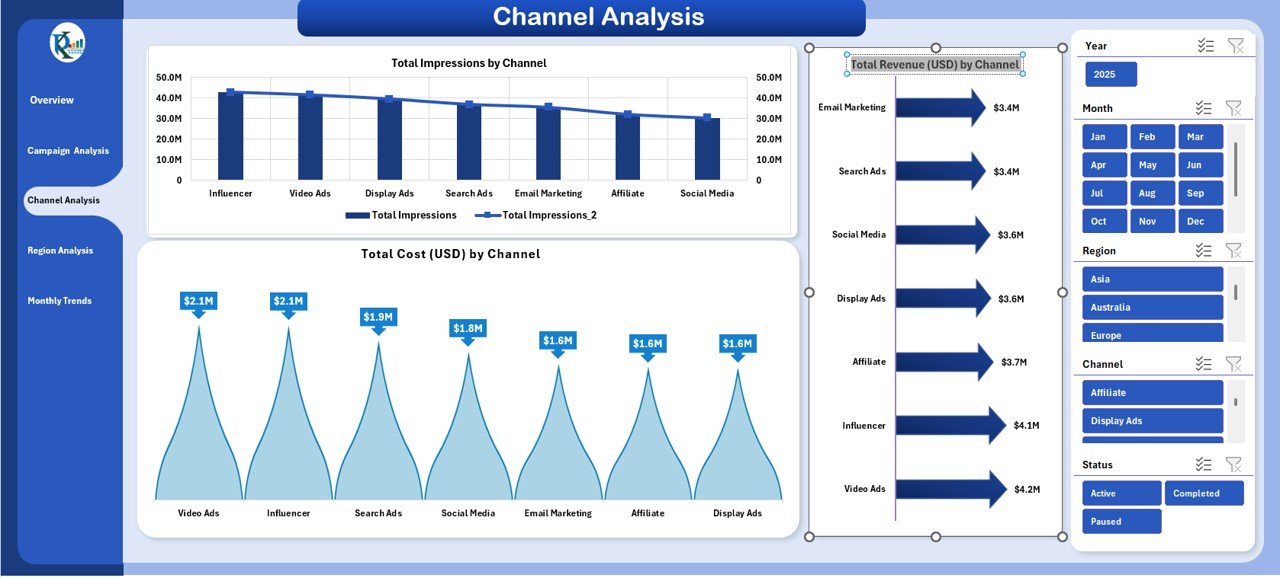
Channel Analysis Sheet
This section compares how different marketing channels perform relative to each other.
Metrics include:
- Total Impressions by Channel – Identifies which channels drive the most visibility
- Total Cost (USD) by Channel – Tracks where most of your advertising budget goes
- Total Revenue (USD) by Channel – Evaluates channel efficiency and profitability
This analysis helps marketers determine which platforms deliver the best ROI and where adjustments are needed. For instance, if Google Ads cost more but yield higher conversions, you can justify higher spending.
Click to buy Advertising Dashboard in Excel
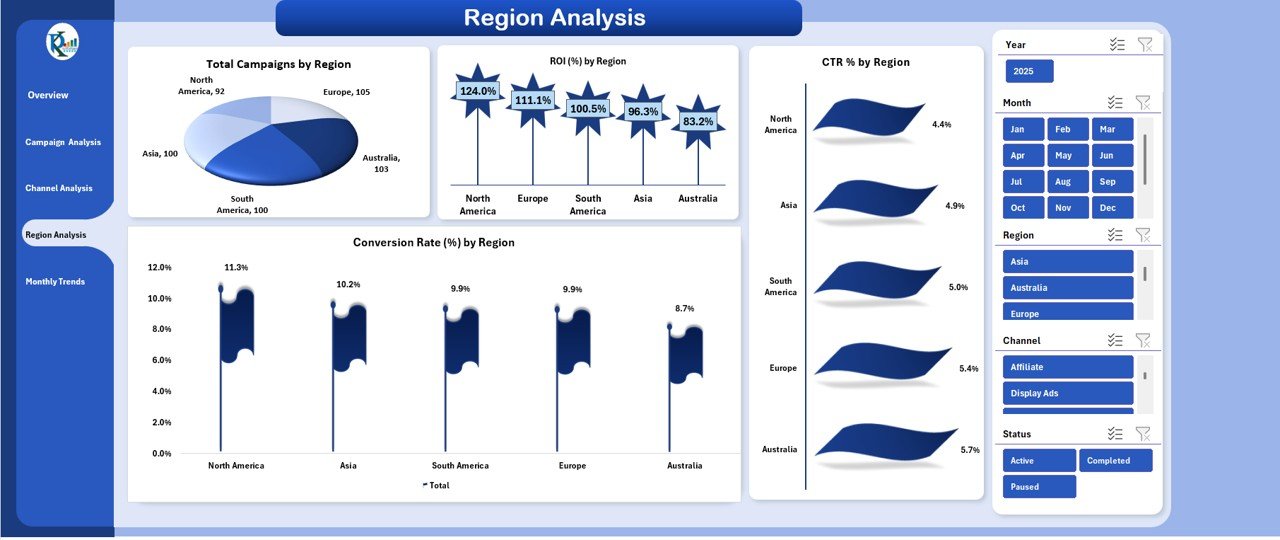
Region Analysis Sheet
Geographical performance often determines marketing success, especially for global or multi-city campaigns.
The Region Analysis Sheet includes:
- Total Campaigns by Region – Shows how many campaigns run in each location
- Conversion Rate (%) by Region – Identifies markets with high engagement
- CTR (%) by Region – Reveals audience interest levels per region
This insight helps in refining regional targeting strategies and optimizing ad creatives for specific audiences.
Click to buy Advertising Dashboard in Excel
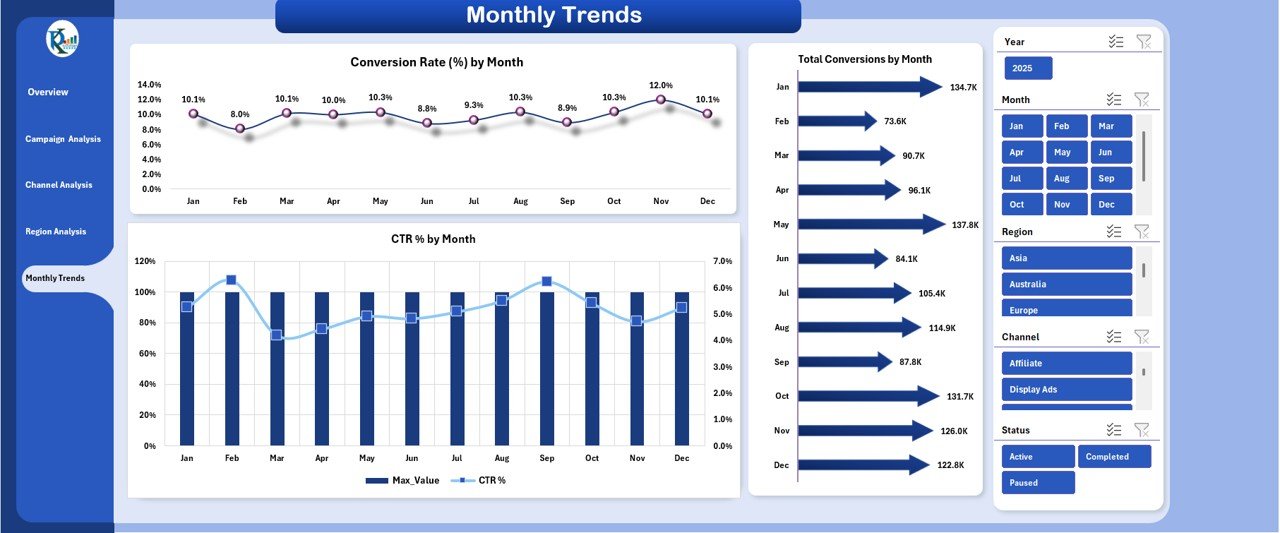
Monthly Trends Sheet
Trend analysis is key to understanding seasonality and growth patterns.
In this sheet, you can explore:
- Conversion Rate (%) by Month – Track how conversion performance changes monthly
- CTR (%) by Month – Evaluate ad engagement trends over time
- Total Conversions by Month – Monitor total customer actions month by month
This trend-tracking tab helps in forecasting future performance, planning budgets, and identifying the most productive advertising months.
Click to buy Advertising Dashboard in Excel
Advantages of Using an Advertising Dashboard in Excel
Using an Advertising Dashboard in Excel offers a variety of advantages for businesses of all sizes. Let’s look at the major ones:
- Centralized Data Management
Instead of pulling data from multiple platforms manually, the dashboard consolidates everything in one file. It reduces errors and saves valuable time.
- Real-Time Performance Insights
You can instantly track which campaigns are driving the most revenue or clicks and adjust strategies immediately.
- Easy-to-Use and Customizable
Excel’s built-in formulas, charts, and pivot tables allow even non-technical users to customize reports based on their needs.
- Cost-Effective Solution
Unlike expensive business intelligence tools, this Excel dashboard provides advanced insights without any subscription cost.
- ROI and Conversion Tracking
The dashboard automatically calculates ROI, CTR, and Conversion Rates, making performance evaluation simpler and faster.
- Visual Storytelling
Charts, trend lines, and KPIs present your marketing data in an easy-to-digest visual format, perfect for management reports and presentations.
- Better Decision-Making
By highlighting underperforming campaigns or regions, the dashboard helps teams focus on strategies that deliver results.
How to Use the Advertising Dashboard Effectively
To get the best results, you should use this Excel dashboard strategically. Here’s how:
- Input Campaign Data Regularly:
Update ad spend, impressions, clicks, and conversion data monthly or weekly to maintain accuracy. - Use Dropdown Filters:
Filter by month, campaign, or region to analyze specific performance segments. - Monitor KPIs Closely:
Track KPIs like ROI, CTR, and Conversion Rate to measure campaign success. - Analyze Trends Over Time:
Compare month-to-month results to understand performance fluctuations. - Highlight Key Insights in Reports:
Use charts and visuals to share insights with stakeholders clearly.
Best Practices for the Advertising Dashboard in Excel
Following best practices ensures that your dashboard remains accurate, insightful, and user-friendly.
- Keep Data Organized
Maintain a clean structure with clear column names for each dataset, such as Campaign Name, Channel, Impressions, Clicks, Cost, Revenue, etc.
- Automate Calculations
Use Excel formulas to automate ROI (%), CTR (%), and Conversion Rate (%) calculations:
- ROI (%) = (Revenue – Cost) / Cost × 100
- CTR (%) = (Clicks / Impressions) × 100
- Conversion Rate (%) = (Conversions / Clicks) × 100
- Update Data Consistently
Ensure that all campaign data (monthly or weekly) stays current to get accurate and actionable insights.
- Use Conditional Formatting
Highlight high ROI or low CTR automatically using color codes (green for good performance, red for poor performance).
- Utilize Pivot Tables for Summary Reports
Pivot tables help aggregate campaign data for quick analysis, like total revenue by channel or ROI by month.
- Visualize Data with Charts
Add bar charts, line graphs, and KPI cards to enhance data readability and storytelling.
- Regularly Validate Data Accuracy
Check for discrepancies in imported data (e.g., mismatched conversions or missing costs) to maintain credibility.
- Protect Sensitive Data
If multiple users access the file, use Excel’s password protection or restrict editing rights.
Why Excel Is Still the Best Choice for Advertising Dashboards
While there are many dashboard tools available, Excel remains one of the most flexible and powerful platforms for advertising data analysis. Here’s why:
- Familiarity: Most marketers already use Excel, so no learning curve.
- Offline Access: You can access your dashboard even without an internet connection.
- Custom Formulas: You can modify or extend calculations anytime.
- Integration: Excel easily connects with CSV or API data exports from Google Ads, Facebook, etc.
- Scalability: It works for both small campaigns and large multi-channel portfolios.
This flexibility makes Excel a go-to solution for marketing teams worldwide.
Conclusion
The Advertising Dashboard in Excel is more than just a reporting tool—it’s a complete performance management system for modern marketers. It helps you understand what works, where to invest, and how to optimize future campaigns using real-time, visual insights.
By integrating campaign, channel, and regional data, this dashboard empowers teams to make smarter, faster, and data-driven decisions. Whether you’re a digital marketing agency or a small business owner, this Excel dashboard is a cost-effective way to gain full visibility into your ad performance.
Frequently Asked Questions (FAQs)
- What is an Advertising Dashboard in Excel used for?
It helps marketers track advertising performance metrics such as clicks, conversions, ROI, and revenue from multiple campaigns and channels—all in one place.
- Can I customize the dashboard for my business?
Yes! You can easily modify KPIs, formulas, and visuals based on your business goals, channels, or reporting preferences.
- How do I calculate ROI in the dashboard?
Use the formula:
ROI (%) = (Revenue – Cost) / Cost × 100
This shows how much profit your campaigns generate for each dollar spent.
- How often should I update my data?
Ideally, update campaign data weekly or monthly to ensure real-time accuracy and relevant insights.
- Can I use this dashboard for multiple ad platforms?
Absolutely. The dashboard can consolidate data from Google Ads, Facebook, Instagram, LinkedIn, or any platform that exports performance reports in Excel or CSV format.
- Is Excel better than Power BI or Google Data Studio for ad dashboards?
Excel is ideal for marketers who prefer offline access, flexibility, and simplicity. For advanced visualizations and automation, you can later upgrade to Power BI or Google Data Studio.
- How can I track conversion rate in Excel?
Use the formula:
Conversion Rate (%) = (Conversions / Clicks) × 100
It helps identify how effectively your ads turn clicks into actual results.
- Can I share the dashboard with my team?
Yes, you can share the Excel file via OneDrive, Google Drive, or email. To prevent accidental edits, use password protection.
- What makes this dashboard unique?
It combines campaign, channel, region, and monthly analysis—making it a complete 360° advertising performance tracker in Excel.
- Is any technical skill required?
No advanced skills are needed. Anyone familiar with Excel basics can use and modify this dashboard easily.
Visit our YouTube channel to learn step-by-step video tutorials
Watch the step-by-step video tutorial:
Click to buy Advertising Dashboard in Excel