In today’s data-driven world, alternative medicine clinics can no longer rely only on intuition or manual registers to measure success. Instead, they need clear visibility into performance, patient outcomes, financial health, and operational efficiency. That is exactly where an Alternative Medicine KPI Dashboard in Excel becomes a powerful and practical solution.
This detailed guide explains everything you need to know about an Alternative Medicine KPI Dashboard in Excel. Moreover, it expands on the already created dashboard structure and explains how clinics, wellness centers, and holistic healthcare providers can use it effectively. Throughout this article, you will learn what this dashboard is, why it matters, how it works, its worksheet-wise structure, advantages, best practices, and frequently asked questions.
Click to buy Alternative Medicine KPI Dashboard in Excel
What Is an Alternative Medicine KPI Dashboard in Excel?
An Alternative Medicine KPI Dashboard in Excel is a centralized performance monitoring tool designed specifically for alternative and holistic healthcare practices. It helps track, analyze, and visualize key performance indicators (KPIs) related to patient care, treatments, revenue, efficiency, and growth.
Instead of checking multiple Excel sheets or paper records, this dashboard consolidates all critical KPIs into one interactive system. As a result, decision-makers can quickly understand what works well and what needs improvement.
Moreover, Excel-based dashboards remain highly popular because they are flexible, cost-effective, and easy to customize without advanced technical skills.
Why Do Alternative Medicine Clinics Need a KPI Dashboard?
Alternative medicine clinics often manage diverse therapies such as Ayurveda, Homeopathy, Naturopathy, Acupuncture, Chiropractic, Yoga therapy, and Herbal medicine. Therefore, tracking performance manually becomes complex and time-consuming.
A KPI dashboard helps clinics:
- Monitor patient volumes and treatment outcomes
- Track revenue, targets, and year-over-year growth
- Measure therapist productivity
- Compare actual performance against targets
- Improve decision-making using data
As a result, clinics gain clarity, control, and confidence in managing operations.
What KPIs Can Be Tracked in an Alternative Medicine Dashboard?
Before understanding the dashboard structure, it is important to know which KPIs matter most in alternative medicine.
Common Operational KPIs
- Number of patient visits
- New vs returning patients
- Appointment utilization rate
- Treatment completion rate
- Therapist availability and utilization
Financial KPIs
- Monthly revenue
- Revenue per patient
- Target vs actual revenue
- Average treatment cost
- Year-over-year revenue growth
Clinical & Outcome KPIs
- Patient recovery rate
- Treatment success rate
- Follow-up adherence
- Patient satisfaction score
Marketing & Growth KPIs
- Referral rate
- Campaign conversion rate
- Patient acquisition cost
When tracked consistently, these KPIs provide a complete picture of clinic performance.
How Does an Alternative Medicine KPI Dashboard in Excel Work?
An Alternative Medicine KPI Dashboard in Excel works by connecting structured data inputs with automated calculations and visualizations.
First, users enter actual, target, and previous year data in dedicated sheets. Then, Excel formulas calculate KPIs automatically. Finally, interactive dashboards and trend charts display insights clearly.
Moreover, dropdowns and slicers allow users to switch months or KPIs instantly. As a result, the dashboard updates dynamically without manual recalculation.
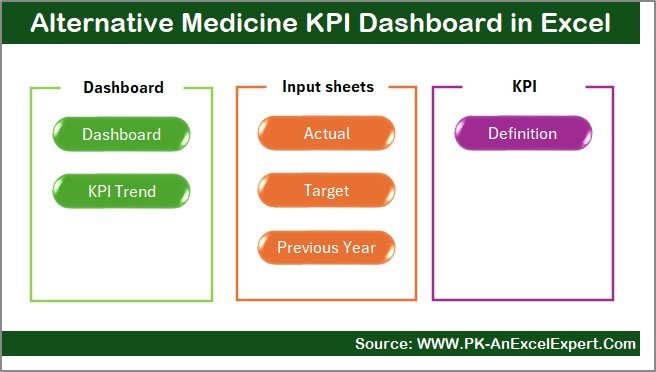
Worksheet-Wise Structure of the Alternative Medicine KPI Dashboard in Excel
This dashboard contains 7 well-structured worksheets, each designed for a specific purpose. Let us explore each sheet in detail.
Summary Page
The Summary Page acts as the index and navigation hub of the entire dashboard.
Key Highlights of the Summary Page
- Serves as the landing page of the dashboard
- Contains 6 navigation buttons to jump to other sheets instantly
- Improves user experience by reducing scrolling and searching
- Makes the dashboard beginner-friendly
Because of this structure, even non-technical users can navigate the dashboard confidently.
Click to buy Alternative Medicine KPI Dashboard in Excel
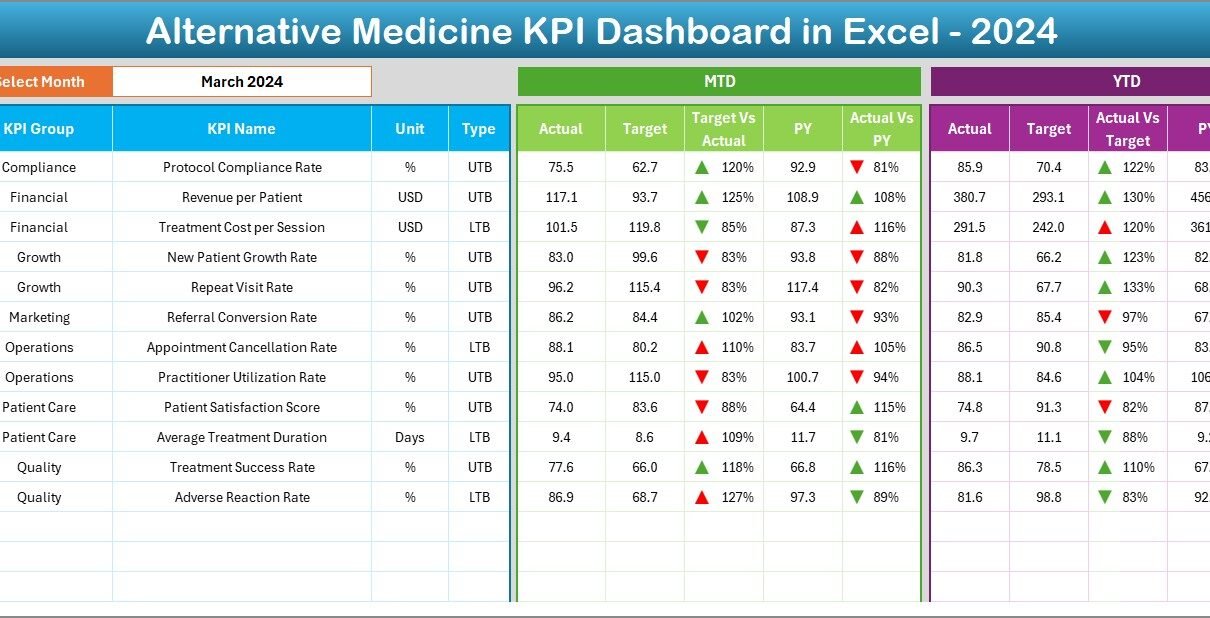
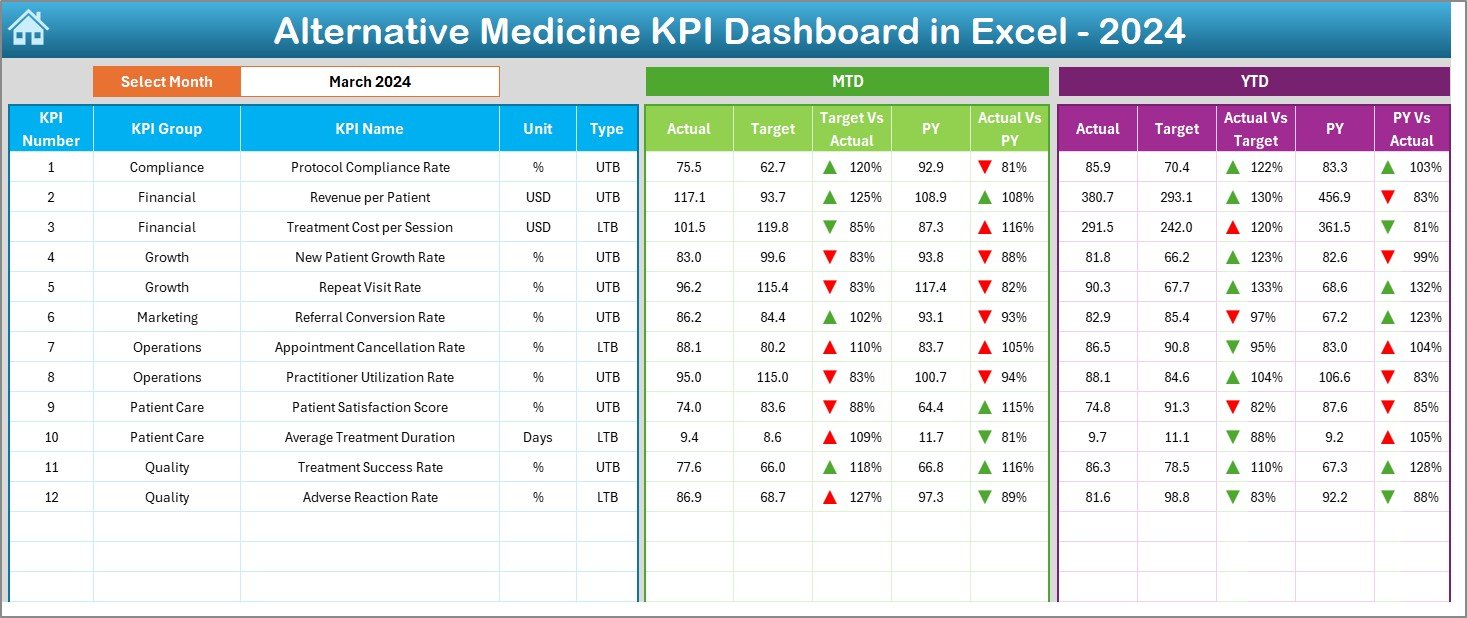
Dashboard Sheet
The Dashboard Sheet Tab is the core analytical page of the KPI dashboard.
Key Features of the Dashboard Sheet
- Displays consolidated KPIs for the selected month
- Month selection dropdown available on cell D3
- Automatically updates all numbers based on the selected month
KPIs Displayed on the Dashboard
- MTD (Month-to-Date) Actual, Target, and Previous Year
- YTD (Year-to-Date) Actual, Target, and Previous Year
- Target vs Actual variance
- Previous Year vs Actual variance
Moreover, conditional formatting with up and down arrows highlights performance trends clearly. Therefore, users can instantly identify whether KPIs perform above or below expectations.
Click to buy Alternative Medicine KPI Dashboard in Excel
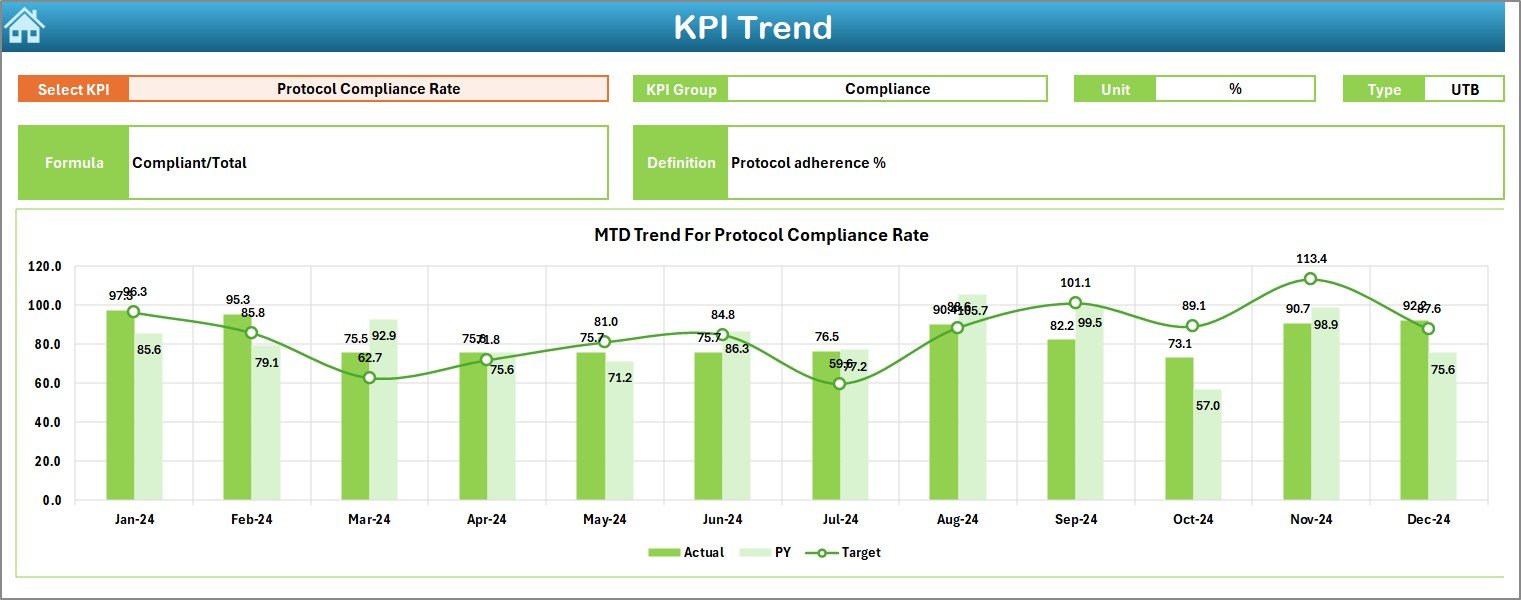
Trend Sheet
The Trend Sheet Tab focuses on detailed KPI-level analysis over time.
What Can You Do on the Trend Sheet?
- Select a KPI name from the dropdown on cell C3
View KPI metadata such as:
KPI Group
Unit of measurement
KPI type (Lower the Better or Upper the Better)
KPI formula
KPI definition
Visual Analysis
MTD trend chart for Actual, Target, and Previous Year
- YTD trend chart for Actual, Target, and Previous Year
As a result, clinics can identify patterns, seasonality, and long-term performance trends.
Click to buy Alternative Medicine KPI Dashboard in Excel
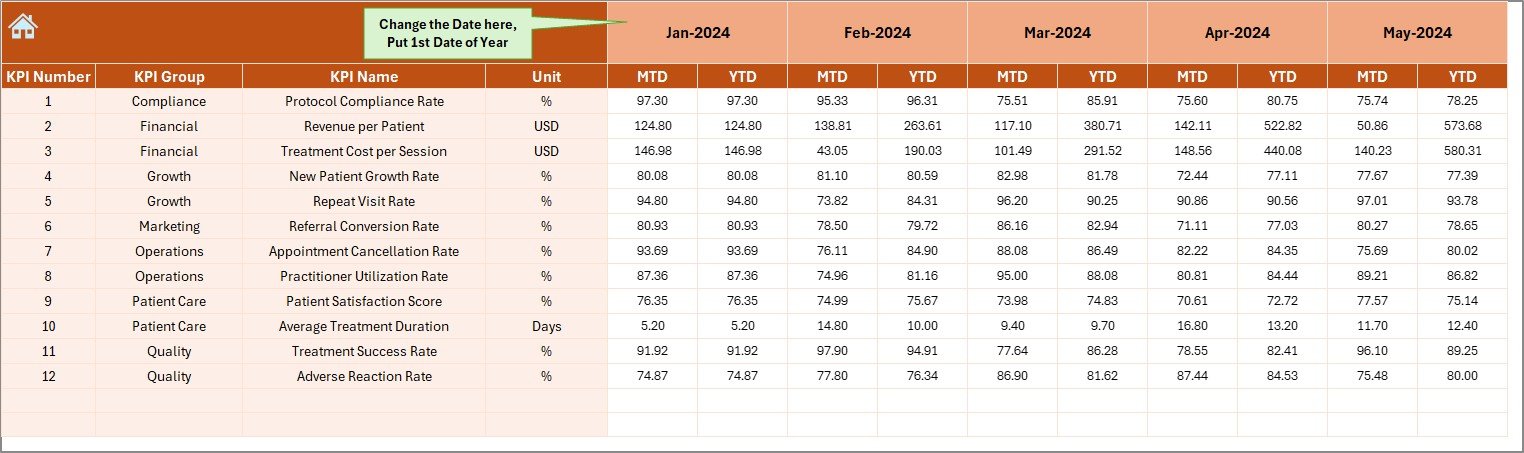
Actual Numbers
The Actual Numbers Input Sheet is where real performance data gets recorded.
Key Functionalities
- Enter actual MTD and YTD numbers for each KPI
- Month selection available in cell E1
- Users only need to input the first month of the year
- Dashboard automatically calculates cumulative values
This structure reduces manual errors and ensures consistent data entry.
Click to buy Alternative Medicine KPI Dashboard in Excel
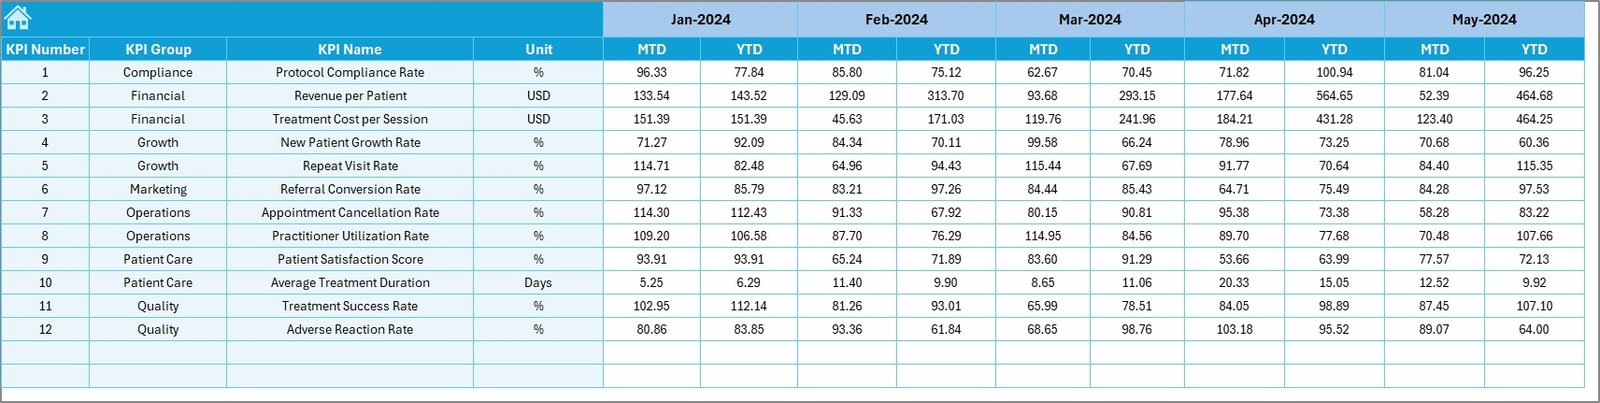
Target Sheet
The Target Sheet Tab defines expected performance benchmarks.
Why Targets Matter
Targets help clinics set realistic goals and measure progress accurately.
Target Sheet Features
- Enter MTD target values for each KPI
- Enter YTD target values for each KPI
- Supports monthly planning and annual goal tracking
When targets are clear, teams stay aligned and focused.
Click to buy Alternative Medicine KPI Dashboard in Excel
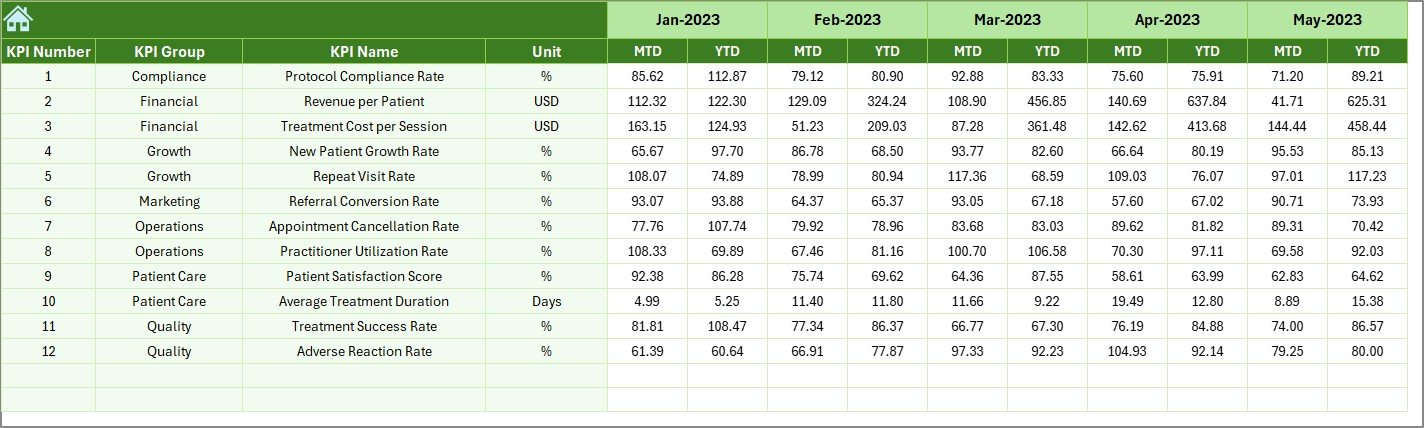
Previous Year
The Previous Year Number Sheet Tab enables year-over-year performance comparison.
Benefits of Previous Year Tracking
- Identifies growth or decline trends
- Helps evaluate long-term improvement
- Supports strategic planning and forecasting
Users enter data exactly like the current year, ensuring consistency.
Click to buy Alternative Medicine KPI Dashboard in Excel
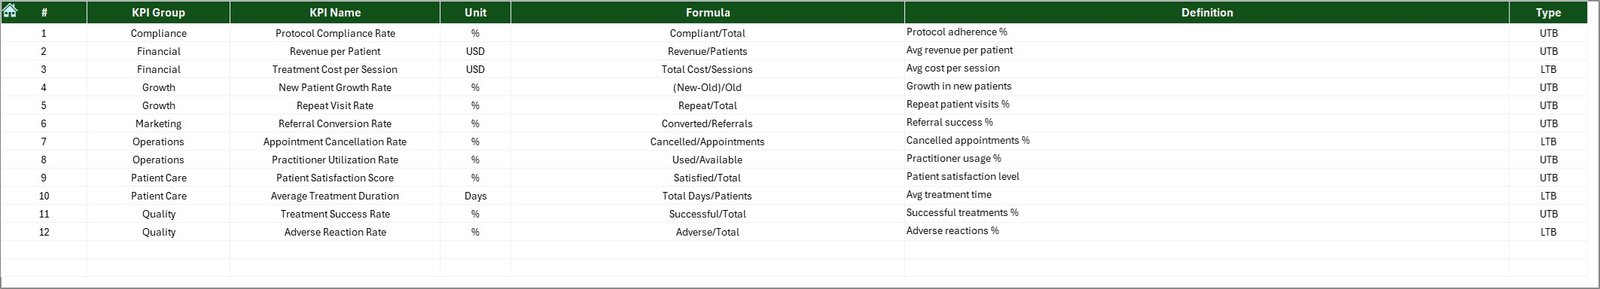
KPI Definition Sheet
The KPI Definition Sheet Tab acts as a KPI dictionary.
Details Captured in This Sheet
- KPI Name
- KPI Group
- Unit of measurement
- Formula
- KPI definition
This sheet ensures clarity and standardization, especially when multiple users access the dashboard.
Click to buy Alternative Medicine KPI Dashboard in Excel
Advantages of an Alternative Medicine KPI Dashboard in Excel
Using an Alternative Medicine KPI Dashboard in Excel offers multiple benefits for clinics and wellness centers.
Key Advantages
- Centralized performance tracking in one place
- Time-saving compared to manual reporting
- Clear target vs actual visibility
- Trend analysis for better forecasting
- Cost-effective compared to expensive BI tools
- Fully customizable based on clinic needs
- Easy to use without technical expertise
As a result, clinics make faster and more confident decisions.
Opportunities for Improvement Using This Dashboard
Even well-managed clinics can identify improvement areas using KPI insights.
Improvement Opportunities
- Identify underperforming treatments
- Reduce appointment cancellations
- Improve therapist utilization
- Optimize pricing strategies
- Enhance marketing effectiveness
- Improve patient satisfaction scores
When clinics act on these insights, growth becomes sustainable.
Best Practices for the Alternative Medicine KPI Dashboard in Excel
To get maximum value from this dashboard, clinics should follow proven best practices.
Best Practices
- Update actual data regularly
- Set realistic and measurable targets
- Review trends monthly, not yearly
- Use KPI definitions to avoid confusion
- Train staff on dashboard interpretation
- Back up the Excel file periodically
- Keep KPIs aligned with clinic goals
Following these practices ensures accurate insights and reliable decisions.
Who Can Benefit from an Alternative Medicine KPI Dashboard?
This dashboard suits a wide range of healthcare providers.
Ideal Users
- Alternative medicine clinics
- Ayurveda and Homeopathy centers
- Wellness and holistic health centers
- Yoga therapy institutes
- Naturopathy clinics
- Healthcare consultants and analysts
Therefore, any organization focused on alternative healthcare can benefit.
How Does This Dashboard Support Better Decision-Making?
This dashboard transforms raw data into actionable insights.
Decision-Making Benefits
- Managers understand performance gaps quickly
- Owners track profitability and growth clearly
- Therapists align efforts with clinic goals
- Marketing teams measure campaign impact
As a result, decisions rely on facts, not assumptions.
Conclusion: Why Should You Use an Alternative Medicine KPI Dashboard in Excel?
An Alternative Medicine KPI Dashboard in Excel is more than a reporting tool. Instead, it acts as a strategic partner for growth, efficiency, and quality improvement.
By combining structured data entry, automated calculations, and interactive visuals, this dashboard empowers clinics to track performance confidently. Moreover, its Excel-based design ensures flexibility, affordability, and ease of use.
If you want better visibility, stronger control, and smarter decisions for your alternative medicine practice, this KPI dashboard becomes an essential solution.
Frequently Asked Questions (FAQs)
- What is an Alternative Medicine KPI Dashboard in Excel used for?
It helps track, analyze, and visualize key performance indicators related to operations, finance, and patient outcomes in alternative medicine clinics.
- Do I need advanced Excel skills to use this dashboard?
No, the dashboard uses simple data entry, dropdowns, and automated calculations, making it easy for beginners.
- Can I customize KPIs in the dashboard?
Yes, you can add, remove, or modify KPIs using the KPI Definition Sheet.
- How often should I update the data?
You should update actual data monthly to ensure accurate insights and trend analysis.
- Is this dashboard suitable for small clinics?
Yes, it works well for both small clinics and large wellness centers.
- Can this dashboard replace BI tools?
While BI tools offer advanced features, this Excel dashboard provides a cost-effective and practical alternative for most clinics.
- Does the dashboard support year-over-year analysis?
Yes, it includes a dedicated Previous Year Number Sheet for YoY comparison.
Visit our YouTube channel to learn step-by-step video tutorials
Watch the step-by-step video tutorial:
Click to buy Alternative Medicine KPI Dashboard in Excel