In today’s highly competitive digital marketplace, simply launching an app is not enough. With millions of apps available across platforms like the Apple App Store and Google Play, standing out requires consistent tracking, optimization, and performance monitoring. This is where App Store Optimization (ASO) KPI Dashboards in Excel come into play.
A well-designed dashboard not only organizes your key metrics but also helps you identify opportunities to improve app visibility, downloads, and user engagement. In this article, we will explore everything you need to know about an App Store Optimization KPI Dashboard in Excel—from its features to its benefits, best practices, and frequently asked questions.
Click to buy App Store Optimization KPI Dashboard in Excel
What Is an App Store Optimization KPI Dashboard in Excel?
An App Store Optimization KPI Dashboard in Excel is a structured, ready-to-use tool designed to track all important ASO metrics in one place. It eliminates the hassle of working with scattered reports and raw data by consolidating everything into a visual, interactive, and user-friendly format.
Instead of jumping between multiple tools and spreadsheets, you get a single dashboard that shows:
- Key metrics like downloads, impressions, ratings, and revenue.
- Comparison of actual vs. target performance.
- Trends over months and years.
- Areas where your app is underperforming or excelling.
With this Excel-based dashboard, businesses, developers, and marketers can make data-driven decisions that directly impact app growth and visibility.
Key Features of the App Store Optimization KPI Dashboard in Excel
This dashboard comes with 7 carefully structured worksheets, each serving a specific purpose:
Home Sheet
- Acts as the index page of the dashboard.
- Includes 6 navigation buttons that let you jump directly to different sheets.
- Provides a clean entry point for new users.
- Click to buy App Store Optimization KPI Dashboard in Excel
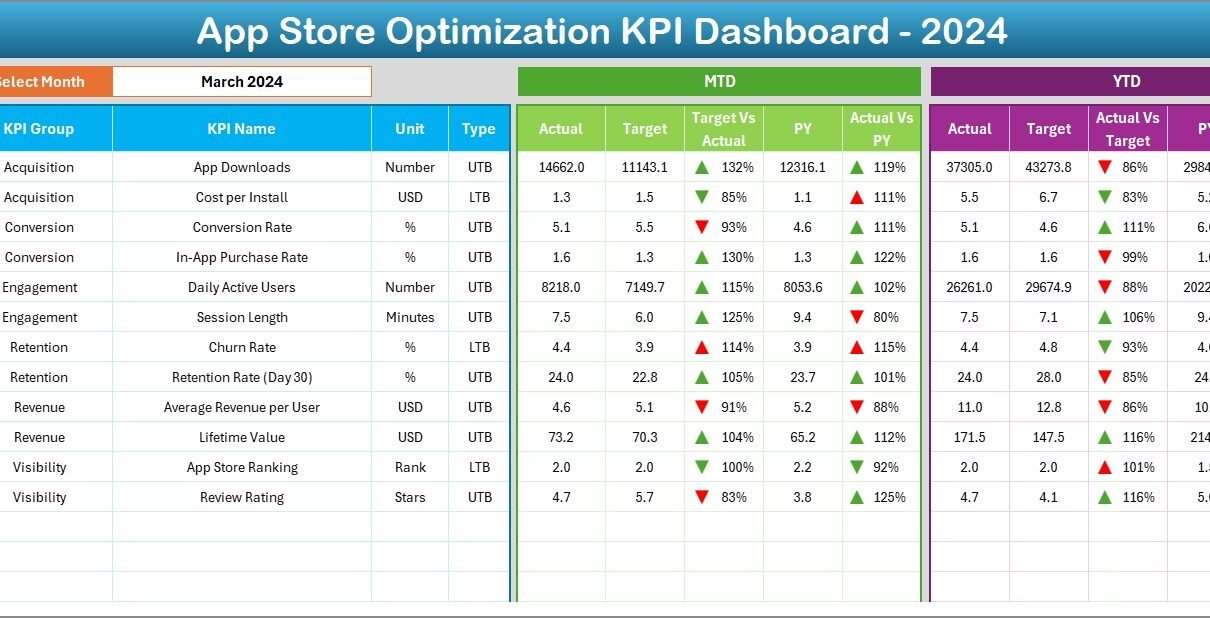
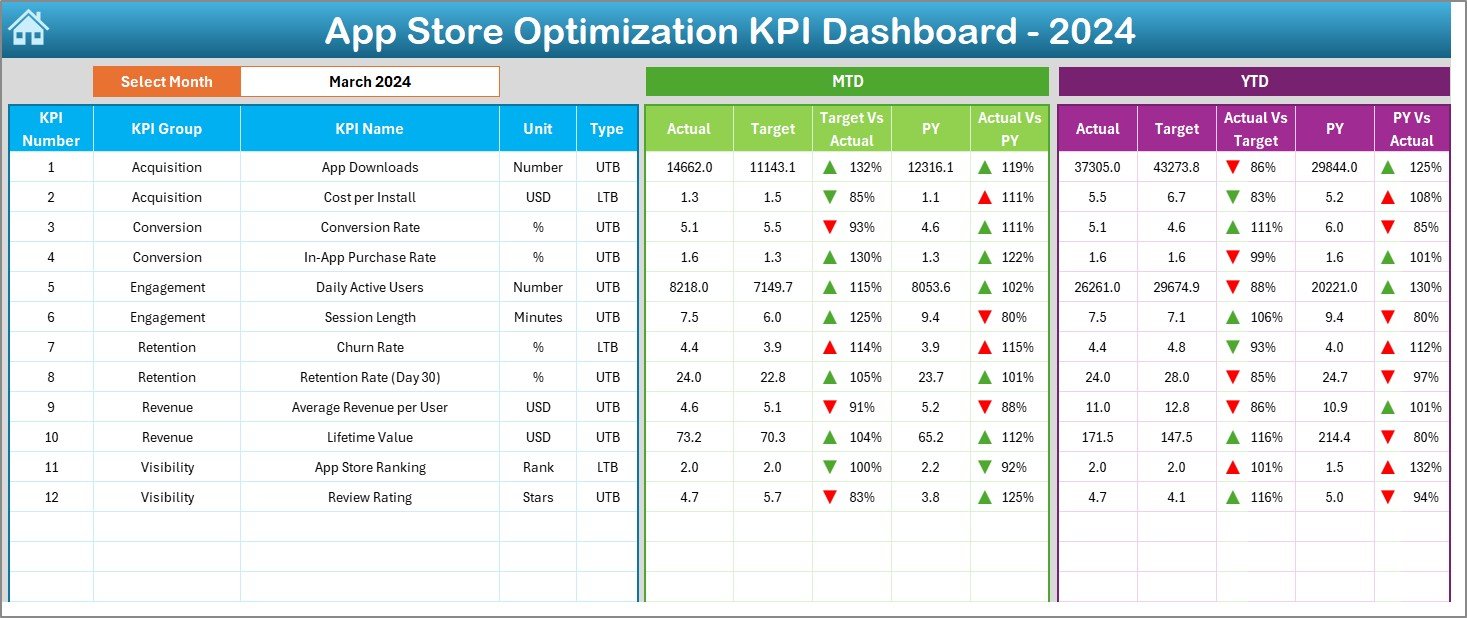
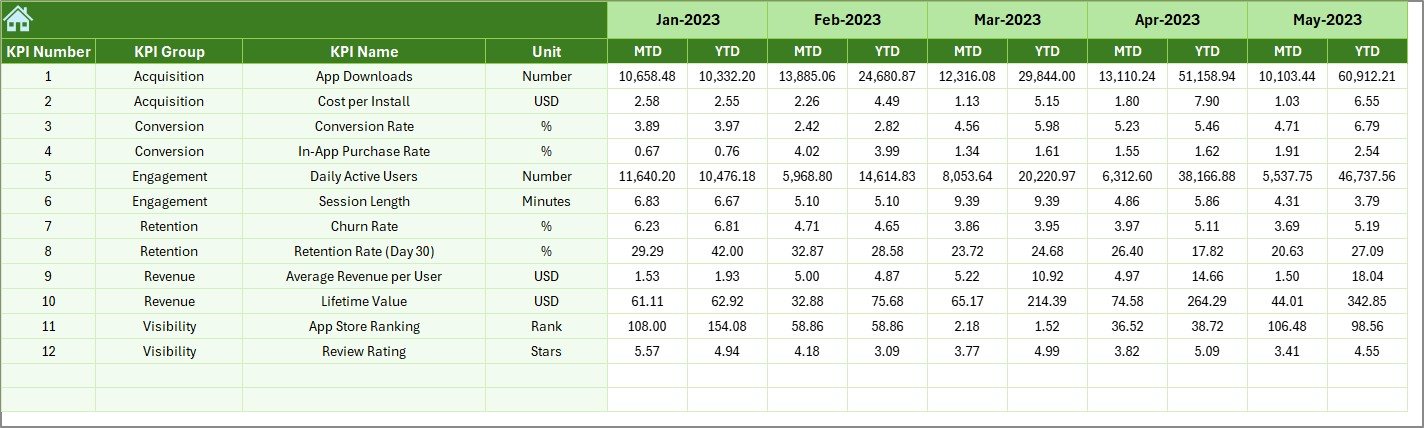
Dashboard Sheet
- The central hub where all KPIs are displayed.
- Users can select a month from a drop-down menu in cell D3, and the entire dashboard updates automatically.
- Displays Month-to-Date (MTD) and Year-to-Date (YTD) metrics.
- Shows comparisons of Actual vs. Target and Actual vs. Previous Year (PY).
- Includes conditional formatting with arrows to instantly show performance trends.
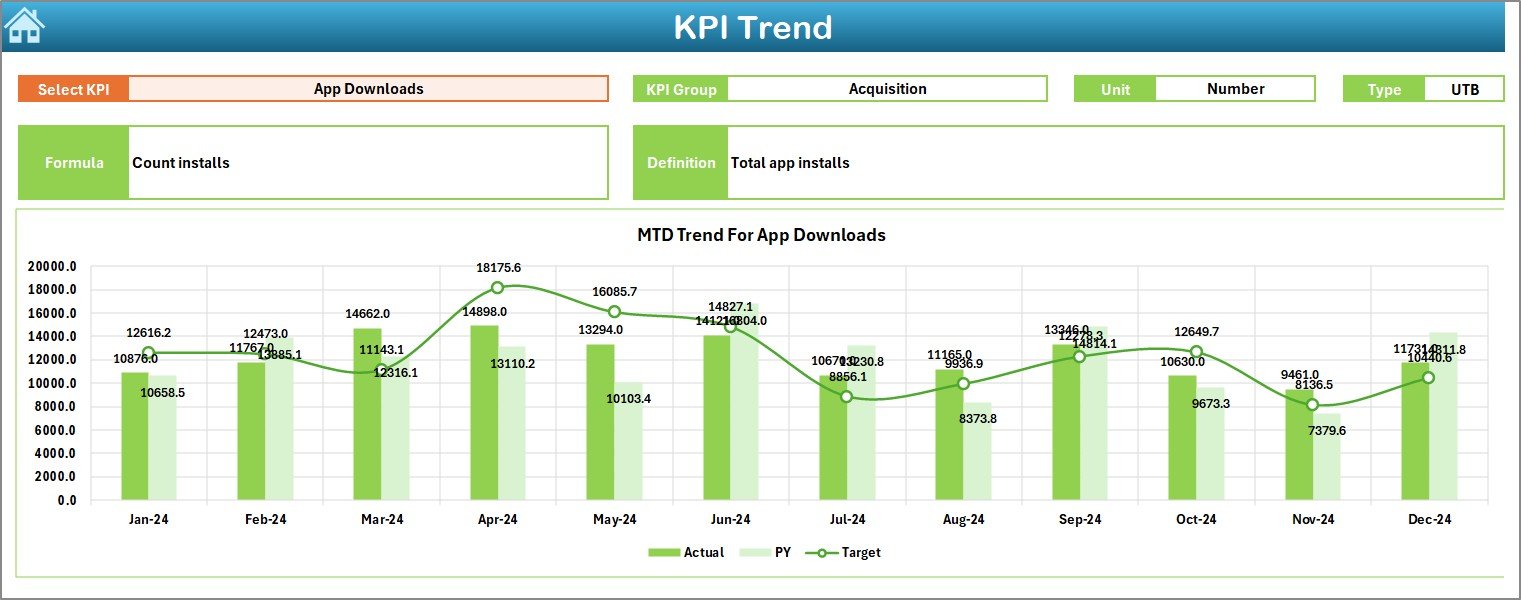
KPI Trend Sheet
- Allows you to select a specific KPI from a drop-down list (cell C3).
- Displays KPI details such as Group, Unit, Type (UTB or LTB), Formula, and Definition.
- Provides dynamic MTD and YTD trend charts for Actual, Target, and PY numbers.
Click to buy App Store Optimization KPI Dashboard in Excel
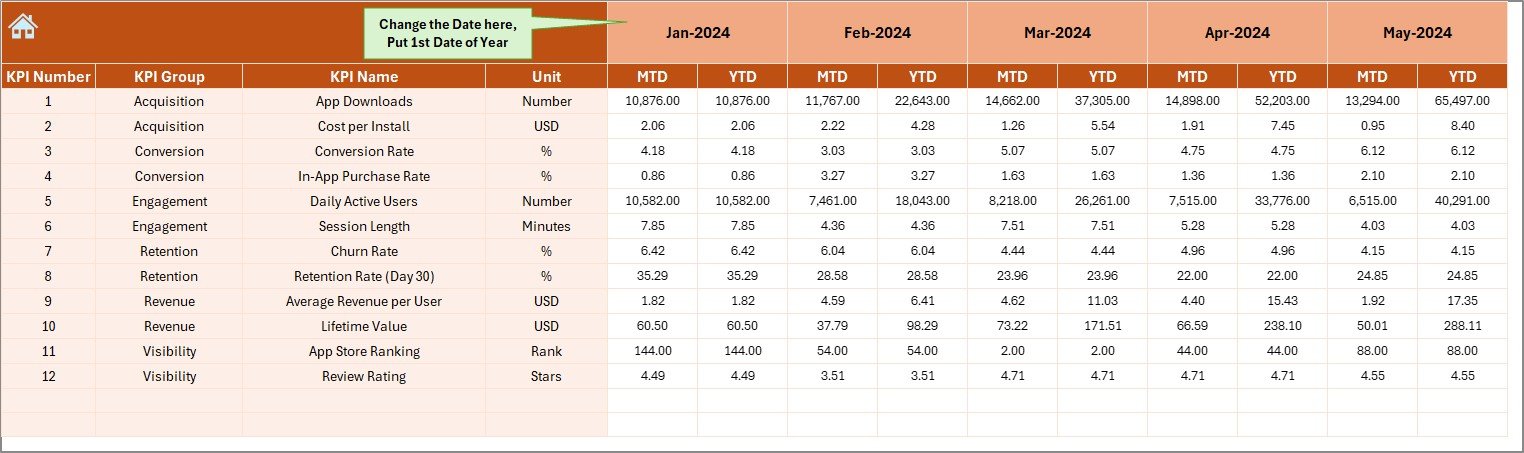
Actual Numbers Input Sheet
- A user-friendly sheet where you can input actual KPI numbers for each month.
- You can select the first month of the year (cell E1), making it adaptable for different fiscal years.
Click to buy App Store Optimization KPI Dashboard in Excel
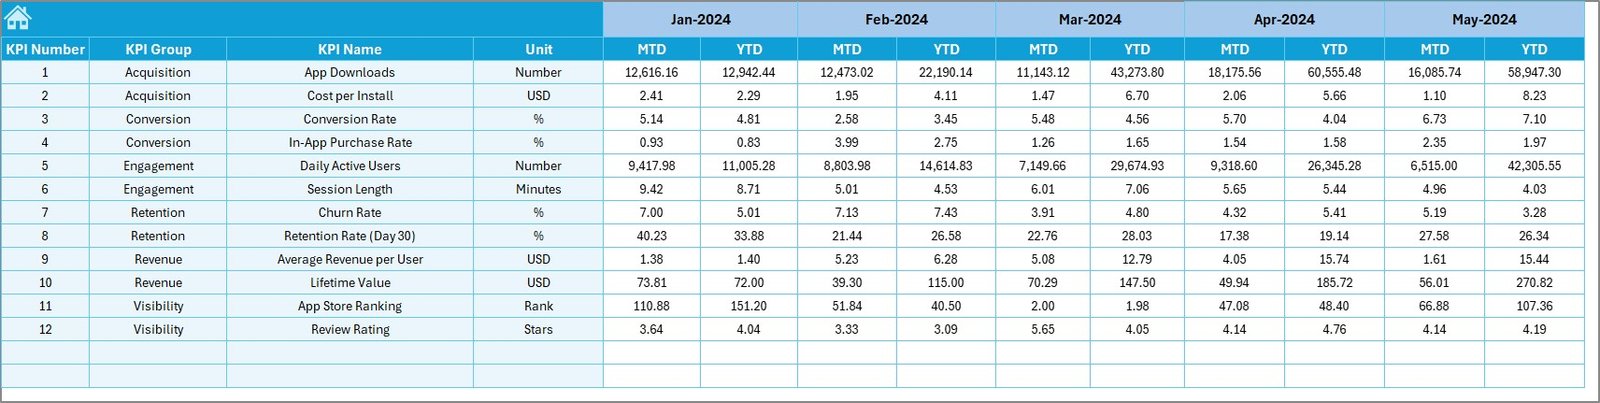
Target Sheet
- A dedicated space to input target numbers for each KPI.
- Captures both MTD and YTD targets.\
Previous Year Numbers Sheet
- Helps you record data from the previous year for easy comparison.
- Ensures that year-on-year analysis is seamless.
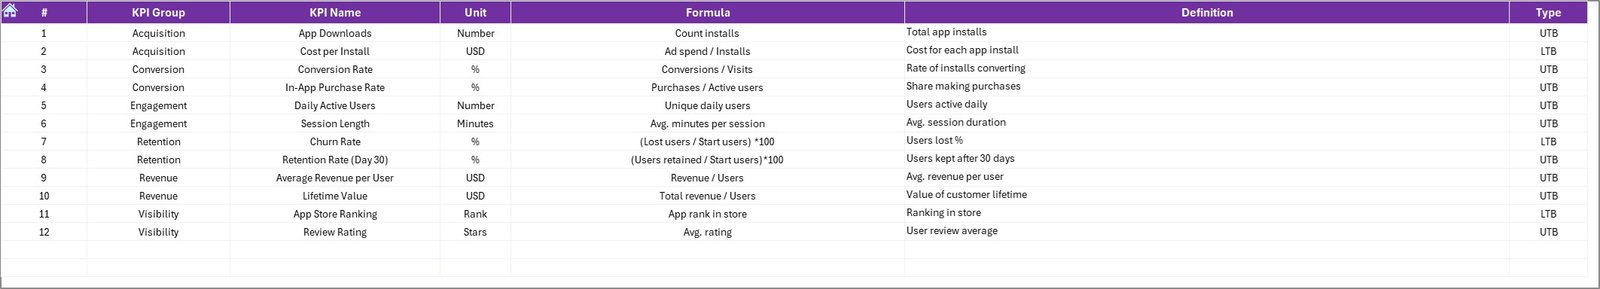
KPI Definition Sheet
- Stores definitions of each KPI, including Name, Group, Unit, Formula, and Description.
- Ensures clarity for every user who accesses the dashboard.
Why Do You Need an ASO KPI Dashboard in Excel?
App performance is influenced by many moving parts. Without a structured dashboard, it’s easy to miss critical insights. Here’s why this Excel-based solution is essential:
- Centralized Data → Brings all KPIs into one location.
- Better Decision Making → Makes performance gaps visible instantly.
- Time Saving → Reduces manual effort in compiling reports.
- Customizable → You can tailor it for your business needs.
- Excel Friendly → No expensive software required—works directly in Excel.
Advantages of an App Store Optimization KPI Dashboard
Let’s break down the major benefits:
- Clear Visualization → Understand trends and gaps with charts, arrows, and color codes.
- Time Efficiency → Automates data comparison across months and years.
- Goal Alignment → Track actual vs. target performance effortlessly.
- Better Insights → Spot underperforming KPIs and make corrective actions.
- Comparative Analysis → Evaluate current performance against the previous year.
- Easy Customization → Add or remove KPIs as per your app’s unique strategy.
- Collaboration → Share with your team for collective tracking and planning.
Which KPIs Should You Track in an App Store Optimization Dashboard?
For effective ASO, you need to track both performance-driven and user-centric KPIs. Some examples include:
- Impressions → Number of times your app appeared in search results.
- App Downloads → Total installs within a given timeframe.
- Conversion Rate → Downloads ÷ Impressions.
- App Ratings → Average star rating.
- App Reviews → Total reviews submitted by users.
- Active Users → Daily or monthly active users.
- Uninstall Rate → Percentage of users uninstalling the app.
- Revenue Generated → In-app purchases or subscriptions.
- Keyword Rankings → Position of targeted keywords in app store search.
How to Use the App Store Optimization KPI Dashboard in Excel
Follow these steps to make the most of this dashboard:
- Set Up Your KPI Definitions → Use the KPI Definition Sheet to document the KPIs.
- Enter Targets → Fill the target sheet with your monthly and yearly goals.
- Input Actual Data → Regularly update the actual numbers in the designated sheet.
- Compare Against Previous Year → Use the PY sheet to spot long-term trends.
- Analyze Trends → Switch between KPIs and months to identify growth or decline.
- Make Adjustments → Use insights to refine your ASO strategy, such as updating app descriptions, screenshots, or ad campaigns.
Best Practices for the App Store Optimization KPI Dashboard
To maximize results, follow these best practices:
- Update Data Regularly → Keep your actual numbers current for accuracy.
- Focus on Actionable KPIs → Track only metrics that influence your goals.
- Use Visual Cues → Leverage conditional formatting for quick analysis.
- Compare Across Years → Use PY data for long-term benchmarking.
- Set Realistic Targets → Align targets with market research and historical performance.
- Keep It Simple → Avoid overloading the dashboard with unnecessary data.
Common Mistakes to Avoid
- Tracking Too Many KPIs → Focus on quality, not quantity.
- Ignoring User Feedback → Ratings and reviews are as important as downloads.
- Not Updating PY Data → Year-on-year tracking is critical for ASO success.
- Failing to Customize → Every app is unique—adapt the dashboard accordingly.
- Overcomplicating Charts → Stick to clear, actionable visuals.
Opportunities for Improvement in ASO Tracking
- Automate Data Collection → Integrate app store APIs with Excel for real-time updates.
- Add More KPIs → Include retention rates, acquisition costs, or referral metrics.
- Segment Analysis → Track performance by geography, platform, or campaign.
- Visual Enhancements → Use dashboards with slicers and pivot charts for better filtering.
Conclusion
An App Store Optimization KPI Dashboard in Excel is not just a tracking tool—it’s a growth accelerator. By consolidating all important KPIs into one visual, interactive system, it empowers businesses to measure progress, compare trends, and take corrective action. Whether you are an indie developer or a large organization, this Excel-based solution offers simplicity, flexibility, and actionable insights without the need for expensive software.
When you align your ASO strategy with the right KPIs and follow best practices, your app stands a far greater chance of achieving higher visibility, stronger engagement, and consistent growth.
Frequently Asked Questions (FAQs)
- What is an ASO KPI Dashboard?
An ASO KPI Dashboard is a tool used to track, analyze, and visualize app store performance metrics like downloads, ratings, and conversions.
- Why should I use Excel for ASO tracking?
Excel is cost-effective, widely accessible, and highly customizable, making it a great platform for KPI dashboards.
- How often should I update the dashboard?
You should update it at least monthly, though weekly updates provide better real-time insights.
- Which KPIs are most important for ASO?
The most critical KPIs include downloads, impressions, conversion rate, ratings, reviews, uninstall rate, and keyword rankings.
- Can I customize the KPIs in this dashboard?
Yes, the dashboard is fully customizable. You can add, remove, or modify KPIs based on your app strategy.
- How does year-on-year comparison help?
It helps you identify long-term growth patterns and measure the impact of optimization strategies over time.
- Is this dashboard useful for small developers?
Absolutely! It helps indie developers track progress and make data-driven decisions without investing in expensive software.
Visit our YouTube channel to learn step-by-step video tutorials
Watch the step-by-step video tutorial:
Click to buy App Store Optimization KPI Dashboard in Excel