In today’s dynamic business environment, organizations face increasing pressure to maintain robust internal controls and ensure compliance with regulatory requirements. Monitoring and managing these controls efficiently is critical for risk management, operational excellence, and informed decision-making. This is where the Audit & Internal Controls KPI Dashboard in Power BI plays a vital role.
This article provides a detailed guide on the dashboard, its features, benefits, best practices, and practical tips for implementation.
Click to buy Audit & Internal Controls KPI Dashboard in Power BI
What is an Audit & Internal Controls KPI Dashboard?
An Audit & Internal Controls KPI Dashboard is a digital tool that tracks, visualizes, and analyzes key performance indicators (KPIs) related to audits and internal controls. It helps organizations monitor the efficiency of internal processes, identify areas of risk, and measure compliance with policies and standards.
With Power BI, these dashboards offer real-time insights, intuitive visualizations, and easy access to historical data, enabling audit teams and management to make data-driven decisions.
Key Features of the Audit & Internal Controls KPI Dashboard in Power BI
The Audit & Internal Controls KPI Dashboard is designed to provide a comprehensive view of audit performance and internal control effectiveness. Here are the main features:
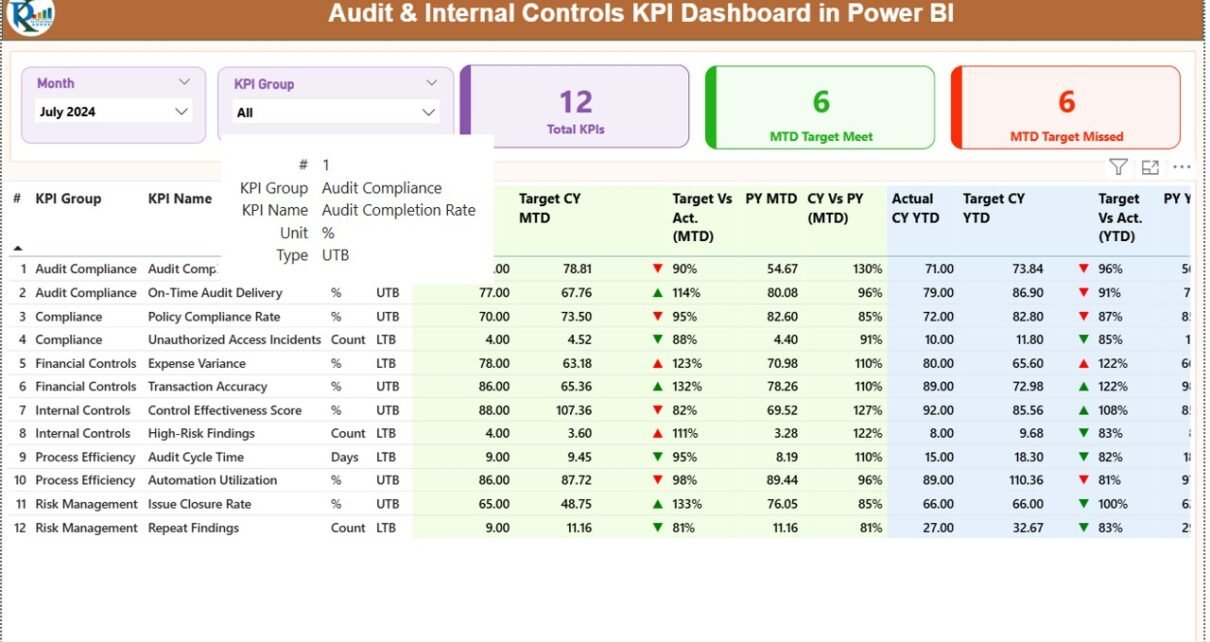
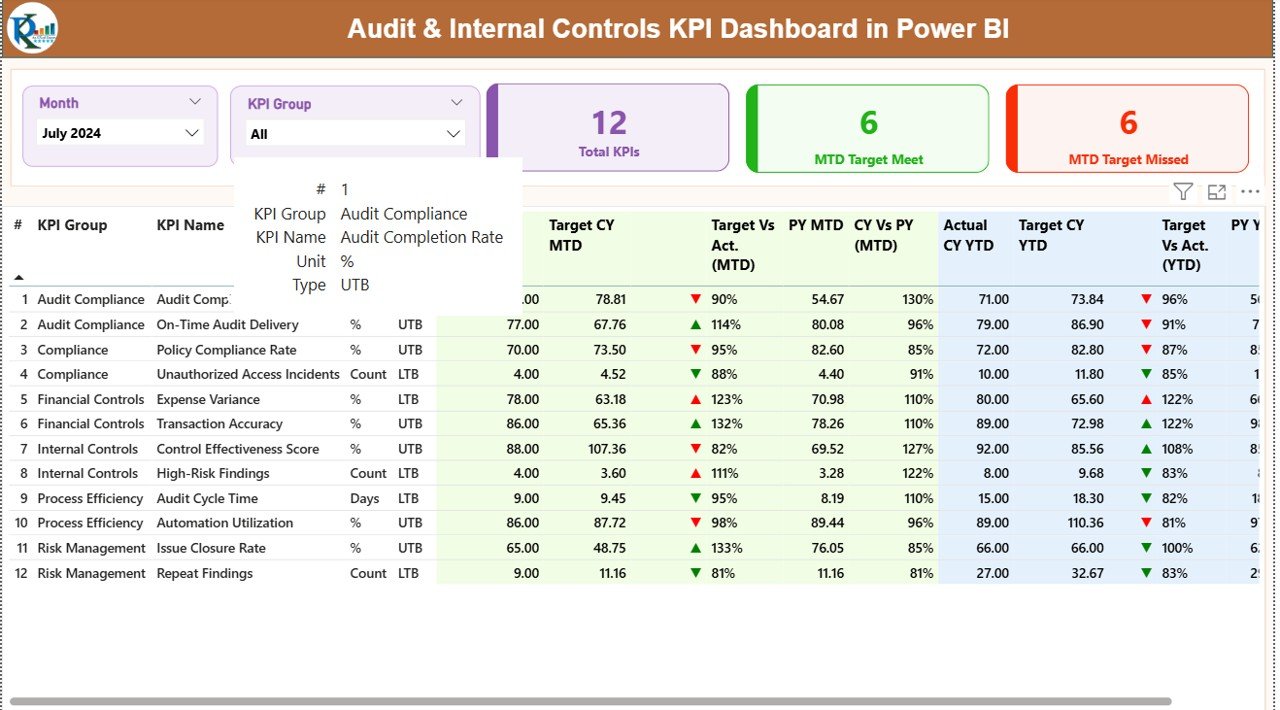
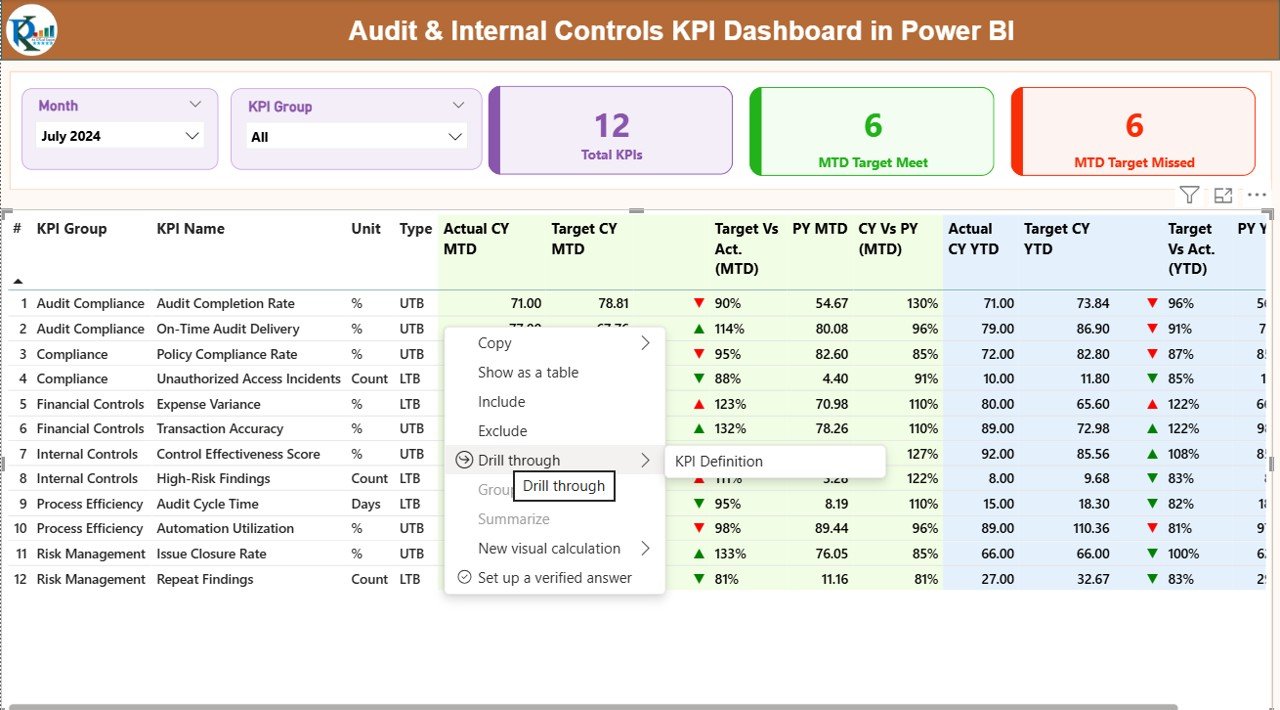
Summary Page
The Summary Page serves as the central hub of the dashboard. Key features include:
- Month and KPI Group Slicers: Filter KPIs by month or category.
- KPI Cards: Display three key metrics:
- Total KPIs count
- MTD Target Met count
- MTD Target Missed count
- Detailed KPI Table: Includes the following data:
- KPI Number: Sequence number of each KPI.
- KPI Group: Category of KPI.
- KPI Name: Name of KPI.
- Unit: Measurement unit of KPI.
- Type: LTB (Lower the Better) or UTB (Upper the Better).
- Actual CY MTD: Actual value for current month-to-date.
- Target CY MTD: Target value for current month-to-date.
- MTD Icon: Visual indicator (▲/▼) showing performance against target.
- Target vs Actual (MTD): Percentage comparison (Actual ÷ Target).
- PY MTD: Previous year month-to-date value.
- CY vs PY (MTD): Comparison with previous year (Current ÷ PY).
- Actual CY YTD: Year-to-date actual value.
- Target CY YTD: Year-to-date target.
- YTD Icon: Performance indicator for YTD numbers.
- Target vs Actual (YTD): Percentage comparison for YTD.
- PY YTD: Previous year YTD value.
- CY vs PY (YTD): Current year vs previous year YTD comparison.
This summary provides a quick snapshot of audit performance and internal control effectiveness, allowing management to identify trends and gaps immediately.
Click to buy Audit & Internal Controls KPI Dashboard in Power BI
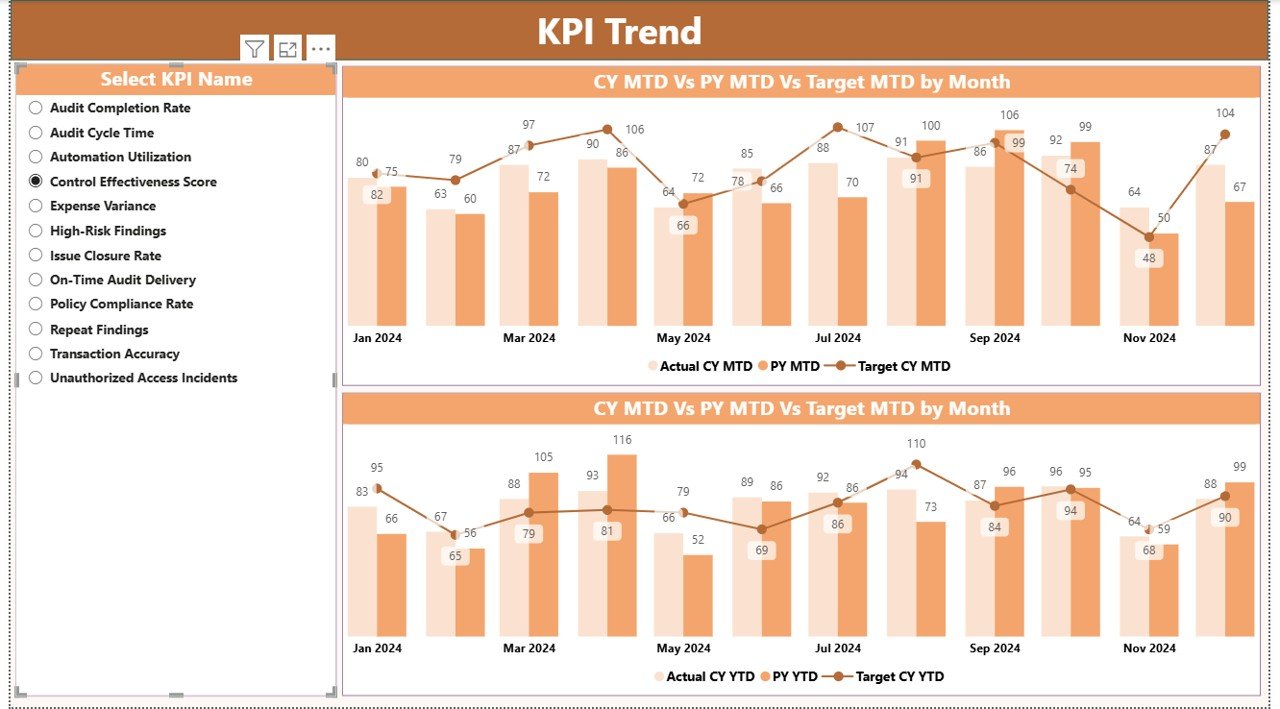
KPI Trend Page
The KPI Trend Page focuses on visual analysis:
- Combo Charts: Show actual numbers for the current year, previous year, and targets for both MTD and YTD.
- KPI Name Slicer: Filter trend charts by specific KPIs.
This page helps organizations identify trends over time, enabling better planning, forecasting, and proactive control measures.
Click to buy Audit & Internal Controls KPI Dashboard in Power BI
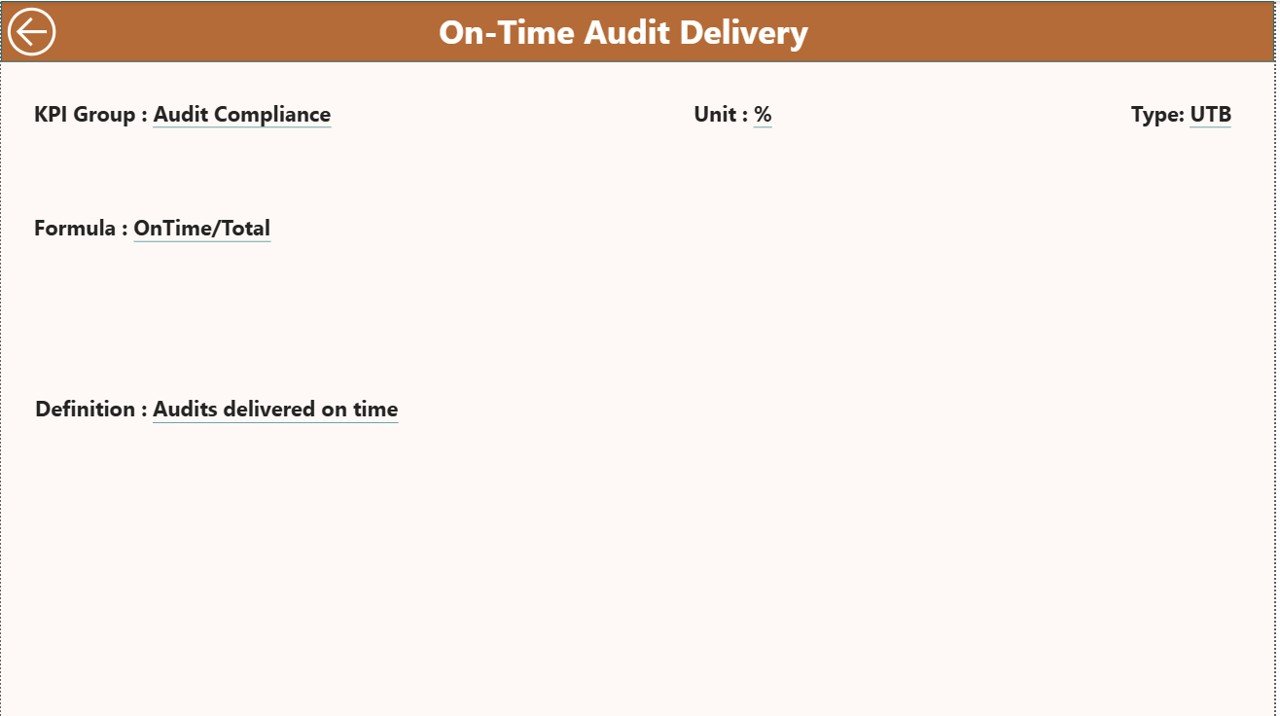
KPI Definition Page
The KPI Definition Page is a drill-through page, typically hidden, and contains detailed definitions and formulas for each KPI:
- KPI Number
- KPI Group
- KPI Name
- Unit
- Formula
- Definition
- Type (LTB or UTB)
This page ensures consistency in KPI calculation and interpretation across teams.
Click to buy Audit & Internal Controls KPI Dashboard in Power BI
How to Use the Audit & Internal Controls KPI Dashboard
The dashboard is Excel-driven, making it easy to input and update data. Here’s how to use it:
Excel Data Source
The dashboard relies on an Excel workbook with three sheets:
- Input_Actual Sheet: Enter actual KPI numbers, month (first date of the month), MTD, and YTD values.
- Input_Target Sheet: Enter target KPI numbers, month (first date of the month), MTD, and YTD values.
- KPI Definition Sheet: Enter KPI number, group, name, unit, formula, definition, and type (LTB or UTB).
Once the Excel file is updated, Power BI refreshes automatically, providing real-time insights.
Click to buy Audit & Internal Controls KPI Dashboard in Power BI
Advantages of Using an Audit & Internal Controls KPI Dashboard
Implementing this dashboard offers several benefits:
- Improved Audit Efficiency: Provides auditors with a centralized view of all KPIs.
- Real-Time Insights: Track compliance and control effectiveness as soon as data is updated.
- Enhanced Decision-Making: Management can make informed decisions based on accurate, up-to-date data.
- Trend Analysis: Monitor KPI trends and identify areas needing immediate attention.
- Increased Accountability: KPI tracking ensures each department and team takes ownership of performance.
- Simplified Reporting: Replace manual spreadsheets with automated, visually appealing reports.
Best Practices for Using the Audit & Internal Controls KPI Dashboard
To get the most from your dashboard, follow these best practices:
- Define KPIs Clearly: Use the KPI Definition page to ensure everyone understands each metric.
- Regularly Update Data: Update Excel sheets monthly to keep dashboards current.
- Use Drill-Through Effectively: Explore detailed data when necessary for root cause analysis.
- Monitor Trends: Look beyond monthly results and focus on long-term patterns.
- Set Realistic Targets: Avoid setting targets too high or too low; ensure they align with organizational goals.
- Integrate Alerts: Use Power BI notifications for KPIs falling short of targets.
- Train Staff: Ensure auditors and managers can navigate dashboards efficiently.
- Visualize Effectively: Use colors, icons, and charts to highlight performance clearly.
Why Power BI is Ideal for Audit & Internal Controls Dashboards
Power BI offers unique advantages for audit dashboards:
- Interactive Visualizations: Dynamic charts and tables make analysis intuitive.
- Data Connectivity: Connect to Excel, SQL, ERP, and other systems.
- Automation: Refresh dashboards automatically when data updates.
- Customization: Tailor dashboards to show the most relevant KPIs.
- Collaboration: Share dashboards with stakeholders for real-time collaboration.
Step-by-Step Guide to Implementing the Dashboard
Step 1: Collect KPI Data
- Gather data for all KPIs across departments.
- Use historical data for trend analysis.
Step 2: Input Data into Excel
- Fill Actual, Target, and KPI Definition sheets.
Step 3: Load Data into Power BI
- Connect Excel file as a data source.
- Verify all fields match dashboard requirements.
Step 4: Configure Summary Page
- Add slicers for month and KPI group.
- Insert KPI cards and detailed KPI table.
Step 5: Configure KPI Trend Page
- Create combo charts to compare current and previous year metrics.
- Add slicers for KPI selection.
Step 6: Drill Through KPI Definition Page
- Configure drill-through functionality.
- Ensure back button navigates correctly to the Summary page.
Step 7: Validate Dashboard
- Cross-check KPIs for accuracy.
- Ensure MTD/YTD calculations are correct.
Step 8: Share Dashboard
- Publish to Power BI service.
- Set refresh schedules and permissions for stakeholders.
Common KPIs to Track in Audit & Internal Controls Dashboard
Some important KPIs include:
- Number of Completed Audits: Total audits completed in a period.
- Audit Findings Closure Rate: Percentage of findings resolved on time.
- Control Effectiveness Score: Measure of internal control efficiency.
- Compliance Rate: Percentage adherence to policies and regulations.
- High-Risk Issues Identified: Count of critical issues flagged.
- Target vs Actual Performance: Comparison of KPIs to planned targets.
Tracking these KPIs helps management focus on high-impact areas and improve governance.
Benefits for Different Stakeholders
- Audit Teams: Streamlines audit planning and execution.
- Management: Provides actionable insights for risk management.
- Compliance Officers: Monitors regulatory adherence effectively.
- Board of Directors: Offers transparency on audit outcomes and control performance.
Tips to Maximize the Dashboard’s Effectiveness
- Automate Data Entry: Reduce manual errors by connecting source systems directly.
- Segment KPIs: Group KPIs by department, process, or risk level.
- Highlight Exceptions: Use red/green icons to focus on deviations quickly.
- Review Monthly: Regularly review dashboards for continuous improvement.
- Engage Stakeholders: Conduct dashboard review meetings to ensure alignment.
Challenges to Be Aware Of
While dashboards are powerful, organizations may face:
- Data Quality Issues: Ensure clean, accurate, and timely data.
- Overcomplication: Avoid too many KPIs that dilute focus.
- Lack of Training: Staff must understand how to use and interpret dashboards.
- Resistance to Change: Encourage a data-driven culture to overcome hesitancy.
Conclusion
The Audit & Internal Controls KPI Dashboard in Power BI is an essential tool for modern organizations seeking to strengthen internal controls, improve audit efficiency, and ensure compliance. With real-time insights, interactive visualizations, and easy data management, organizations can track performance effectively, make informed decisions, and enhance governance. By implementing best practices, organizations can maximize the dashboard’s value and drive continuous improvement in audit and internal control processes.
Frequently Asked Questions (FAQs)
Q1. What is the main purpose of an Audit & Internal Controls KPI Dashboard?
The dashboard helps monitor audit performance, internal control effectiveness, and compliance with policies in real-time.
Q2. Which KPIs are most important to track?
Key KPIs include completed audits, audit findings closure rate, compliance rate, control effectiveness score, and high-risk issues identified.
Q3. How often should the dashboard data be updated?
Update data at least monthly to ensure accuracy for MTD and YTD analysis.
Q4. Can Power BI dashboards be shared with management?
Yes, Power BI allows dashboards to be shared with stakeholders securely and enables collaboration.
Q5. How do I ensure KPI accuracy in the dashboard?
Maintain clean and validated data in Excel sheets and cross-check calculations before publishing.
Q6. What are LTB and UTB in KPIs?
LTB (Lower the Better) indicates that a lower value is desirable, while UTB (Upper the Better) indicates that a higher value is preferred.
Q7. Can the dashboard show historical trends?
Yes, the KPI Trend Page in Power BI visualizes both current and previous year data for MTD and YTD.
Visit our YouTube channel to learn step-by-step video tutorials
Watch the step-by-step video tutorial:
Click to buy Audit & Internal Controls KPI Dashboard in Power BI

