Managing a budget becomes challenging when expenses increase, departments grow, or projects expand. Teams often struggle to track spending, compare budgeted amounts with actual costs, and estimate future financial needs. Because of this, organizations need a clear and simple way to monitor expenses and forecast future numbers. A Budget Forecasting Dashboard in Excel solves this problem with an organized and visual approach.
In this article, you will explore everything about this dashboard, how it works, why it is useful, and how it helps managers make better financial decisions. You will also understand each sheet tab, chart, and metric used in the dashboard. As you move forward, you will learn the advantages, best practices, and frequently asked questions for Budget Forecasting in Excel.
Click to buy Budget Forecasting Dashboard in Excel
What Is a Budget Forecasting Dashboard in Excel?
A Budget Forecasting Dashboard in Excel is a ready-to-use financial tool that helps teams track their budget, forecast spending, and compare actual results with planned numbers. It works as a central system that shows important figures in one place. You can see total cost, budget amount, forecast amount, actual amount, and variance values. The dashboard uses charts, visuals, slicers, and summary cards to simplify complex financial information.
You can view spending trends, identify over-budget areas, and monitor department-wise performance. The dashboard becomes useful for finance teams, project managers, HR departments, marketing units, and business owners who want to manage their financial plans efficiently.
Excel makes this dashboard powerful because it allows formulas, filters, tables, conditional formatting, and charts that refresh automatically.
Why Do You Need a Budget Forecasting Dashboard in Excel?
Budget forecasting becomes difficult when it is done manually. Teams must compare planned spending, track real expenses, and update future expectations. This becomes time-consuming and prone to mistakes.
A Budget Forecasting Dashboard gives a structured system. It shows:
- Where the company is spending money
- How much budget remains
- Which department performs well
- Which category crosses limits
- What the trend looks like for the next months
This dashboard transforms raw financial data into clear insights. As a result, companies save time, reduce errors, and make fast decisions.
Overview of the Budget Forecasting Dashboard in Excel
The dashboard includes multiple sheet tabs, each designed to give specific insights. Below is the detailed breakdown of every page.
Overview Sheet Tab
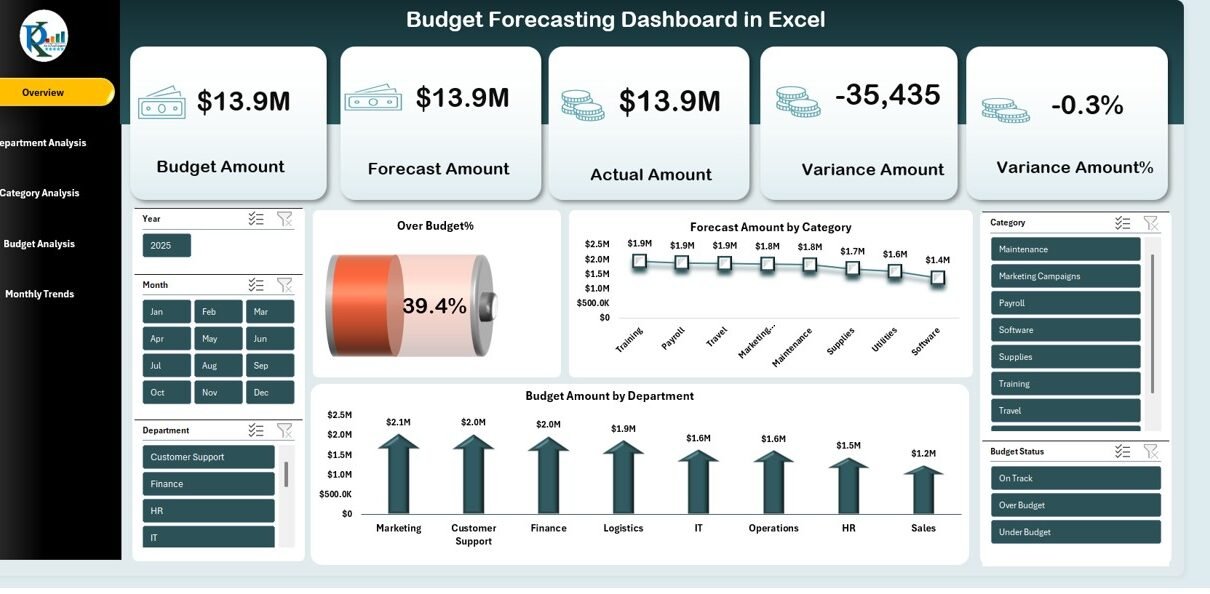
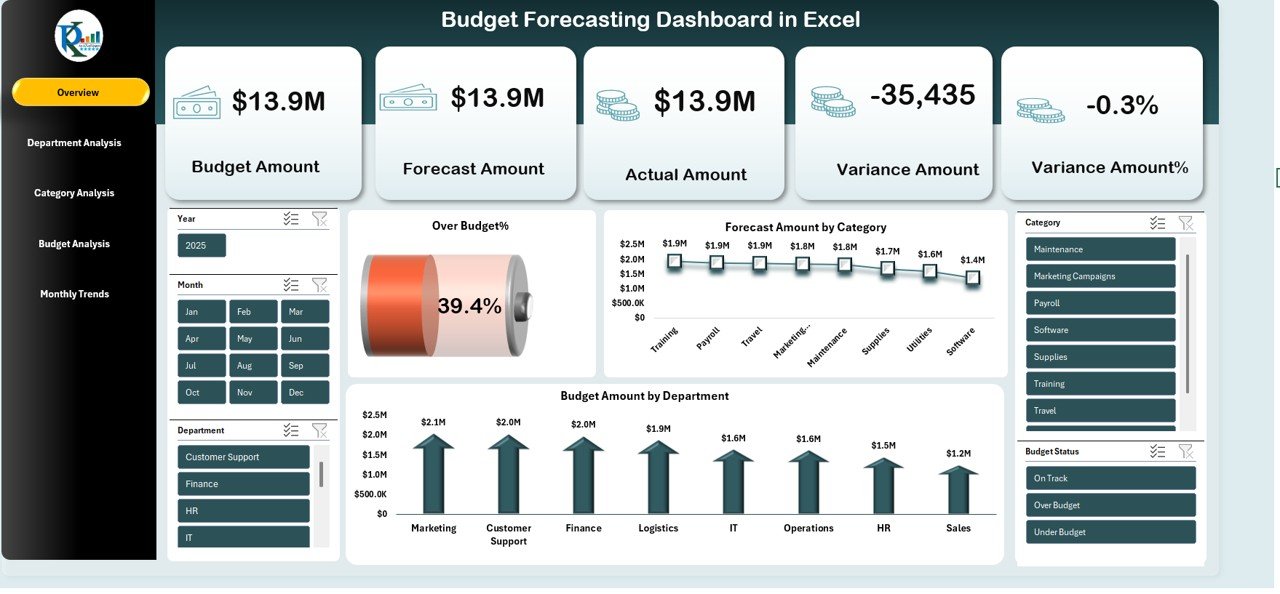
The Overview Sheet works as the main page of the dashboard. It displays key numbers and visuals that offer a complete picture of the financial status. Users can analyze budget utilization, forecast comparisons, and variance summaries.
Key Metrics Displayed
- Total Cost
- Budget Amount
- Forecast Amount
- Actual Amount
- Variance Amount %
- Over Budget %
These values show the company’s financial health in real-time.
Charts Displayed
- Forecast Amount by Category
This explains which category will have high or low future expenses. - Budget Amount by Department
This chart helps compare the budget distribution among departments.
Click to buy Budget Forecasting Dashboard in Excel
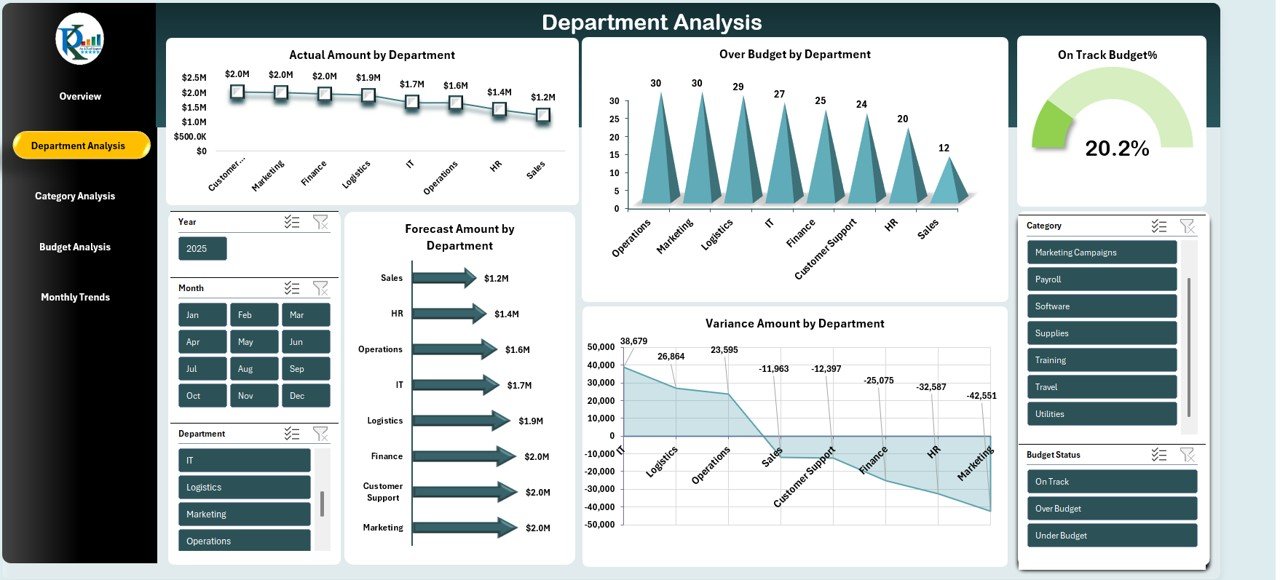
Department Analysis Sheet Tab
The Department Analysis page shows complete financial details at the department level. You can evaluate how each department spends money and whether it stays within the planned budget.
Metrics and Charts
- Actual Amount by Department
Shows real expenses and helps identify which departments overspend. - Forecast Amount by Department
Displays estimated spending for coming months. - Over Budget by Department
Highlights departments that cross the allocated budget. - Variance Amount by Department
Shows the difference between budgeted and actual numbers.
This sheet helps management take timely action.
Click to buy Budget Forecasting Dashboard in Excel
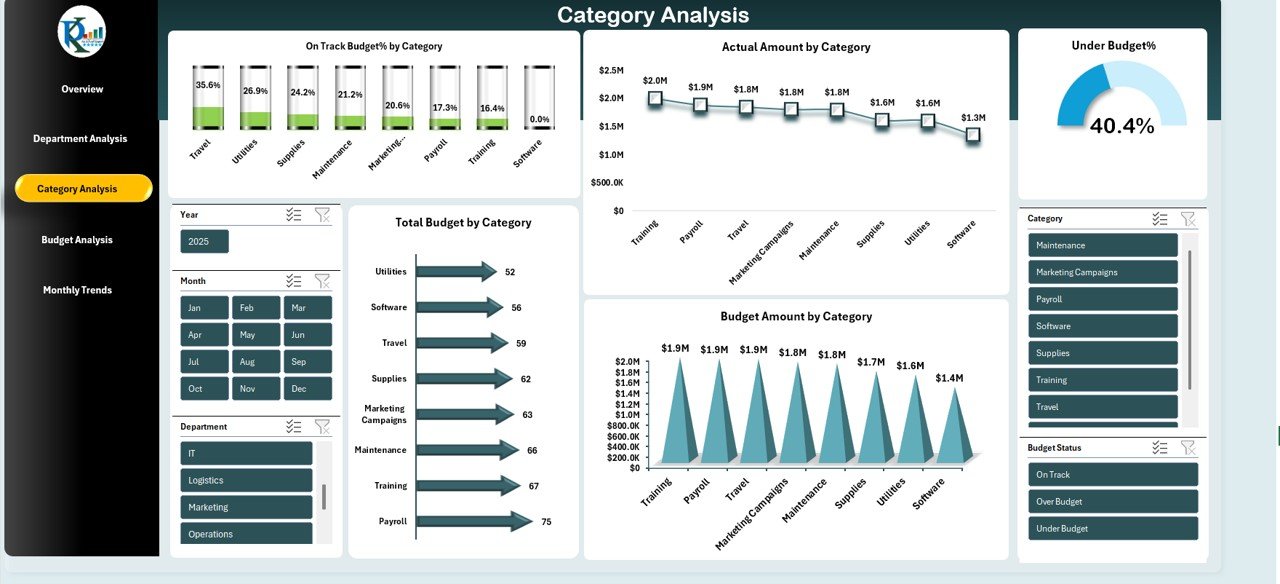
Category Analysis Sheet Tab
The Category Analysis tab displays financial insights based on categories like travel, payroll, marketing, utilities, equipment, and more.
Charts and Metrics
- On Track Budget % by Category
Shows the categories that remain within budget limits. - Total Budget by Category
Compares budget totals across categories. - Actual Amount by Category
Displays real spending for each category. - Budget Amount by Category
Shows planned spending for each category.
This sheet helps users identify categories that need control or attention.
Click to buy Budget Forecasting Dashboard in Excel
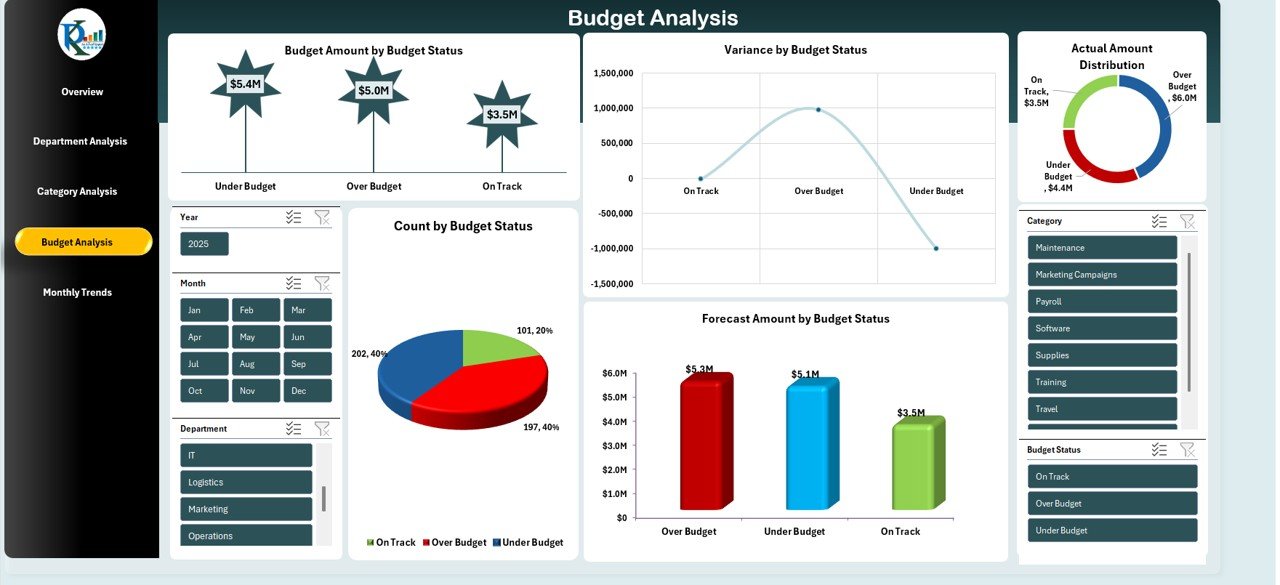
Budget Analysis Sheet Tab
The Budget Analysis page shows the financial status based on budget status labels such as On Track, Over Budget, Under Budget, or Pending.
Charts Included
- Budget Amount by Budget Status
Shows how total budget is distributed across status groups. - Count by Budget Status
Explains the number of items that fall under each status. - Variance by Budget Status
Shows how much each status deviates from the planned budget. - Forecast Amount by Budget Status
Gives a future view of expected spending.
This sheet helps finance teams evaluate overall budget performance.
Click to buy Budget Forecasting Dashboard in Excel
Monthly Trends Sheet Tab
The Monthly Trends tab displays financial insights for each month of the year. Users can track changes and measure budget performance over time.
Monthly Metrics
- Over Budget % by Month
Shows which months exceed expected expenses. - Forecast Amount by Month
Displays upcoming financial expectations. - Under Budget % by Month
Shows months where spending remains controlled. - Actual Amount by Month
Gives real spending figures month by month. - On Track Budget by Month
Shows the percentage of items that stay within budget.
This tab helps managers understand spending patterns.

Click to buy Budget Forecasting Dashboard in Excel
How Does a Budget Forecasting Dashboard in Excel Work?
This dashboard collects data from various sheets and uses formulas like:
- SUMIFS
- AVERAGE
- IF
- VARIANCE CALCULATIONS
- FORECAST FORMULAS
Excel then converts the data into tables, charts, and cards. When you update data, all visuals refresh automatically. This makes the system fast and reliable.
The dashboard uses slicers, filters, and dropdowns so users can navigate easily. You can filter data by:
- Month
- Category
- Department
- Budget Status
Because of these features, Excel displays accurate and clear insights.
Advantages of Using a Budget Forecasting Dashboard in Excel
A Budget Forecasting Dashboard offers many strong benefits. Some of the most important ones include:
- Better Financial Visibility
The dashboard shows all financial data in one place. Teams can view budget, forecast, actual spending, and variance instantly.
- Faster Decision-Making
Managers make decisions quickly because they see real-time numbers and trends.
- Easy Customization
Excel allows users to add formulas, charts, filters, and new fields without any coding.
- Higher Accuracy
Automated calculations reduce human errors.
- Improved Forecasting
Users understand future spending patterns with forecast visuals.
- Improved Budget Control
The dashboard highlights departments and categories that exceed budgets.
- Ready-to-Use Structure
You do not build everything from scratch. The template saves setup time.
- Simple Navigation
Every sheet has a clear structure for easy usage.
Key Features of the Budget Forecasting Dashboard in Excel
Here are some of the important features included in this dashboard:
- Pre-built overview sheet
- Department and category analysis
- Monthly financial trends
- Forecasting visuals
- Budget vs. actual comparison
- Variance analysis
- Interactive slicers
- Clean and modern layout
- Automatic updates
These features make the dashboard professional and powerful for financial management.
How to Use the Budget Forecasting Dashboard Effectively?
To get the best results, you must follow a simple process.
Step 1 → Enter Your Budget
Fill budget figures for all departments and categories.
Step 2 → Record Actual Spending
Update actual expenses regularly.
Step 3 → Update Forecast Amounts
Estimate future spending every month.
Step 4 → Analyze Trend Charts
Review monthly and department-wise spending patterns.
Step 5 → Take Action
Control overspending and improve planning.
Best Practices for the Budget Forecasting Dashboard in Excel
To get accurate results from this dashboard, follow these best practices:
Keep Data Clean
Enter correct numbers without extra text.
Update Monthly
Refresh actual numbers every month.
Use Consistent Formats
Maintain the same date, currency, and department formats.
Review Variance
Track variance values often to avoid overspending.
Use Filters
Apply slicers to view specific departments or categories.
Improve Forecast Accuracy
Use past data to generate smart future estimates.
Protect Formula Cells
Lock calculation cells to avoid mistakes.
Highlight Important Alerts
Use conditional formatting for over-budget alerts.
Opportunities for Improvement
Although the dashboard is powerful, you can improve it in several ways:
- Add automated alerts for high variance
- Insert more forecasting models
- Create dashboards for weekly trends
- Add more KPI cards
- Build connection with Power BI
- Include cost-saving suggestions
These improvements enhance analysis and budgeting accuracy.
Conclusion
A Budget Forecasting Dashboard in Excel helps organizations track financial performance, control spending, and plan future expenses with confidence. The dashboard simplifies budget vs. actual comparison, forecasts upcoming costs, and highlights problem areas. Because the dashboard uses smart visuals, managers understand financial movements easily. As a result, they take quick actions and improve financial discipline across departments.
When companies use this dashboard regularly, they save time, reduce errors, and make stronger financial decisions.
Frequently Asked Questions (FAQs)
- What is a Budget Forecasting Dashboard in Excel?
It is a ready-to-use Excel template that helps teams track budget, actual expenses, future forecasts, and variance.
- Who can use this dashboard?
Finance teams, HR, marketing, operations, project managers, and business owners.
- Does it update automatically?
Yes. When you update data, all charts and cards refresh automatically.
- Can I customize the dashboard?
Yes. You can modify formulas, charts, layouts, and styles as per your needs.
- Does it require coding?
No. It works entirely inside Excel without any macros or coding.
- Can I add new categories or departments?
Yes. You can expand the data table and the dashboard will update.
- Does this dashboard help reduce overspending?
Yes. It highlights over-budget areas and helps teams control expenses.
- Is the dashboard beginner-friendly?
Yes. Anyone with basic Excel knowledge can use it.
Visit our YouTube channel to learn step-by-step video tutorials
Watch the step-by-step video tutorial:
Click to buy Budget Forecasting Dashboard in Excel