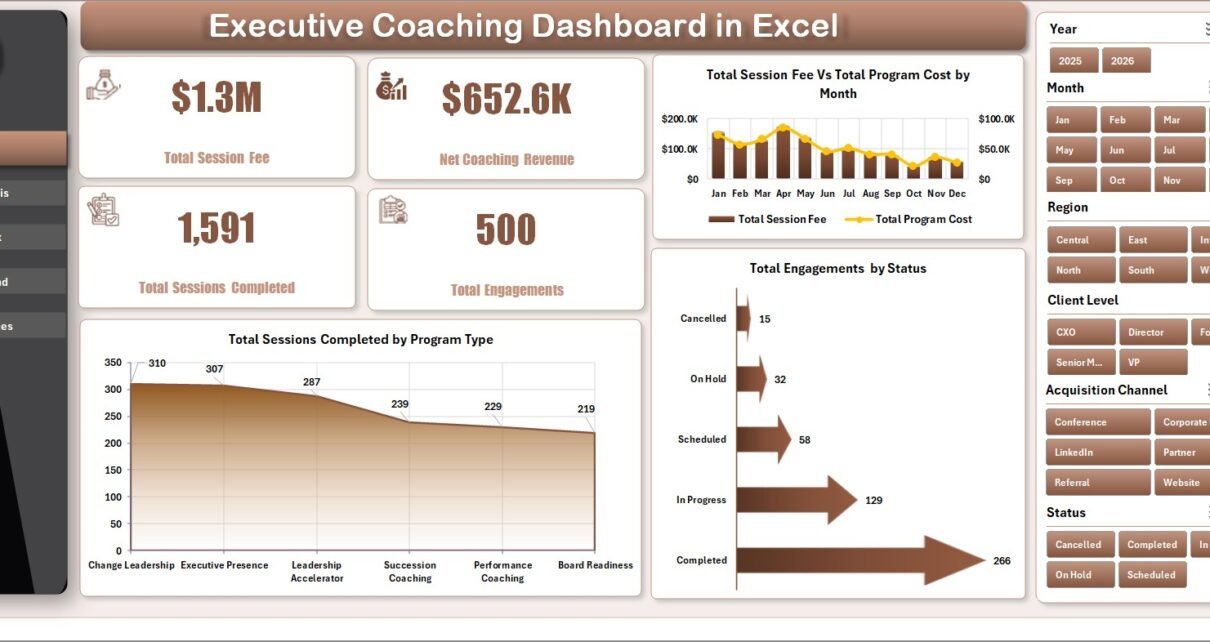
• Excel and VBA
    • VBA Course
    • Shortcut Keys
    • Useful Formulas
    • Basic Charts
    • Advanced Chart
    • Sort and Filter
    • Pivot Table
    • Data Validation
    • Conditional Formatting
    • Auto Fill and Flash Fill
    • Find and Replace
  • Charts
    • Progress Charts
    • Info-graphics
    • Animated Charts
    • Comparisons
    • Gantt Charts
    • Heatmaps
    • Speedometers
    • Timelines
  • Templates
  • Tutorials
    • Charts and Visualization
    • VBA
    • Excel Tips and Tricks
  • Power BI
  • Template StoreNew
  • CoursesNew
  • Ready to Use Templates
  • About Us
  • Contact Us

PK: An Excel Expert

Transforming Data into Decisions

Dashboard

This category provides detailed tutorials on creating effective and informative dashboards in Excel. Whether you need to track your business’s key performance indicators (KPIs) or present complex data in a simplified manner, our tutorials will guide you through the process. Each tutorial comes with a free practice file for download and tutorial videos to help you follow along easily. Start your Excel dashboard tutorial now and enhance your data analysis and presentation skills with this powerful tool. Impress your colleagues and boss with insightful and attractive dashboards by exploring this category today.

Dashboard

Subscription Box Dashboard in Excel

May 2, 2026May 2, 2026 PKComments Off on Subscription Box Dashboard in Excel
Subscription box revenue is volatile. One quarter your "Quarterly Glow" plan crushes monthly margins, the next month a single bad fulfilment week wipes out three weeks of growth. If you
Read More
Dashboard

Home Health Care KPI Scorecard in Excel

May 2, 2026May 2, 2026 PKComments Off on Home Health Care KPI Scorecard in Excel
According to the Centers for Medicare and Medicaid Services (CMS), home health agencies must track quality metrics across patient outcomes, caregiver performance, and operational efficiency to maintain accreditation and reimbursement
Read More
Dashboard

Reinsurance Services KPI Dashboard in Excel

May 2, 2026May 2, 2026 PKComments Off on Reinsurance Services KPI Dashboard in Excel
The global reinsurance market handled over $330 billion in gross written premiums in 2025, yet most reinsurance operations teams still track treaty performance, ceded premiums, and loss ratios using disconnected
Read More
Dashboard

International Development Report in Excel

May 2, 2026May 2, 2026 PKComments Off on International Development Report in Excel
The International Development Report in Excel tracks 5 headline KPIs across 4 sheets, with 5 interactive charts and dual slicers covering project, region, funding source, and month. According to the
Read More
Dashboard VBA

Office Key Access Request Tracker in Excel

May 1, 2026May 1, 2026 PKComments Off on Office Key Access Request Tracker in Excel
Office Key Access Request Tracker in Excel — Overview Managing office keys sounds simple — until 12 different people share a single cabinet key, the server room key disappears for
Read More
Dashboard

Mining Operations Dashboard in Excel

May 1, 2026May 1, 2026 PKComments Off on Mining Operations Dashboard in Excel
The mining industry runs on tonnage, time, and tight margins — and yet most multi-site mine operators are still reporting weekly KPIs in disconnected spreadsheets that surface problems weeks after
Read More
Dashboard

Substance Abuse Center KPI Scorecard in Excel

May 1, 2026May 1, 2026 PKComments Off on Substance Abuse Center KPI Scorecard in Excel
Substance abuse treatment centers in the United States report a 40–60% treatment dropout rate and an average 30-day readmission rate of 15–25%, according to behavioral health industry benchmarks. Yet most
Read More
Dashboard

Insurance Brokers KPI Dashboard in Excel

May 1, 2026May 1, 2026 PKComments Off on Insurance Brokers KPI Dashboard in Excel
The insurance brokerage industry manages over $300 billion in annual premiums globally, yet most brokerages with 5 to 200 employees still rely on manual Excel tracking or expensive agency management
Read More
Dashboard

Public Safety Report in Excel

May 1, 2026May 1, 2026 PKComments Off on Public Safety Report in Excel
Tracking public safety incidents — fires, vehicle accidents, patrol responses, equipment damage, vandalism — with three separate spreadsheets and a Friday-afternoon scramble to compile the council report is exhausting. In
Read More
Dashboard Power BI

Incident Management KPI Dashboard in Power BI

April 30, 2026April 30, 2026 PKComments Off on Incident Management KPI Dashboard in Power BI
The Incident Management KPI Dashboard in Power BI tracks IT incident performance across 3 interactive pages, comparing MTD and YTD actuals against targets and prior-year benchmarks. Setup takes under 10
Read More

Posts pagination

Previous 1 2 3 4 … 268 Next
  • Excel and VBA
    • VBA Course
    • Shortcut Keys
    • Useful Formulas
    • Basic Charts
    • Advanced Chart
    • Sort and Filter
    • Pivot Table
    • Data Validation
    • Conditional Formatting
    • Auto Fill and Flash Fill
    • Find and Replace
  • Charts
    • Progress Charts
    • Info-graphics
    • Animated Charts
    • Comparisons
    • Gantt Charts
    • Heatmaps
    • Speedometers
    • Timelines
  • Templates
  • Tutorials
    • Charts and Visualization
    • VBA
    • Excel Tips and Tricks
  • Power BI
  • Template StoreNew
  • CoursesNew
  • Ready to Use Templates
  • About Us
  • Contact Us
Copyright © 2023 PK-AnExcelExpert.com - Privacy Policy
This website uses cookies to improve your user experience, analyze site traffic and serve targeted ads in accordance with our Privacy Policy ACCEPT
Privacy & Cookies Policy

Privacy Overview

This website uses cookies to improve your experience while you navigate through the website. Out of these cookies, the cookies that are categorized as necessary are stored on your browser as they are essential for the working of basic functionalities of the website. We also use third-party cookies that help us analyze and understand how you use this website. These cookies will be stored in your browser only with your consent. You also have the option to opt-out of these cookies. But opting out of some of these cookies may have an effect on your browsing experience.
Necessary
Always Enabled
Necessary cookies are absolutely essential for the website to function properly. This category only includes cookies that ensures basic functionalities and security features of the website. These cookies do not store any personal information.
Non-necessary
Any cookies that may not be particularly necessary for the website to function and is used specifically to collect user personal data via analytics, ads, other embedded contents are termed as non-necessary cookies. It is mandatory to procure user consent prior to running these cookies on your website.
SAVE & ACCEPT