Emergency rescue teams often manage thousands of incident records across dispatch centers, service types, shifts, crews, vehicles, regions, and priority levels. When those records stay in disconnected spreadsheets, leaders lose time rebuilding monthly reports instead of reviewing response gaps. The Emergency Rescue Services Dashboard in Excel solves that reporting problem with a ready-made 7-sheet workbook covering 5 KPI cards, 5 analysis pages, multiple slicers, a Data sheet, and a Support sheet with pivot tables.
This dashboard is designed for rescue operations managers, EMS coordinators, dispatch analysts, fire and rescue departments, emergency response consultants, and public safety teams that want a practical Excel-based analytics layer. You can replace the sample data, click Data > Refresh All, and review incidents, patients assisted, rescue costs, response minutes, satisfaction score, crew performance, service type demand, and cost trends without building charts from scratch.
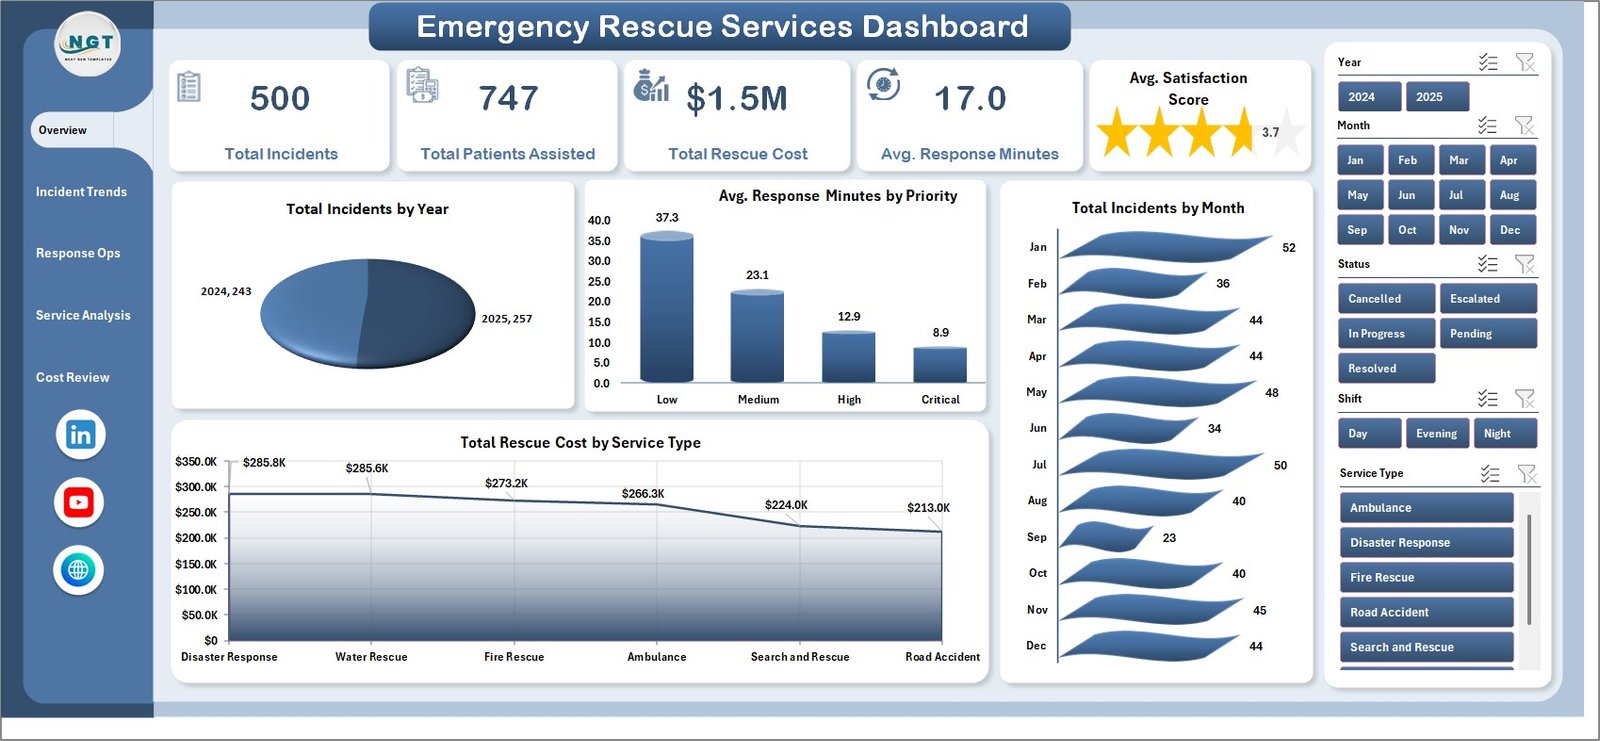
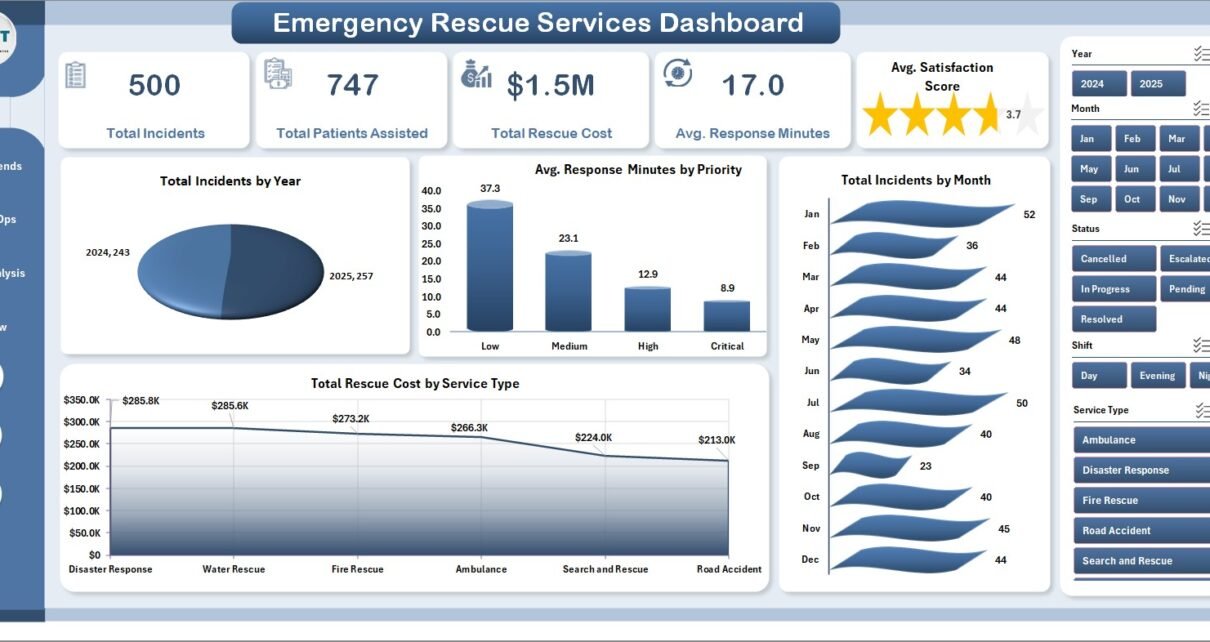
Emergency Rescue Services Dashboard in Excel – Overview Page
Key Features of Emergency Rescue Services Dashboard in Excel
The workbook includes five headline KPI cards: Total Incidents, Total Patients Assisted, Total Rescue Cost, Avg. Response Minutes, and Avg. Satisfaction Score. These cards sit at the top of the Overview page and give managers a quick operational snapshot before they inspect detailed charts.
It also includes five reporting pages: Overview, Incident Trends, Response Ops, Service Analysis, and Cost Review. Each page is supported by pivot tables and slicers, so managers can filter the dashboard quickly by operational fields such as period, priority, status, service type, region, city, dispatch center, crew, vehicle type, and shift.
The Data sheet is the single input area. Replace the sample rows with your own rescue service data in the same format, refresh the workbook, and the cards, slicers, charts, and pivots update together. Microsoft has a useful support guide on creating PivotTables to analyze worksheet data if your team wants to understand the Excel engine behind this template.
Dashboard Pages Explanation
1. Overview Page
The Overview page is the command center of the workbook. At the top, five cards show Total Incidents, Total Patients Assisted, Total Rescue Cost, Avg. Response Minutes, and Avg. Satisfaction Score. These measures help leaders answer the first questions in an emergency operations meeting: how many incidents happened, how many patients were supported, how much the operation cost, how fast teams responded, and how satisfied stakeholders were.
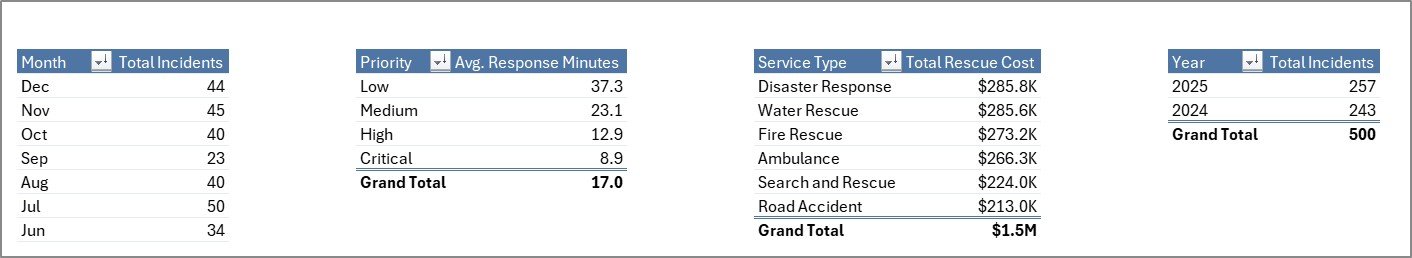
Total Incidents by Year shows annual incident volume so leaders can spot long-term growth, reductions, or unusual spikes. It is useful for capacity planning, annual reviews, and grant or budget discussions.
Avg. Response Minutes by Priority compares response time by priority level. This helps managers confirm whether high-priority incidents are receiving faster attention than lower-priority cases.
Total Incidents by Month shows monthly seasonality in incident demand. Rescue teams can use this chart to prepare vehicles, crews, and budgets for peak months.
Total Rescue Cost by Service Type breaks cost by service category. It helps finance and operations teams identify which service types consume the largest share of rescue spending.
2. Incident Trends
The Incident Trends page includes Total Incidents by Status, Avg. Response Minutes by Shift, Avg. Response Minutes by Region, and Total Patients Assisted by Month. This page is built for understanding workload status, response performance by shift, regional bottlenecks, and patient assistance demand over time.
Total Incidents by Status helps teams see open, closed, resolved, escalated, or pending incident volume at a glance. Avg. Response Minutes by Shift highlights whether day, evening, or night shifts need additional resources or process review.
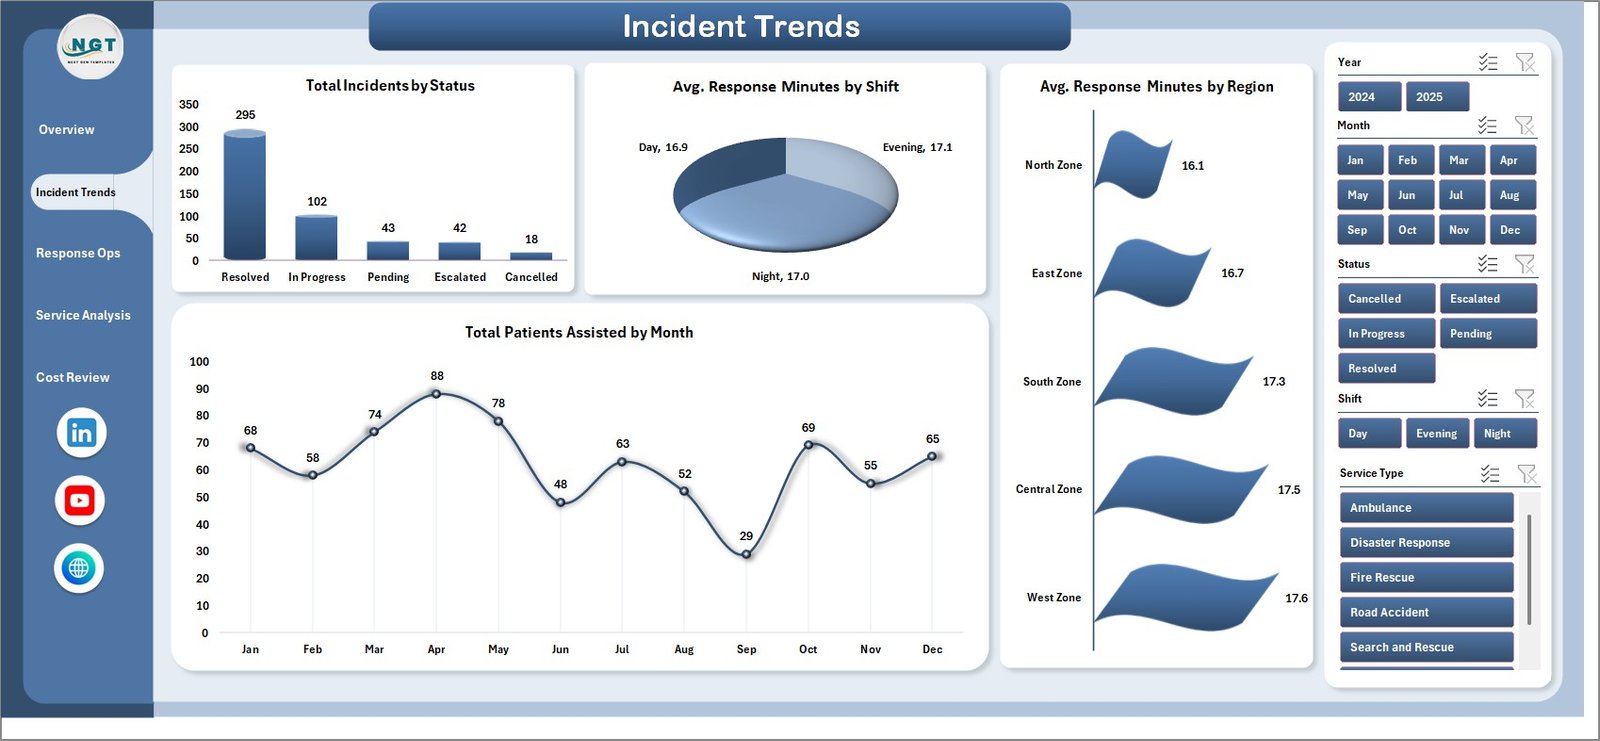
Incident Trends
3. Response Ops
The Response Ops page analyzes Total Incidents by Dispatch Center, Avg. Resolution Minutes by Crew, Total Incidents by Service Type, and Total Incidents by Vehicle Type. It is especially useful for dispatch leads and field operations managers who need to compare workload across centers, crews, service categories, and vehicle groups.
Total Incidents by Dispatch Center shows where call volume is concentrated. Avg. Resolution Minutes by Crew highlights crew-level differences in closure speed, making it easier to spot training needs, routing issues, or unusually complex assignments.
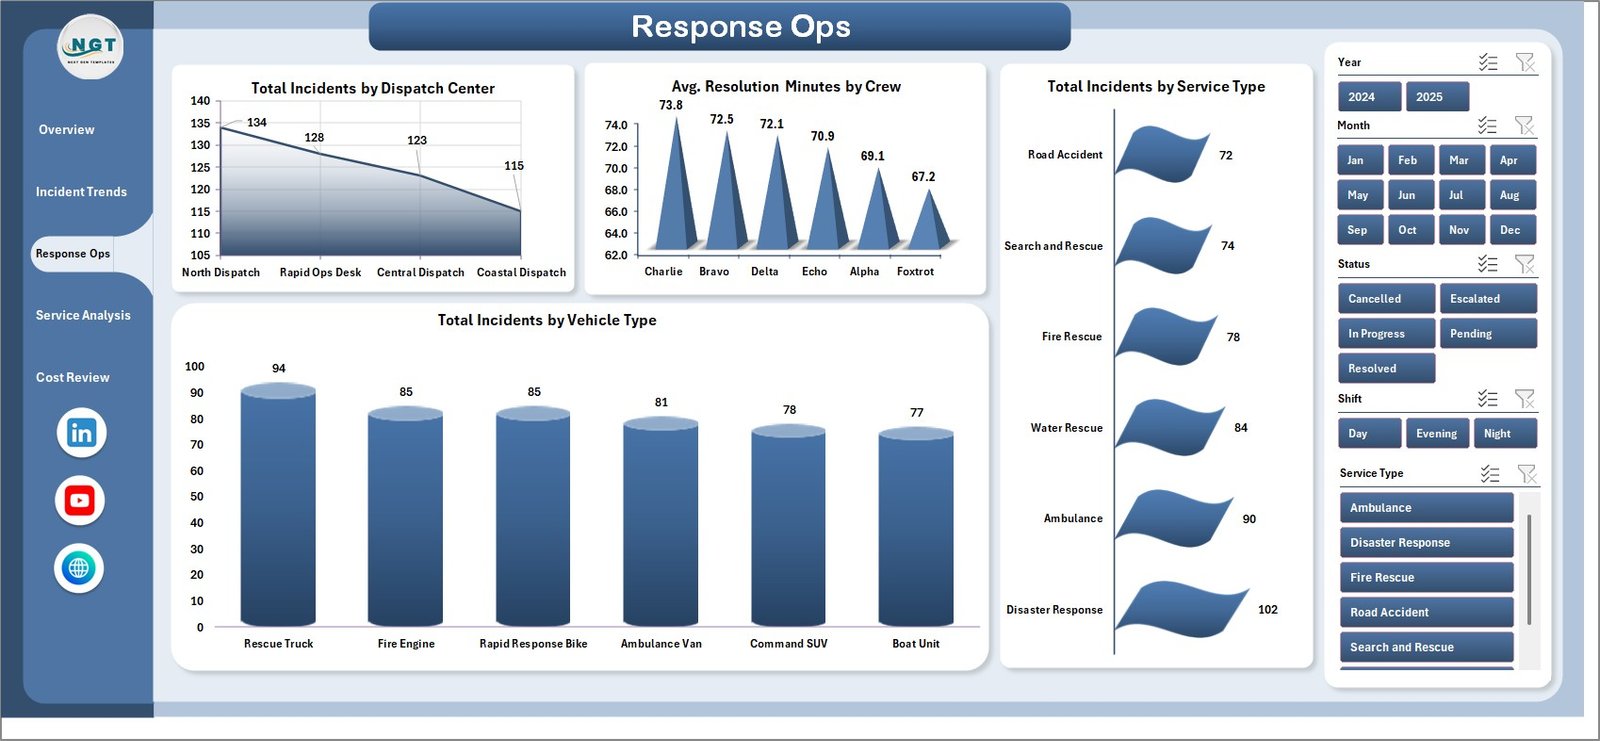
Response Ops
4. Service Analysis
The Service Analysis page includes Total Rescue Cost by Incident Category, Escalated Incidents by Priority, Total Rescue Cost by Region, and Avg. Response Minutes by City. This view is helpful when managers need to understand the cost, escalation, region, and city-level dimensions of rescue performance.
Total Rescue Cost by Incident Category identifies the most expensive case types. Escalated Incidents by Priority shows whether escalation pressure is concentrated in urgent incidents, while Avg. Response Minutes by City supports local service-level conversations.
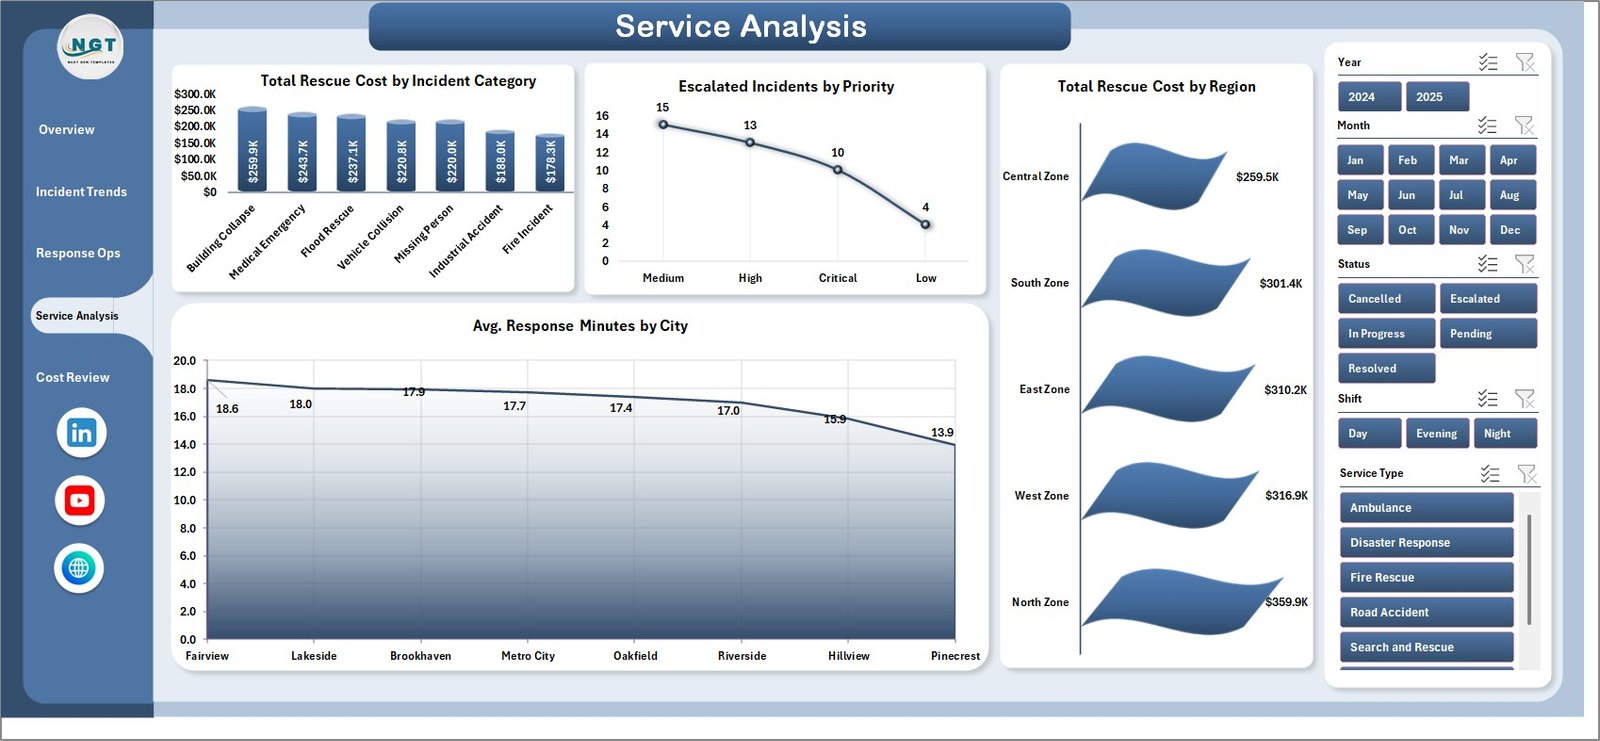
Service Analysis
5. Cost Review
The Cost Review page focuses on Avg. Cost per Incident by Month, Total Rescue Cost by Status, and Total Rescue Cost by Priority. This is the page for finance reviews, operational cost control, and leadership meetings where rescue cost must be explained clearly.
Avg. Cost per Incident by Month shows whether rescue work is becoming more or less expensive over time. Total Rescue Cost by Priority helps teams understand the cost impact of urgent or high-severity incidents.
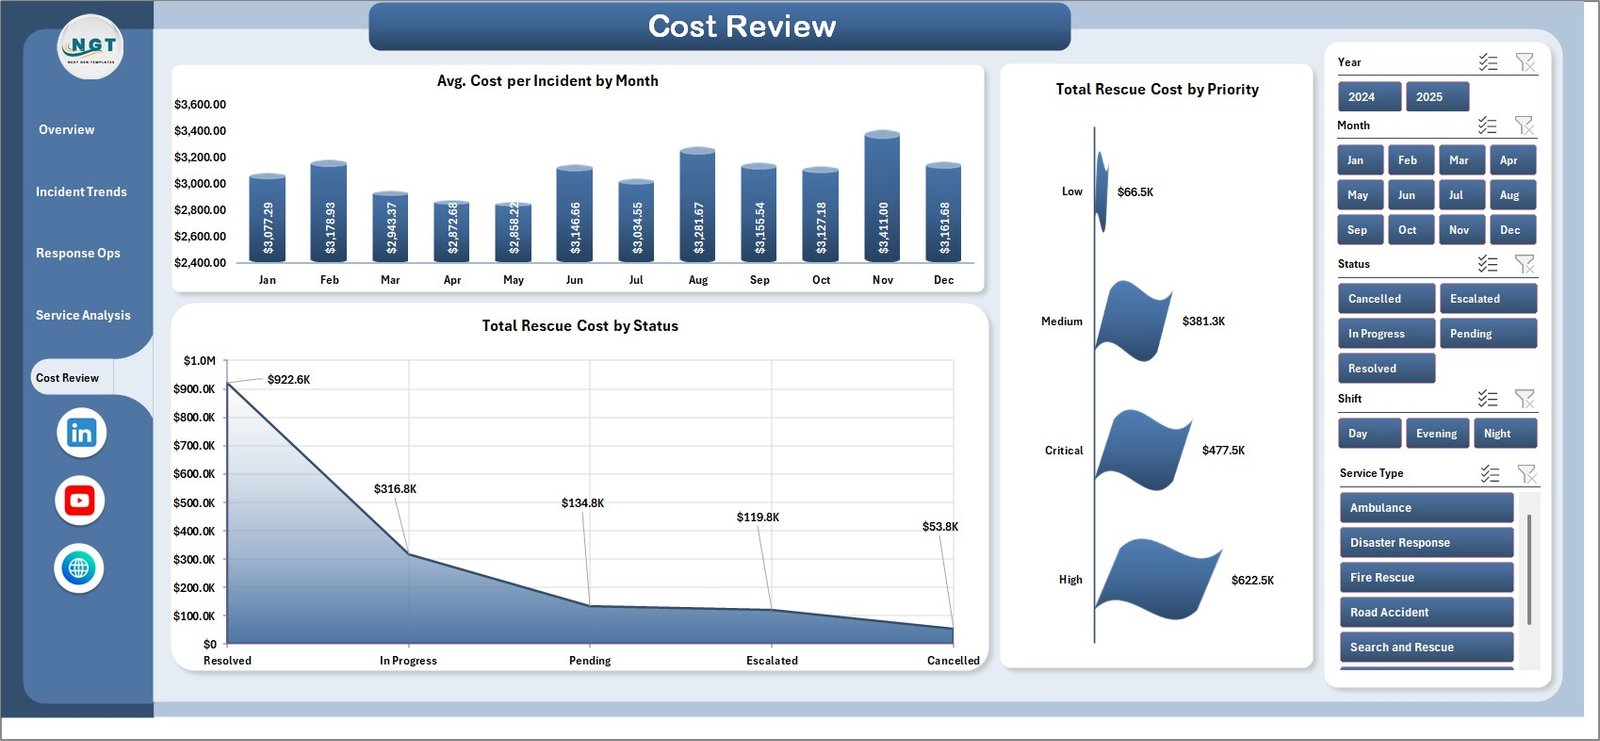
Cost Review
6. Data Sheet Tab
The Data sheet is where you add the data in the same format as the sample file. Keep the column headers unchanged, replace the sample rescue service records with your own, and refresh the workbook. This sheet is the source for every KPI card, chart, slicer, and pivot table in the dashboard.
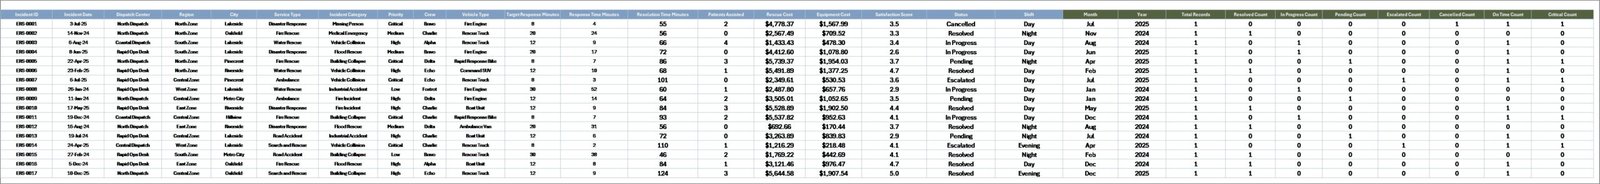
Data Sheet tab
7. Support Sheet
The Support sheet contains multiple pivot tables used to create the entire dashboard dynamically. After updating the Data sheet, go to the Excel ribbon and click Data > Refresh All. All pivots will refresh, and all charts will refresh. You can keep this sheet hidden after setup.
Support sheet tab
Emergency Rescue Services Dashboard in Excel vs. Google Sheets vs. Paid SaaS – Feature Comparison
| Feature | Emergency Rescue Services Dashboard in Excel | Google Sheets Alternative | Paid Emergency SaaS |
|---|---|---|---|
| Cost | $17.99 one-time | Low-cost template or internal build | $39-$199/user/month |
| Platform | Microsoft Excel | Browser-based spreadsheet | Cloud portal |
| Setup time | Under 10 minutes | 10-30 minutes | 2-8 weeks onboarding |
| Offline access | Yes | Limited | No |
| Custom fields | Fully editable workbook | Editable sheet | Vendor-controlled schema |
| Share with link | Via OneDrive or SharePoint | Native link sharing | Native portal sharing |
| Year-1 cost at 5 users | $17.99 | $0-$50 plus build time | $2,340-$11,940 |
| Incident analytics pages | 5 pre-built pages | Usually manual setup | Yes, with subscription |
Who Should Use This Template
This template is a strong fit for fire and rescue departments, EMS teams, emergency operations centers, disaster response teams, rescue service NGOs, public safety analysts, dispatch center managers, and consultants who prepare rescue service reports for clients. It works best when the team already uses Excel and needs a practical dashboard for monthly or weekly reporting.
It is not a replacement for CAD dispatch, field responder mobile apps, live GPS tracking, emergency alerting, or regulated case-management systems. Think of it as the analysis and reporting layer after the operational data has been collected.
Real-World Use Cases
Fire rescue operations chief: uses the Overview and Incident Trends pages to review incident volume, response minutes, patient assistance, and escalation patterns before the weekly command meeting.
Dispatch center manager: uses Response Ops to compare incident volume by dispatch center and average resolution minutes by crew, then adjusts scheduling or training based on the data.
Emergency services finance analyst: uses Cost Review and Service Analysis to explain total rescue cost by priority, status, region, incident category, and service type.
Advantages of Emergency Rescue Services Dashboard in Excel
The main advantage is speed. You do not need to design a dashboard layout, build pivot tables, create slicers, or format charts from a blank workbook. The structure is already in place, so the team can focus on entering good data and reviewing the story behind the numbers.
The second advantage is ownership. The file is editable, offline, and not tied to a subscription. You can rename fields, add rows, change colors, modify chart titles, and keep the workbook inside your own storage environment.
Opportunities for Improvement
The dashboard is refresh-based, so it does not show live data unless someone updates the Data sheet and refreshes the pivots. If you need real-time dispatch feeds, automated alerts, or mobile responder updates, a specialist operational system is still needed.
Teams should also keep the Data sheet structure consistent. If column headers are deleted or renamed, pivot tables may need adjustment. A simple governance rule helps: add rows freely, but keep the header row unchanged.
Best Practices
Keep one clean master copy of the workbook, then save monthly or weekly copies for reporting history. Validate incident categories, priority names, city names, and service type values before refreshing so slicers stay clean. After refreshing, hide the Support sheet before sharing with leadership. For formal reporting, export the key dashboard pages to PDF and archive them with the source data period.
Explore Relevant Templates
- Emergency Management Report in Excel for event-level emergency reporting.
- Public Safety Report in Excel for police, fire, EMS, and municipal incident reporting.
- Crisis Response KPI Dashboard in Power BI for Power BI-based crisis KPI tracking.
- Compliance and Audit Dashboard in Excel for audit, risk, and compliance analytics.
- Road Safety Services KPI Dashboard in Excel for transportation and public safety KPI tracking.
Frequently Asked Questions
What does the Emergency Rescue Services Dashboard in Excel track?
It tracks incidents, patients assisted, rescue cost, response minutes, satisfaction score, status, shift, region, dispatch center, crew, service type, vehicle type, priority, city, and cost trends through KPI cards and pivot charts.
How do I update the dashboard?
Replace the sample data in the Data sheet, keep the same column format, then click Data > Refresh All in the Excel ribbon. The pivot tables, cards, slicers, and charts will update.
Does this workbook require macros?
No. It is built around Excel pivot tables, slicers, charts, and standard workbook features.
Can I add new rescue service types or regions?
Yes. Add them as values in the Data sheet. After refreshing, the pivots and slicers can include the new values.
Is this dashboard suitable for EMS and fire rescue teams?
Yes. It is suitable for EMS, fire rescue, dispatch centers, emergency operations teams, public safety analysts, and rescue services that track incidents and response performance in Excel.
Can I hide the Support sheet?
Yes. The Support sheet holds the pivot tables behind the dashboard and can be hidden after setup to keep the workbook cleaner for end users.
About the Author
Built by PK – Microsoft Certified Professional with 15+ years of Excel, Google Sheets, and Power BI experience. Founder of NextGenTemplates, reaching 300K+ subscribers across YouTube channels. Every template is hand-built and tested before release.
Conclusion
The Emergency Rescue Services Dashboard in Excel gives rescue leaders a practical way to turn incident records into actionable reporting. With five KPI cards, five analysis pages, slicers, a structured Data sheet, and a hidden Support sheet, the workbook helps teams review response speed, patient assistance, service demand, cost trends, escalation pressure, and crew performance without rebuilding monthly reports from scratch.
Click here to purchase the Emergency Rescue Services Dashboard in Excel.
Visit our YouTube channel for step-by-step video tutorials: YouTube.com/@PK-AnExcelExpert
Last updated: June 8, 2026