Public broadcasting organizations operate in a highly accountable environment. Every decision impacts public trust, content quality, reach, and efficient use of funds. Therefore, teams must track performance accurately and continuously. However, many public broadcasters still rely on scattered Excel files, delayed reports, and manual summaries. As a result, leaders struggle to see the real picture on time.
That is exactly where a Public Broadcasting KPI Dashboard in Power BI delivers exceptional value.
In this detailed, SEO-friendly, and easy-to-understand guide, you will learn what a Public Broadcasting KPI Dashboard in Power BI is, why it matters, how it works, page-wise structure, advantages, best practices, and frequently asked questions. Moreover, this article expands your provided information with practical insights so you can confidently implement this dashboard in real-world public broadcasting operations.
Click to Purchases Public Broadcasting KPI Dashboard in Power BI
What Is a Public Broadcasting KPI Dashboard in Power BI?
A Public Broadcasting KPI Dashboard in Power BI is a centralized, interactive reporting solution designed to monitor, analyze, and visualize key performance indicators related to public broadcasting operations.
Instead of managing multiple spreadsheets for content delivery, audience reach, compliance, and operational efficiency, this dashboard consolidates everything into one structured Power BI file. Consequently, decision-makers gain instant visibility into performance trends and KPI status.
Moreover, this dashboard uses Excel as a data source. Therefore, teams can update data easily without technical complexity. At the same time, Power BI transforms that data into professional, dynamic visuals.
Why Do Public Broadcasting Organizations Need a KPI Dashboard?
Public broadcasting organizations serve communities, governments, and stakeholders. Because of this responsibility, performance transparency becomes critical.
Common Challenges Without a KPI Dashboard
Data remains scattered across departments
Monthly and yearly reporting consumes excessive time
KPI comparisons become inconsistent
Management decisions rely on delayed insights
Performance gaps remain unnoticed
However, a Public Broadcasting KPI Dashboard in Power BI solves these problems by delivering clarity, structure, and speed.
How Does a Public Broadcasting KPI Dashboard in Power BI Work?
The workflow remains simple and efficient.
First, teams enter actual and target data into Excel
Then, Power BI reads and refreshes the data
Next, KPIs update automatically across all dashboard pages
Finally, leadership reviews performance using slicers, visuals, and drill-through features
As a result, reporting becomes faster, more accurate, and highly consistent.
What Are the Key Features of the Public Broadcasting KPI Dashboard in Power BI?
This ready-to-use dashboard includes thoughtfully designed features that support both operational teams and leadership.
🔹 Excel-Based Data Input
Simple and familiar data entry
No advanced Power BI modeling required
Easy monthly updates
🔹 Interactive Power BI Pages
Dynamic slicers
KPI cards
Conditional formatting icons
Trend analysis charts
🔹 Structured KPI Framework
KPI Grouping
KPI Types (LTB / UTB)
MTD and YTD performance tracking
Year-over-Year comparisons
How Is the Dashboard Structured in Power BI?
The Public Broadcasting KPI Dashboard in Power BI consists of three well-organized pages, each serving a clear purpose.
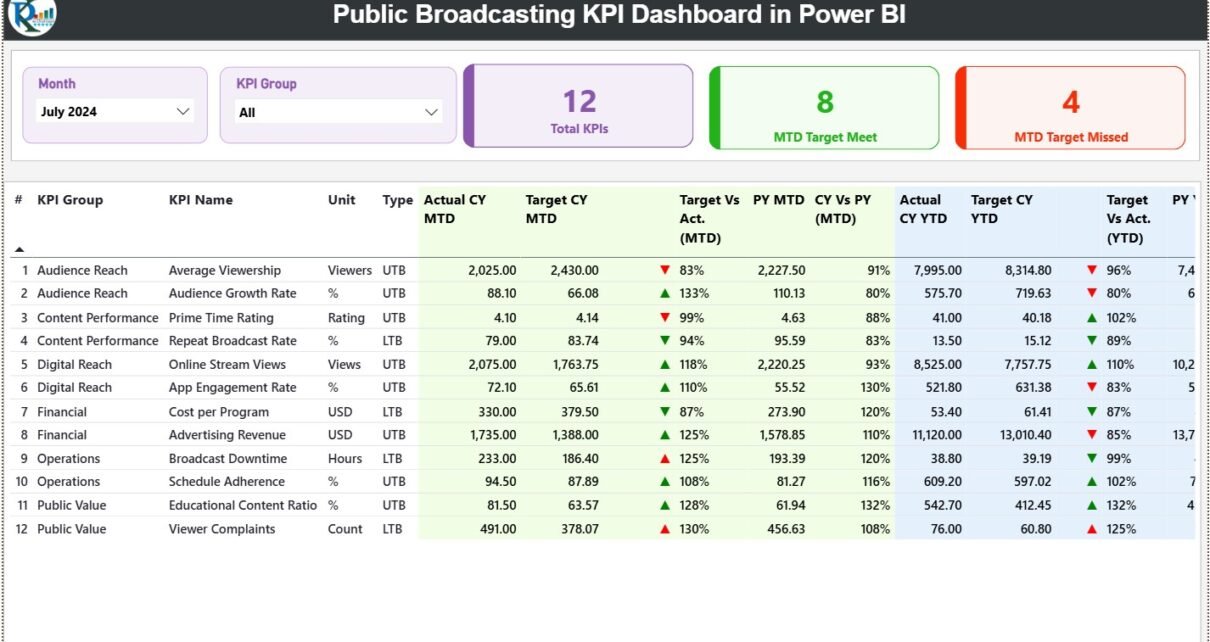
1️⃣ What Is the Summary Page in the Public Broadcasting KPI Dashboard?

The Summary Page acts as the control center of the dashboard.
Top-Level Filters
Month Slicer – Select the reporting month
KPI Group Slicer – Focus on specific KPI categories
These slicers instantly refresh all visuals on the page. As a result, users can analyze performance with just a few clicks.
KPI Cards on the Summary Page
At the top, three KPI cards provide instant insights:
Total KPIs Count – Total number of KPIs tracked
MTD Target Met Count – KPIs meeting targets
MTD Target Missed Count – KPIs missing targets
Therefore, leadership immediately understands overall performance health.
Detailed KPI Table on the Summary Page
Below the cards, a detailed KPI table displays comprehensive performance metrics.
Columns Explained Clearly
KPI Number – Sequential KPI reference
KPI Group – Category or department
KPI Name – Name of the KPI
Unit – Measurement unit
Type – LTB (Lower the Better) or UTB (Upper the Better)
Month-to-Date (MTD) Performance Metrics
Actual CY MTD – Current year actual MTD value
Target CY MTD – Target MTD value
MTD Icon – ▲ or ▼ icons with green/red indicators
Target vs Actual (MTD) – Actual ÷ Target
PY MTD – Previous year MTD value
CY vs PY (MTD) – CY MTD ÷ PY MTD
These metrics allow fast identification of performance gaps and improvements.
Year-to-Date (YTD) Performance Metrics
Actual CY YTD – Current year YTD actual
Target CY YTD – Current year YTD target
YTD Icon – ▲ or ▼ performance indicator
Target vs Actual (YTD) – Actual ÷ Target
PY YTD – Previous year YTD value
CY vs PY (YTD) – CY YTD ÷ PY YTD
As a result, teams track both short-term and long-term performance simultaneously.
Click to Purchases Public Broadcasting KPI Dashboard in Power BI
2️⃣ What Is the KPI Trend Page and Why Is It Important?
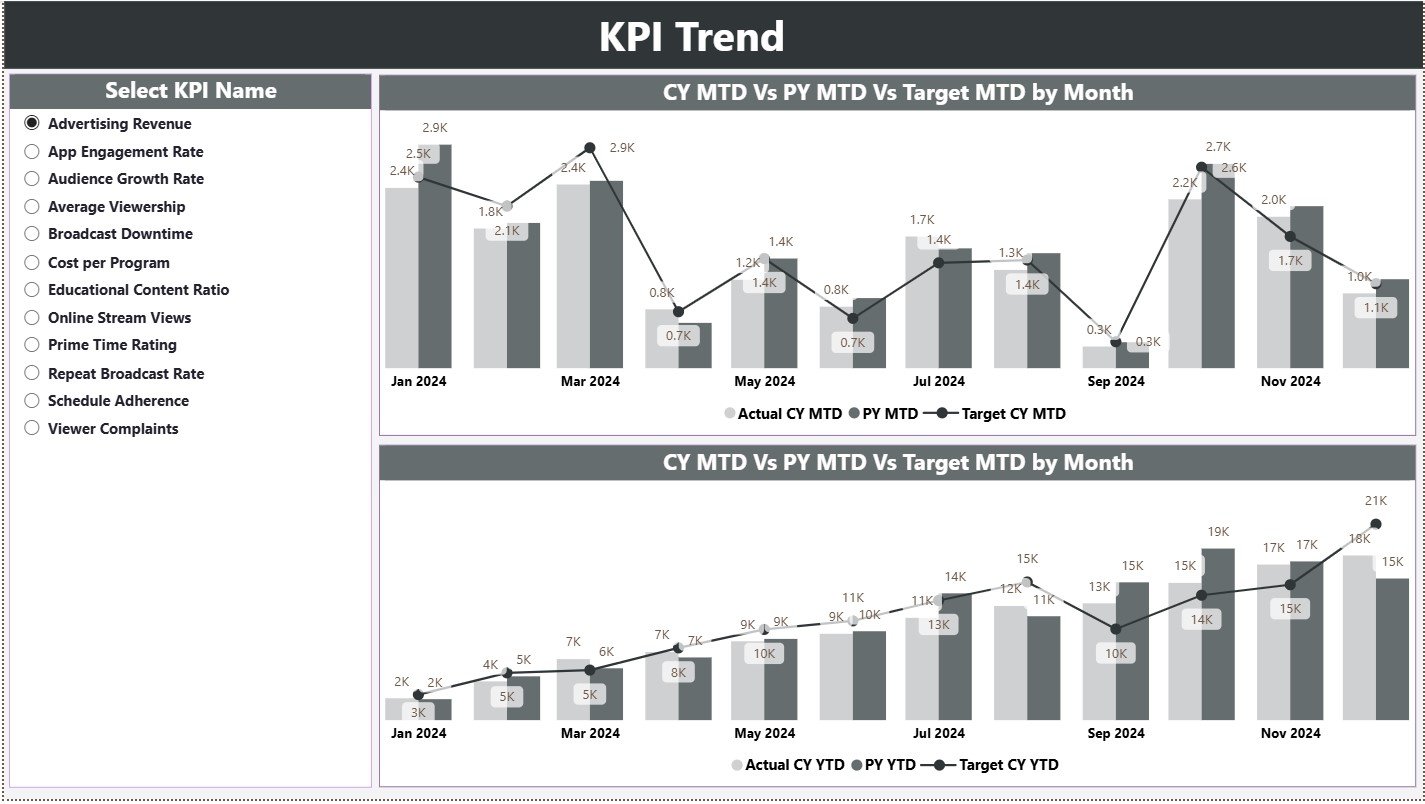
The KPI Trend Page focuses on performance movement over time.
Key Elements of the KPI Trend Page
KPI Name Slicer on the left
Two Combo Charts for analysis
Combo Charts Explained
MTD Trend Chart
Actual CY
Target CY
Previous Year MTD
YTD Trend Chart
Actual CY
Target CY
Previous Year YTD
Because of these visuals, users can instantly understand trends, seasonality, and growth patterns.
3️⃣ What Is the KPI Definition Page?

The KPI Definition Page serves as a drill-through reference page.
What Does This Page Show?
KPI Formula
KPI Definition
KPI Unit
KPI Type (LTB / UTB)
This page remains hidden by default. However, users can drill through from the Summary Page to view detailed explanations.
Moreover, a Back Button at the top-left corner ensures easy navigation.
How Does the Excel Data Source Work?
The dashboard uses a structured Excel file with three worksheets.
1️⃣ Input_Actual Sheet
Here, users enter actual performance values.
Required Fields:
KPI Name
Month (First date of the month)
MTD Actual
YTD Actual
2️⃣ Input_Target Sheet
This sheet captures planned performance.
Required Fields:
KPI Name
Month (First date of the month)
MTD Target
YTD Target
3️⃣ KPI Definition Sheet
This sheet defines KPI structure.
Required Fields:
KPI Number
KPI Group
KPI Name
Unit
Formula
Definition
Type (LTB / UTB)
As a result, KPI governance remains consistent and transparent.
Click to Purchases Public Broadcasting KPI Dashboard in Power BI
Advantages of Public Broadcasting KPI Dashboard in Power BI
Using a Public Broadcasting KPI Dashboard in Power BI offers multiple advantages.
✅ Centralized Performance Visibility
All KPIs appear in one place. Therefore, leaders stop chasing reports.
✅ Faster Decision-Making
Real-time insights enable timely corrective actions.
✅ Improved Accountability
Clear KPI ownership improves performance culture.
✅ Strong Transparency
Public broadcasters demonstrate performance accountability.
✅ Reduced Manual Effort
Automation replaces repetitive reporting tasks.
✅ Easy Adoption
Excel-based input lowers training and resistance.
Best Practices for the Public Broadcasting KPI Dashboard in Power BI
To get maximum value, follow these best practices.
🔹 Define KPIs Clearly
Always document definitions and formulas in the KPI Definition sheet.
🔹 Maintain Monthly Data Discipline
Update actual and target data consistently every month.
🔹 Use KPI Groups Wisely
Logical grouping improves analysis clarity.
🔹 Review Both MTD and YTD Metrics
Balance short-term actions with long-term goals.
🔹 Monitor Trend Pages Regularly
Trends reveal risks before numbers fail.
🔹 Train Teams on KPI Meaning
Understanding KPIs drives better actions.
How Does This Dashboard Support Strategic Decisions?
This dashboard supports strategic planning in several ways:
Budget allocation decisions
Content performance reviews
Compliance reporting
Operational efficiency improvements
Public accountability reporting
Therefore, leadership moves from reactive management to proactive governance.
Click to Purchases Public Broadcasting KPI Dashboard in Power BI
Conclusion: Why Should Public Broadcasters Use a KPI Dashboard in Power BI?
A Public Broadcasting KPI Dashboard in Power BI transforms scattered performance data into a structured, visual, and decision-ready system. Because it combines Excel simplicity with Power BI power, teams gain clarity without complexity.
Moreover, the dashboard supports transparency, accountability, and performance excellence—values that define public broadcasting.
If your organization aims to improve reporting quality, reduce manual effort, and strengthen data-driven decisions, this dashboard becomes an essential tool.
Frequently Asked Questions (FAQs)
❓ What is the main purpose of a Public Broadcasting KPI Dashboard in Power BI?
The main purpose is to track, analyze, and visualize performance metrics in a centralized and interactive format.
❓ Can non-technical users update this dashboard?
Yes. Users only need to update Excel input sheets.
❓ What does LTB and UTB mean?
LTB means Lower the Better, while UTB means Upper the Better.
❓ Does this dashboard support year-over-year analysis?
Yes. It compares current year data with previous year MTD and YTD values.
❓ Can organizations customize KPIs?
Absolutely. Users can add or modify KPIs through the Excel definition sheet.
❓ How often should data be updated?
Ideally, update data monthly to maintain accuracy and relevance.
Click to Purchases Public Broadcasting KPI Dashboard in Power BI
Visit our YouTube channel to learn step-by-step video tutorials