New: NextGenTemplates Academy - video courses on Excel formulas with AI and Pivot Tables & dashboards. Early-bird: 20% off with code EARLYBIRD20 - first 20 orders only. See the courses →
  • Learn Excel (Free Course)
    • 1. Shortcut Keys
    • 2. Fill & Flash Fill
    • 3. Find & Replace
    • 4. Sort & Filter
    • 5. Formulas & Functions
    • 6. Data Validation
    • 7. Conditional Formatting
    • 8. Basic Charts
    • 9. Advanced Charts
    • 10. Pivot Tables
    • 11. Excel Dashboards
    • 12. VBA Course
    • 13. Excel Formulas with AI
  • Templates
  • Tutorials
    • Charts and Visualization
    • VBA
    • Excel Tips and Tricks
    • Excel Dashboards
    • Power Pivot & DAX
  • Power BI
  • Template Store
    • Ready to Use Templates
  • Courses
  • Academy
    • Excel + AI Mastery: 100 Formulas
    • Excel Pivot Tables & Dashboards
  • About Us
  • Contact Us

PK: An Excel Expert

Transforming Data into Decisions

Power BI

This category provides comprehensive tutorials on creating dynamic and insightful visualizations with Power BI. Whether you need to analyze complex data sets or create interactive dashboards, our tutorials will guide you through the process. Each tutorial comes with a free practice file for download and tutorial videos to help you follow along easily. Start your Power BI tutorial now and learn how to create engaging and informative reports. Impress your colleagues and boss with your data visualization and analysis skills by exploring this category today.

Dashboard Power BI

Influencer Campaign Dashboard in Power BI

May 9, 2026May 9, 2026 PKComments Off on Influencer Campaign Dashboard in Power BI
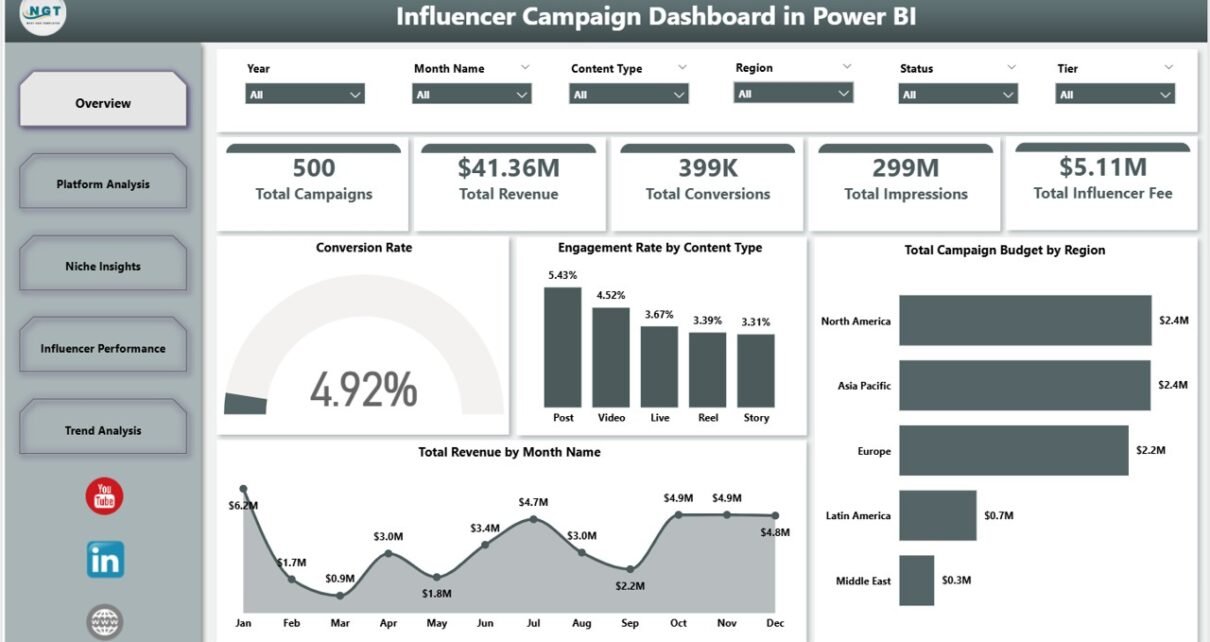
The Influencer Campaign Dashboard in Power BI tracks 5 high-level KPIs and 16 pre-built visuals across 5 interactive report pages — Overview, Platform Analysis, Niche Insights, Influencer Performance, and Trend
Read More
Dashboard Power BI

School Admin Dashboard in Power BI

May 8, 2026May 8, 2026 PKComments Off on School Admin Dashboard in Power BI
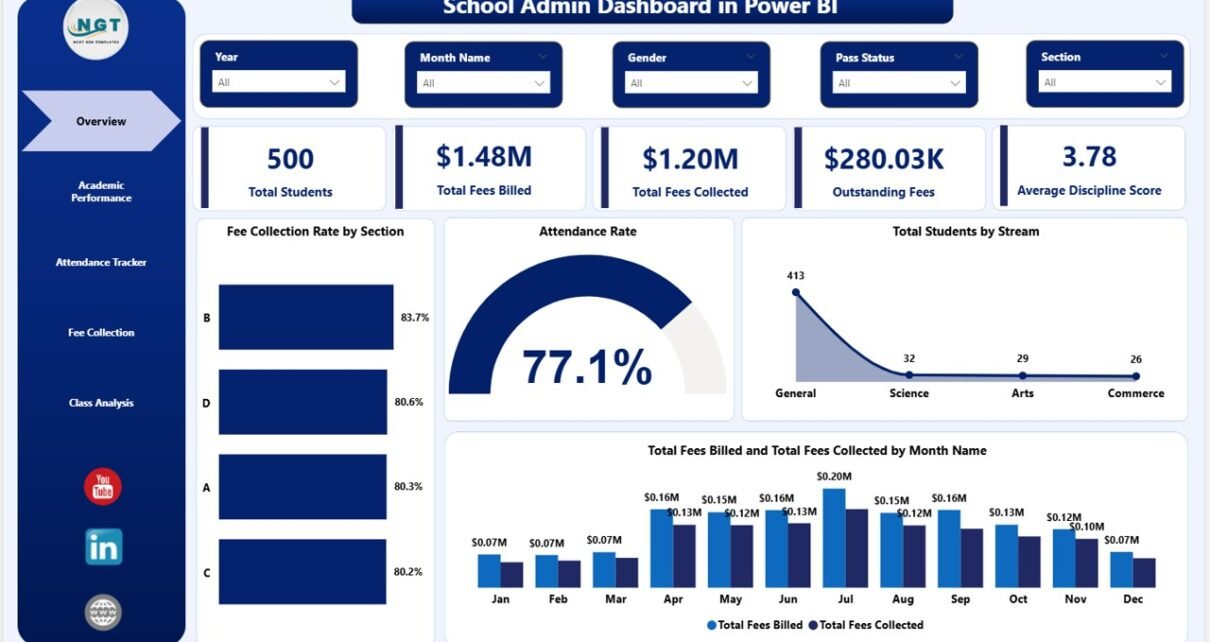
  Managing a school means juggling hundreds of data points simultaneously — student enrollment, academic performance, attendance records, fee collection, and class-level discipline. Without a clear visual layer, important signals
Read More
Dashboard Power BI

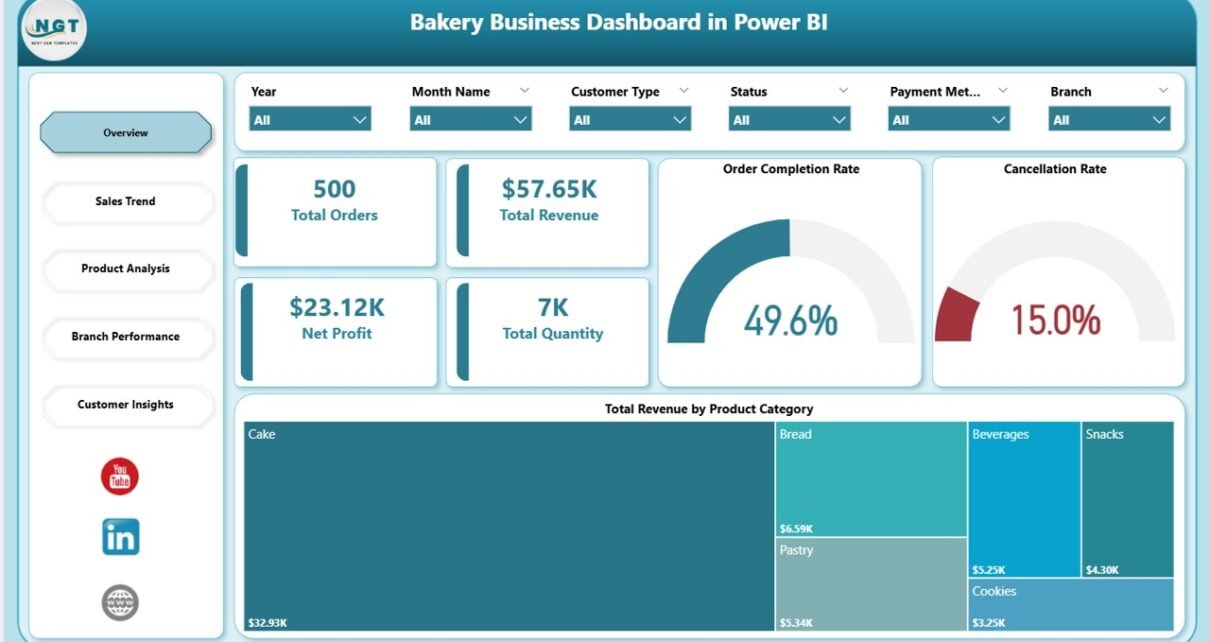
Bakery Business Dashboard in Power BI

May 8, 2026May 8, 2026 PKComments Off on Bakery Business Dashboard in Power BI
  Running a bakery business in 2026 means tracking dozens of operational variables at once — product category revenue, branch profitability, customer acquisition channels, order cancellation rates, and seasonal demand
Read More
Power BI

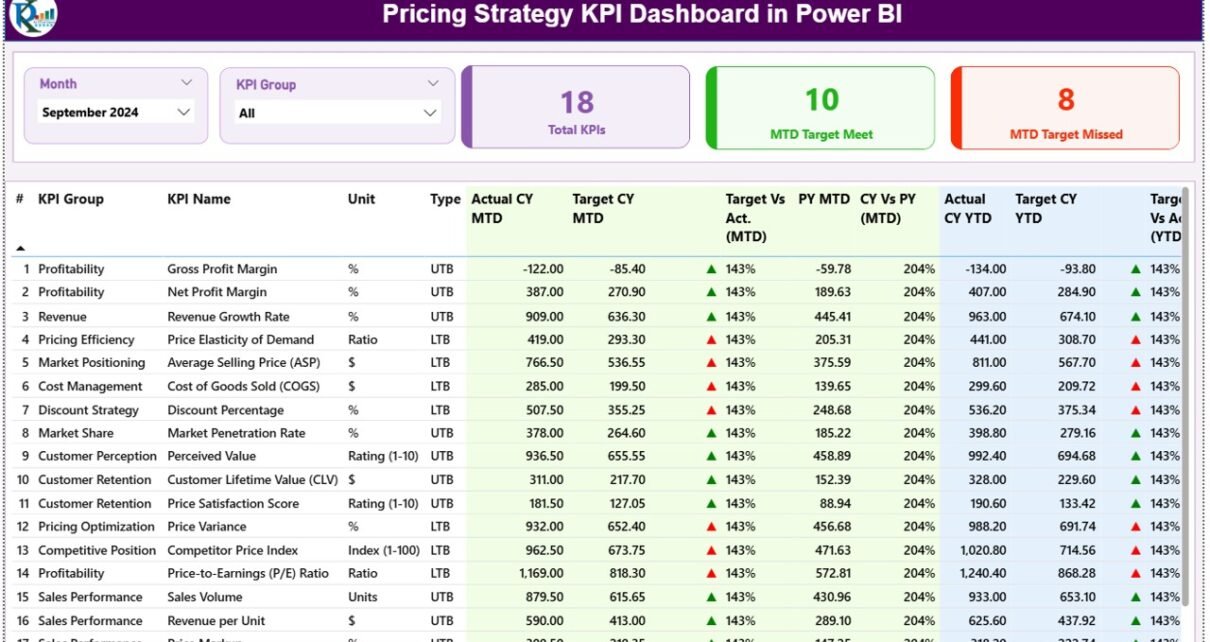
Pricing Strategy KPI Dashboard in Power BI

May 8, 2026May 8, 2026 PKComments Off on Pricing Strategy KPI Dashboard in Power BI
Pricing teams that rely on spreadsheets typically spend 3–5 hours each month stitching together MTD actuals, YTD targets, and prior-year comparisons from multiple Excel files — only to produce a
Read More
Power BI

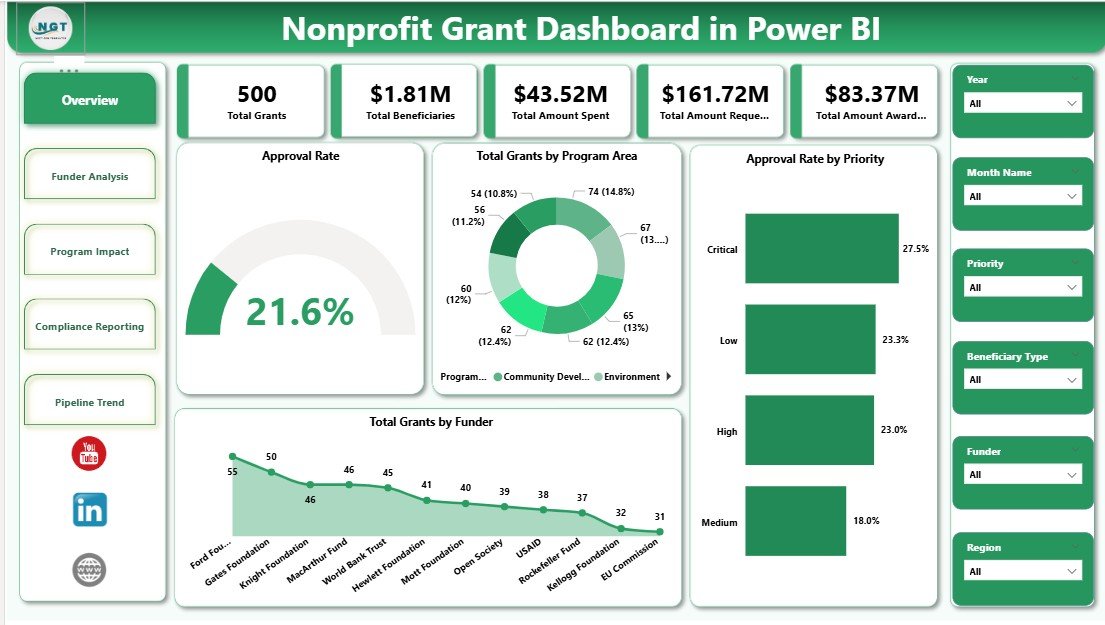
Nonprofit Grant Dashboard in Power BI

May 8, 2026May 8, 2026 PKComments Off on Nonprofit Grant Dashboard in Power BI
Nonprofits managing grant portfolios lose an estimated 3–5 hours per week compiling progress reports that could be automated. The Nonprofit Grant Dashboard in Power BI addresses this directly: it tracks
Read More
Dashboard Power BI

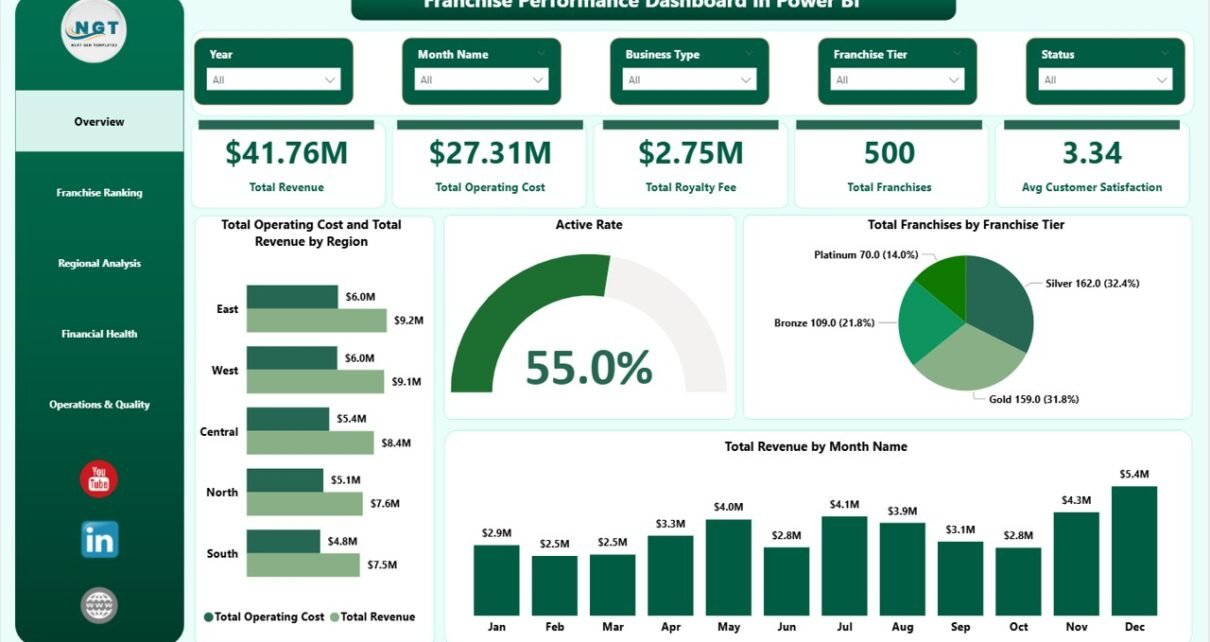
Franchise Performance Dashboard in Power BI

May 7, 2026May 7, 2026 PKComments Off on Franchise Performance Dashboard in Power BI
  Franchise operators typically track 8–12 critical performance metrics across revenue, compliance, and customer experience — yet most generic Power BI templates cover only 3 or 4 of those dimensions.
Read More
Dashboard Power BI Templates

Sales Funnel KPI Dashboard in Power BI

May 7, 2026May 7, 2026 PKComments Off on Sales Funnel KPI Dashboard in Power BI
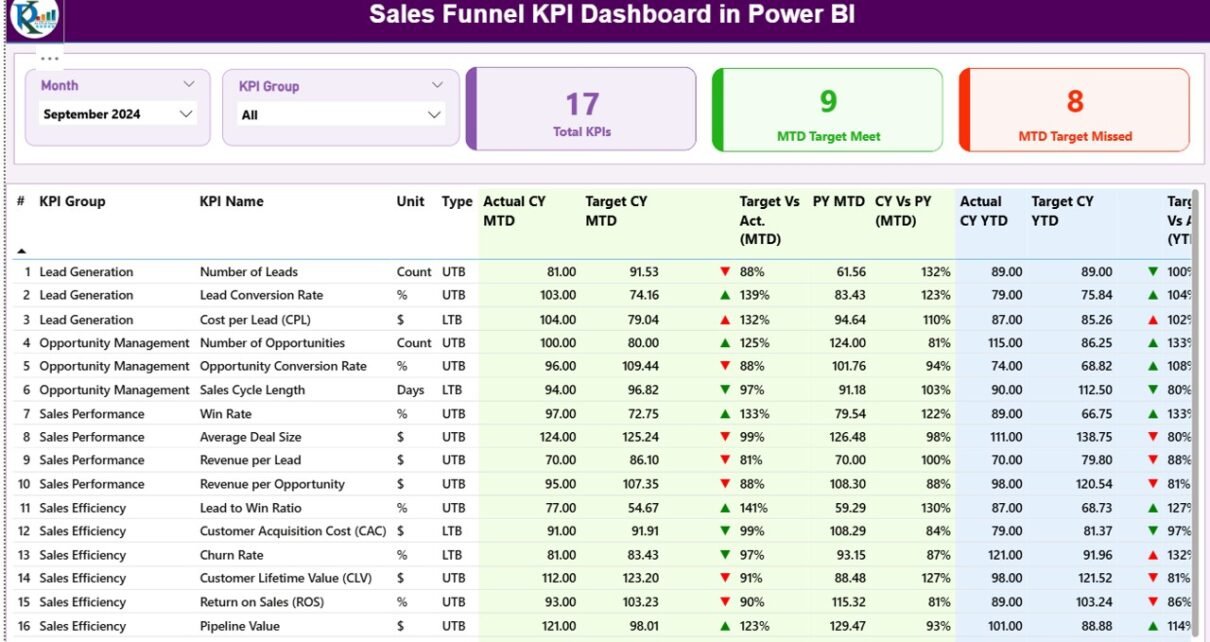
The Sales Funnel KPI Dashboard in Power BI delivers 3 interactive report pages covering 16 data points per KPI — including MTD actuals, YTD actuals, prior-year comparisons, and target-achievement icons
Read More
Dashboard Power BI

Packaging Machine Downtime Dashboard in Power BI

May 7, 2026May 7, 2026 PKComments Off on Packaging Machine Downtime Dashboard in Power BI
  Packaging facilities lose an estimated 5–15% of production capacity every year to unplanned machine downtime — yet most maintenance teams are still logging events in spreadsheets with no way
Read More
Dashboard Power BI

Pet Care Business Dashboard in Power BI

May 6, 2026May 6, 2026 PKComments Off on Pet Care Business Dashboard in Power BI
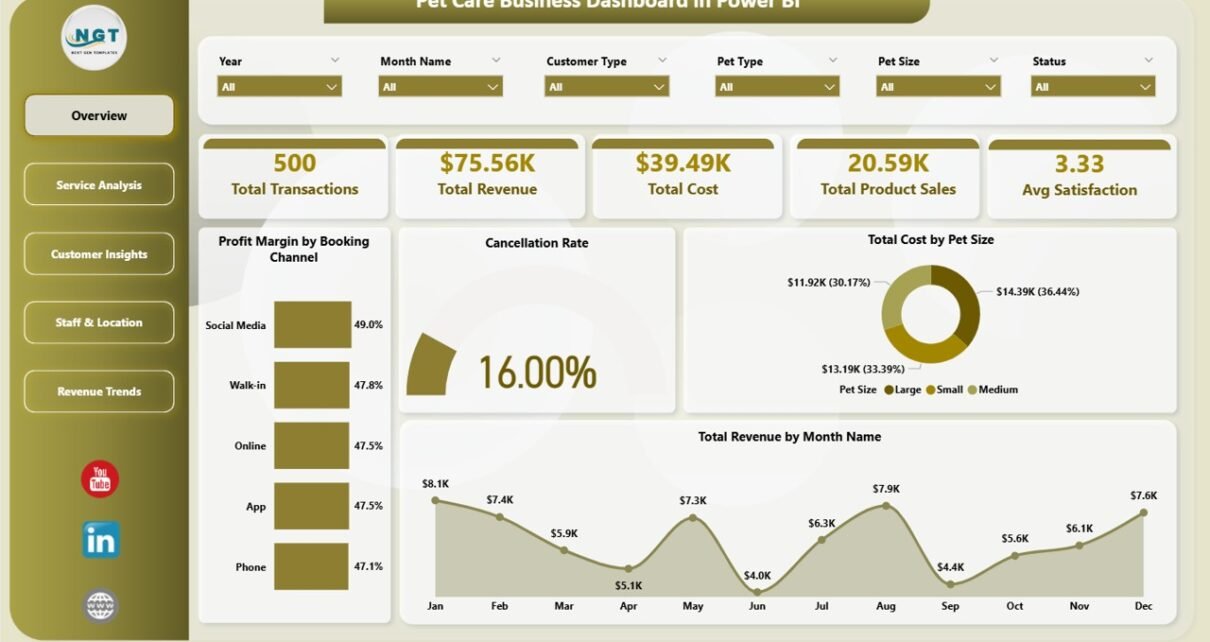
  The Pet Care Business Dashboard in Power BI tracks 5 KPI cards across 5 interactive report pages, with 16 pre-built visuals and slicers covering Service Type, Booking Channel, Pet
Read More
Dashboard Power BI

Gym Retention Dashboard in Power BI

May 6, 2026May 6, 2026 PKComments Off on Gym Retention Dashboard in Power BI
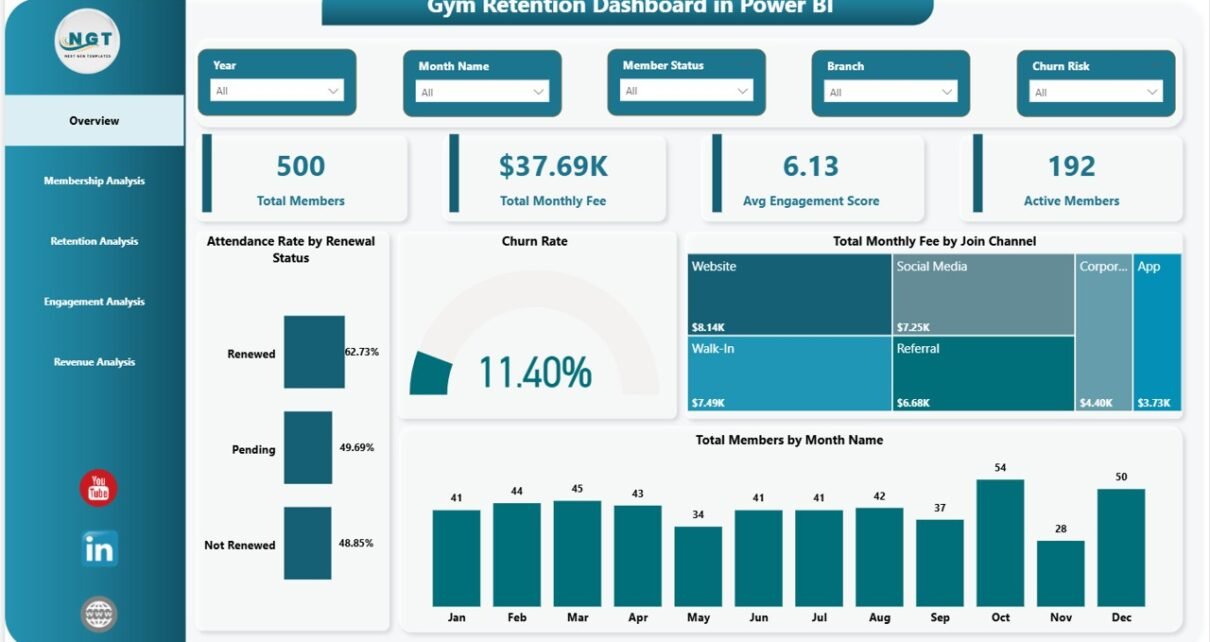
The Gym Retention Dashboard in Power BI tracks 4 headline KPIs across 5 interactive report pages, with 13 pre-built visuals and slicer-driven filters covering Membership Type, Branch, Renewal Status, Program,
Read More

Posts pagination

Previous 1 … 30 31 32 … 155 Next
  • Learn Excel (Free Course)
    • 1. Shortcut Keys
    • 2. Fill & Flash Fill
    • 3. Find & Replace
    • 4. Sort & Filter
    • 5. Formulas & Functions
    • 6. Data Validation
    • 7. Conditional Formatting
    • 8. Basic Charts
    • 9. Advanced Charts
    • 10. Pivot Tables
    • 11. Excel Dashboards
    • 12. VBA Course
    • 13. Excel Formulas with AI
  • Templates
  • Tutorials
    • Charts and Visualization
    • VBA
    • Excel Tips and Tricks
    • Excel Dashboards
    • Power Pivot & DAX
  • Power BI
  • Template Store
    • Ready to Use Templates
  • Courses
  • Academy
    • Excel + AI Mastery: 100 Formulas
    • Excel Pivot Tables & Dashboards
  • About Us
  • Contact Us
Copyright © 2023 PK-AnExcelExpert.com - Privacy Policy
This website uses cookies to improve your user experience, analyze site traffic and serve targeted ads in accordance with our Privacy Policy ACCEPT
Privacy & Cookies Policy

Privacy Overview

This website uses cookies to improve your experience while you navigate through the website. Out of these cookies, the cookies that are categorized as necessary are stored on your browser as they are essential for the working of basic functionalities of the website. We also use third-party cookies that help us analyze and understand how you use this website. These cookies will be stored in your browser only with your consent. You also have the option to opt-out of these cookies. But opting out of some of these cookies may have an effect on your browsing experience.
Necessary
Always Enabled
Necessary cookies are absolutely essential for the website to function properly. This category only includes cookies that ensures basic functionalities and security features of the website. These cookies do not store any personal information.
Non-necessary
Any cookies that may not be particularly necessary for the website to function and is used specifically to collect user personal data via analytics, ads, other embedded contents are termed as non-necessary cookies. It is mandatory to procure user consent prior to running these cookies on your website.
SAVE & ACCEPT