In the highly competitive chemical industry, success depends on more than just production volume or sales growth. To maintain profitability, efficiency, and compliance, chemical companies need to track their performance metrics in real time. That’s where a Chemical KPI Scorecard in Excel becomes a game-changer.
This ready-to-use scorecard template helps organizations monitor key performance indicators (KPIs), analyze progress against targets, and make data-driven decisions. Whether you manage a chemical manufacturing plant, a distribution company, or a research laboratory, this Excel tool simplifies performance management.
In this comprehensive guide, we’ll explore what a Chemical KPI Scorecard is, how it works, what’s inside the Excel template, and how you can use it to drive operational excellence.Chemical KPI Scorecard in Excel..
Click to buy Chemical KPI Scorecard in Excel
What Is a Chemical KPI Scorecard in Excel?
A Chemical KPI Scorecard in Excel is a performance tracking system designed to measure critical business metrics across different functions — including production, safety, quality control, inventory, and environmental compliance.
The scorecard consolidates actual data, targets, and historical performance into one easy-to-understand dashboard. With interactive visuals and trend charts, managers can instantly assess whether KPIs are meeting expectations and identify areas that need improvement.
Unlike expensive software solutions, this Excel-based scorecard is simple, affordable, and customizable — perfect for chemical manufacturers, processors, and distributors of all sizes.Chemical KPI Scorecard in Excel
Structure of the Chemical KPI Scorecard Template
This Excel template includes four key worksheets, each serving a specific purpose in the performance management cycle:
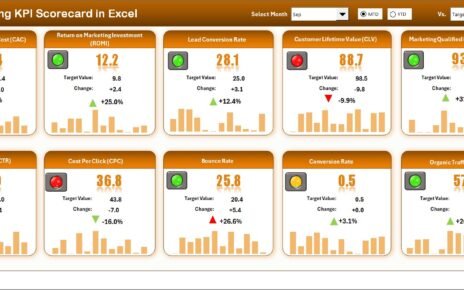
Scorecard Sheet – The Main Dashboard
The Scorecard Sheet is the central hub of the tool. It displays all key performance metrics in a clear, visual, and interactive layout.
Key Features:
- Dropdown Menus: Select any month or view MTD (Month-to-Date) and YTD (Year-to-Date) performance instantly.
- Actual vs Target Values: Compare results to planned targets for quick performance evaluation.
- Color-Coded Visuals: Conditional formatting makes it easy to identify good (green) and poor (red) performance.
- KPI Overview: Displays 10 KPIs in one view, making it ideal for board meetings or performance reviews.
- Interactive Design: Automatically updates charts and values when a month or KPI group is selected.Chemical KPI Scorecard in Excel .

Chemical KPI Scorecard in Excel
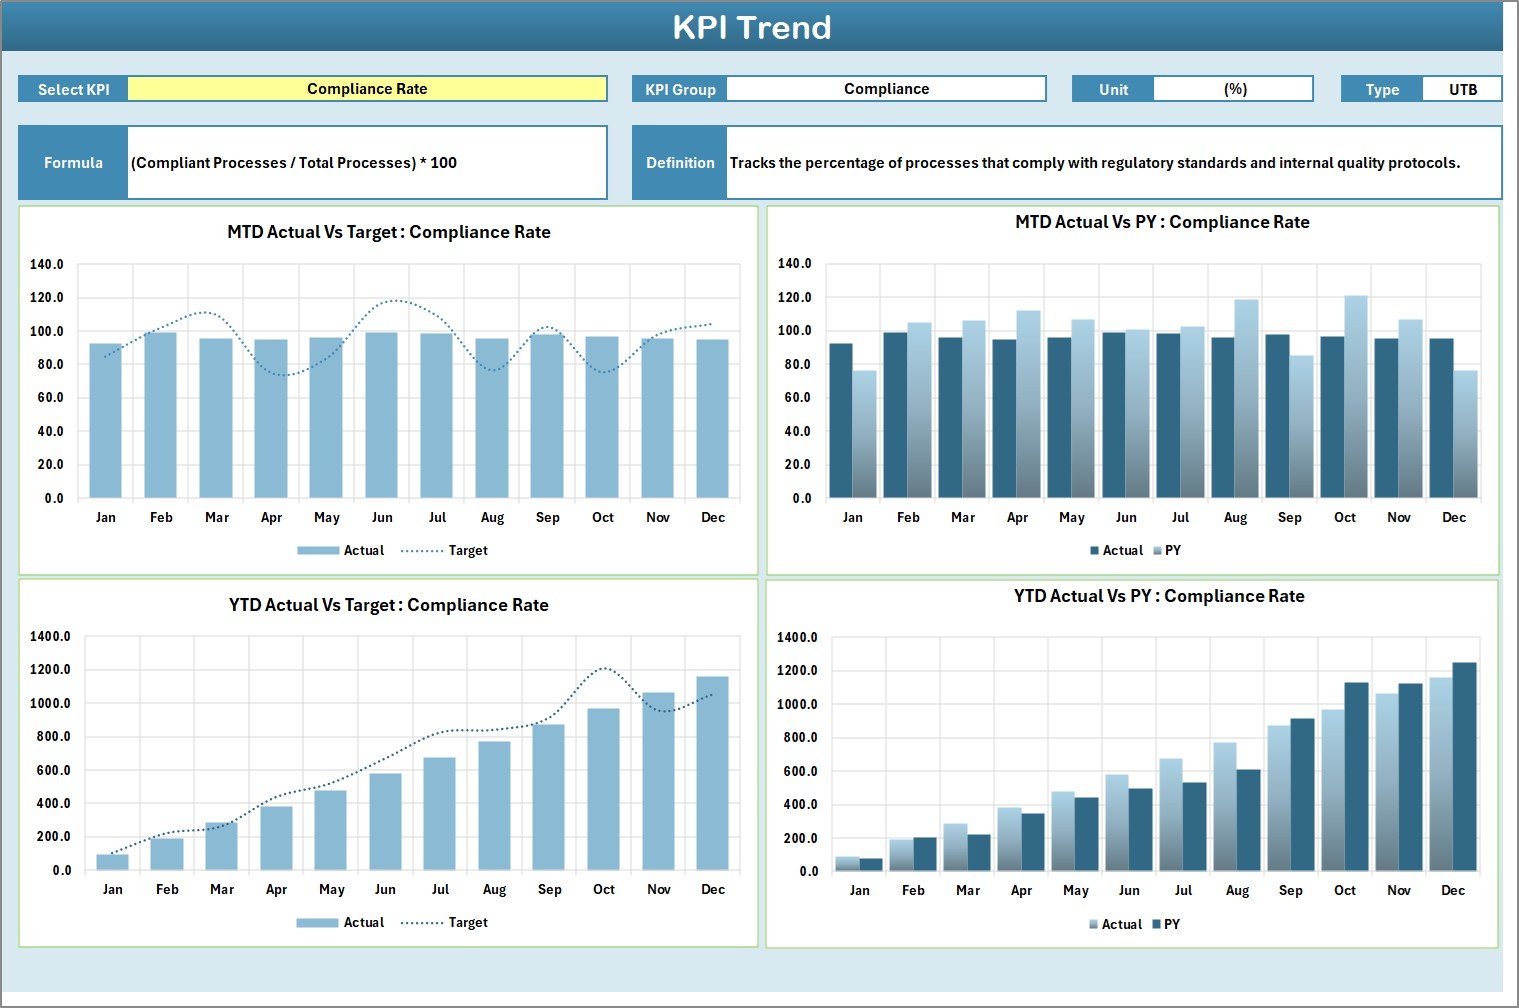
KPI Trend Sheet – Performance Over Time
The KPI Trend Sheet gives a detailed look into how each KPI performs over time.
Highlights:
- KPI Selection: Choose any KPI name from a dropdown (Cell C3).
- KPI Metadata: Displays KPI Group, Unit, Type (UTB or LTB), Formula, and Definition.
- Trend Chart: Visualize MTD and YTD performance for Actual, Target, and Previous Year.
- Trend Analysis: Identify whether performance is improving or declining over time.
This sheet is extremely useful for operations managers who need to monitor performance progress and take corrective actions early.
Click to buy Chemical KPI Scorecard in Excel
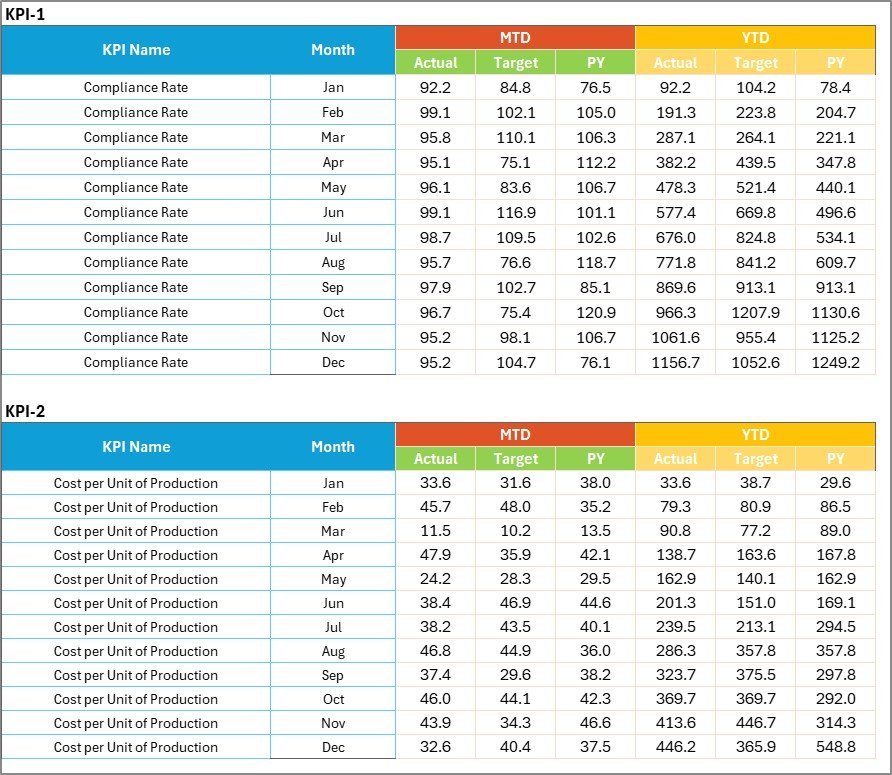
Input Data Sheet – The Data Engine
The Input Data Sheet is where you record all performance data.
How It Works:
- Data Entry: Enter actual values, target values, and previous-year numbers for each KPI.
- Monthly Tracking: Each month’s data automatically feeds into the dashboard and trend charts.
- Flexibility: You can update or expand the dataset as the company grows or new KPIs are introduced.
This sheet ensures that the entire system remains dynamic and up to date.
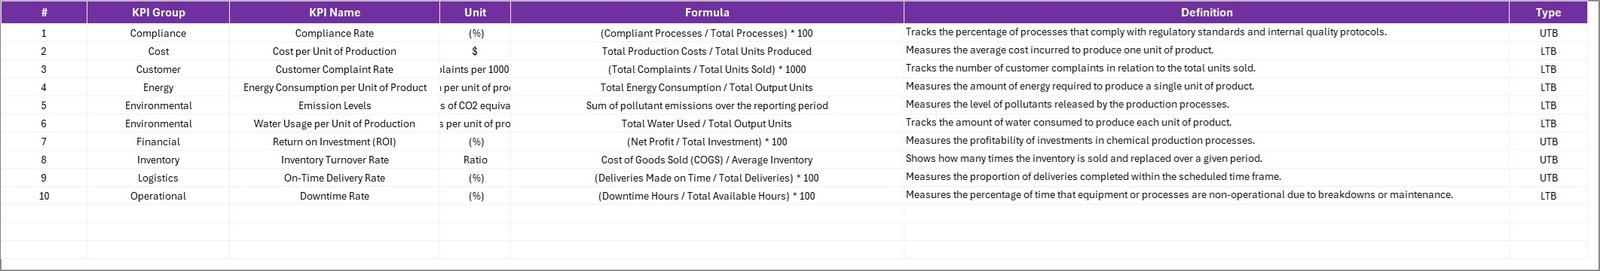
KPI Definition Sheet – Reference for Every Metric
The KPI Definition Sheet stores information about each KPI, ensuring clarity and consistency across teams.
Includes Columns For:
- KPI Name
- KPI Group
- Unit
- Formula
- Definition
Having a centralized KPI definition list helps align all departments on how each metric is calculated and interpreted.
Why Do You Need a Chemical KPI Scorecard?
The chemical industry operates within strict environmental, safety, and quality standards. Even a small error in production or inventory can lead to significant losses. Therefore, tracking performance metrics is essential.
Here’s why implementing a Chemical KPI Scorecard in Excel is so valuable:
- Improves Visibility: You can view real-time data on production, safety, and quality metrics in one place.
- Enables Data-Driven Decisions: Managers can compare actuals vs targets to make timely adjustments.
- Ensures Compliance: Track environmental and safety KPIs to maintain industry standards.
- Boosts Productivity: Identify process bottlenecks and optimize resource allocation.
- Supports Continuous Improvement: By comparing monthly and yearly trends, teams can set more achievable future goals.
Key KPIs for Chemical Industry Performance
A well-structured KPI scorecard focuses on metrics that drive business success. Below are important categories and examples of KPIs commonly used in the chemical sector:
Production and Operations KPIs
- Production Volume (tons) – Total output per month.
- Yield Percentage (%) – Actual output vs theoretical capacity.
- Machine Downtime (hours) – Total hours of equipment unavailability.
- Batch Cycle Time (hours) – Average time to produce a batch.
- Energy Consumption (kWh/ton) – Power usage per unit produced.
Quality Control KPIs
- Defect Rate (%) – Percentage of rejected or reworked products.
- First Pass Yield (%) – Output produced without rework.
- Customer Complaints (#) – Total customer quality complaints per period.
- Compliance Audit Score (%) – Average score from internal or external audits.
Environmental and Safety KPIs
- Waste Generated (kg) – Total waste produced in manufacturing.
- Emissions per Unit (CO₂ tons/unit) – Measures environmental impact.
- Safety Incidents (#) – Count of recorded safety incidents.
- Lost Time Injury Frequency Rate (LTIFR) – Number of injuries per million working hours.
Financial and Efficiency KPIs
- Cost per Ton (USD/ton) – Production cost efficiency.
- Inventory Turnover (ratio) – Number of times inventory is used or sold.
- Return on Assets (ROA %) – Profit relative to total assets.
- Revenue Growth (%) – Increase or decrease in total revenue over time.
These KPIs can be tailored based on your company’s goals and operations.
How the Chemical KPI Scorecard Works
The Chemical KPI Scorecard operates in a straightforward but powerful way:
- Data Input: You enter actual, target, and previous year values in the Input Data Sheet.
- Automatic Calculation: Formulas calculate MTD and YTD performance.
- Visualization: The Scorecard and KPI Trend Sheets automatically update.
- Performance Review: Managers can analyze which KPIs met or missed targets.
- Decision Making: Insights guide operational improvements and strategic planning.
Because it’s built in Excel, you can easily modify formulas, add charts, or integrate new KPIs.
How to Use the Chemical KPI Scorecard Effectively
Follow these simple steps to make the most of your KPI scorecard:
- Set Clear Targets: Define monthly and yearly goals for each KPI.
- Enter Consistent Data: Regularly update the Input Data Sheet to maintain accuracy.
- Review Trends Monthly: Use the KPI Trend sheet to identify recurring issues.
- Customize KPIs: Tailor the template to match your plant’s specific operations.
- Share Results: Present visual dashboards during team meetings for better transparency.
With these steps, the scorecard becomes a live management tool rather than a static report.
Advantages of Using a Chemical KPI Scorecard in Excel
Implementing this Excel-based solution offers multiple benefits:
Centralized Performance Tracking
All KPIs across departments — production, quality, and safety — are monitored in one place.
Easy to Customize
You can add or remove KPIs, adjust targets, and modify visuals without any coding knowledge.
Cost-Effective
No need to invest in expensive BI tools; Excel handles data visualization efficiently.
Real-Time Insights
Instantly analyze current performance with MTD and YTD data.
Improved Decision Making
Visual cues and comparisons help managers focus on areas needing attention.
Better Communication
Everyone from the production floor to top management can access clear, actionable insights.
Opportunities for Improvement
While the Chemical KPI Scorecard in Excel is powerful, there’s always room to enhance its impact:
- Automate Data Import: Link the Excel file to your ERP or production database for real-time updates.
- Add Advanced Charts: Use combo charts and sparkline visuals for richer insights.
- Integrate Macros: Include VBA buttons for easier navigation between sheets.
- Expand KPI Categories: Add sustainability, R&D, or logistics KPIs for a holistic view.
- Enable Sharing: Convert the dashboard into a shared online version using Excel 365 or Google Sheets.
Best Practices for Managing Chemical KPIs in Excel
To ensure your KPI scorecard delivers consistent and actionable insights, follow these best practices:
- Define Each KPI Clearly: Ensure everyone understands the formula and meaning.
- Keep Data Clean: Avoid blank cells or inconsistent formats in your Input Data Sheet.
- Regularly Validate Data: Check that actuals and targets are realistic and accurate.
- Use Conditional Formatting Wisely: Too many colors can overwhelm users; use simple green/red indicators.
- Protect Formulas: Lock key cells to prevent accidental edits.
- Analyze Both MTD and YTD: Month-to-date data shows short-term progress; year-to-date reveals long-term trends.
- Conduct Monthly Reviews: Discuss KPI trends with your team and set improvement actions.
- Keep the Dashboard Visual: Charts and visuals communicate faster than raw numbers.
Following these practices will help you maintain an effective and user-friendly scorecard.
Real-World Use Cases
The Chemical KPI Scorecard in Excel can be applied in multiple business scenarios:
- Manufacturing Plants: Monitor production yield, downtime, and defect rates.
- Research Laboratories: Track experiment success rates and sample throughput.
- Distribution Units: Evaluate shipment accuracy and delivery efficiency.
- Environmental Divisions: Analyze waste generation and emission performance.
- Corporate Offices: Measure revenue growth, ROI, and operational efficiency.
Each department can use the same scorecard structure with customized KPIs.
Conclusion
The Chemical KPI Scorecard in Excel is a simple yet powerful tool for organizations aiming to improve efficiency, quality, and profitability. It combines performance monitoring, trend analysis, and reporting in one platform — without requiring advanced software or technical expertise.
By using this scorecard, managers can make faster decisions, ensure compliance, and enhance overall business performance. As a result, chemical companies gain better control over operations and achieve their strategic goals with confidence.
If you’re ready to transform your performance management system, download the Chemical KPI Scorecard in Excel today and experience the difference.
Frequently Asked Questions (FAQs)
- What is a Chemical KPI Scorecard?
A Chemical KPI Scorecard is an Excel-based tool that tracks key performance indicators such as production efficiency, quality, safety, and cost metrics.
- Can I customize the KPIs in this scorecard?
Yes. You can add, remove, or modify KPIs based on your organization’s goals. The template is fully editable.
- How often should I update the data?
Ideally, update your Input Data Sheet every month. Regular updates ensure accurate MTD and YTD analysis.
- Does it require any special Excel skills?
No. The template is user-friendly and requires only basic Excel knowledge to operate.
- Can this scorecard be used by small chemical firms?
Absolutely. It’s designed for all scales of business — from small labs to large manufacturing plants.
- Is there a dashboard for visual analysis?
Yes. The Scorecard and KPI Trend Sheets provide visual charts, color indicators, and MTD/YTD performance summaries.
- Can it track environmental and safety metrics too?
Yes. You can include environmental, safety, and compliance KPIs within the same scorecard.
- How does it help in decision-making?
By comparing actuals with targets and showing trends, the scorecard helps identify problems early and supports timely decisions.
- What is the difference between MTD and YTD?
MTD (Month-to-Date) tracks progress within the current month, while YTD (Year-to-Date) accumulates performance since the start of the year.
- Where can I get the template?
You can download the ready-to-use Chemical KPI Scorecard in Excel from NextGenTemplates.com and start using it immediately.
Visit our YouTube channel to learn step-by-step video tutorials
Watch the step-by-step video tutorial:
Click to buy Chemical KPI Scorecard in Excel