Managing client invoices effectively is crucial for maintaining healthy cash flow and ensuring timely payments. The Client Billing Dashboard in Excel is a powerful, ready-to-use tool that helps businesses track invoices, monitor overdue payments, and improve collection efforts. This dashboard allows you to analyze key billing metrics in real-time, identify bottlenecks, and enhance financial reporting.
In this article, we will walk you through the key features of the Client Billing Dashboard in Excel, explain how it works, and highlight the value it can bring to your billing processes.
What is the Client Billing Dashboard in Excel?
The Client Billing Dashboard in Excel is an essential tool for businesses that need to manage and track client billing efficiently. This dashboard provides a comprehensive view of all your invoices, including payment status, overdue payments, and collection rates. By analyzing various factors such as payment delay, service type, account manager performance, and region-wise billing, this dashboard enables businesses to optimize their invoicing and payment processes.
Key Features of the Client Billing Dashboard in Excel
Click to buy Client Billing Dashboard in Excel
1) Overview Sheet Tab: A High-Level Snapshot of Your Billing
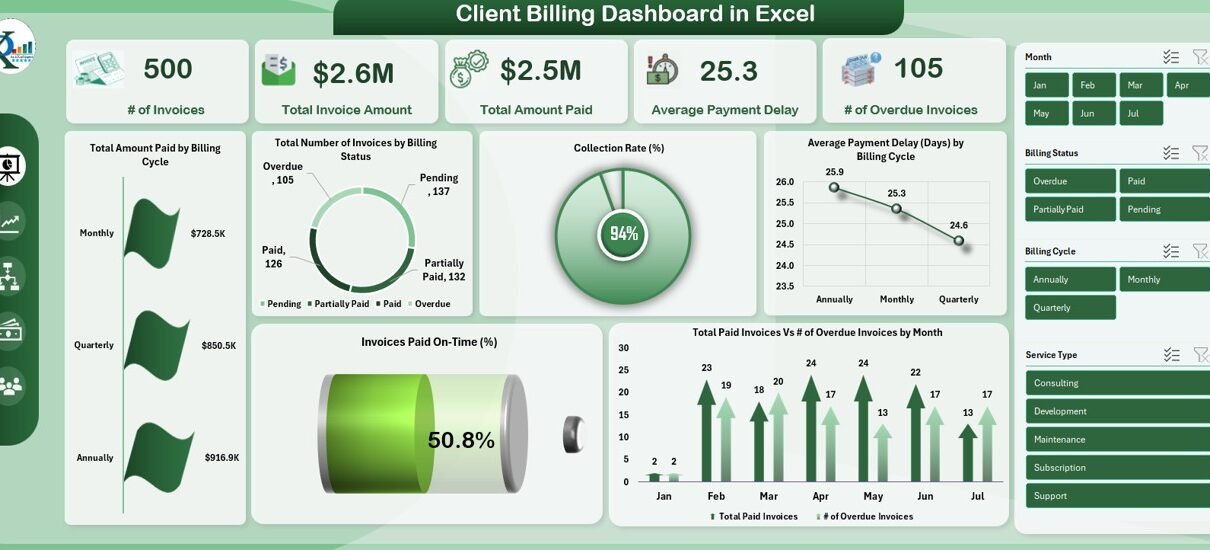
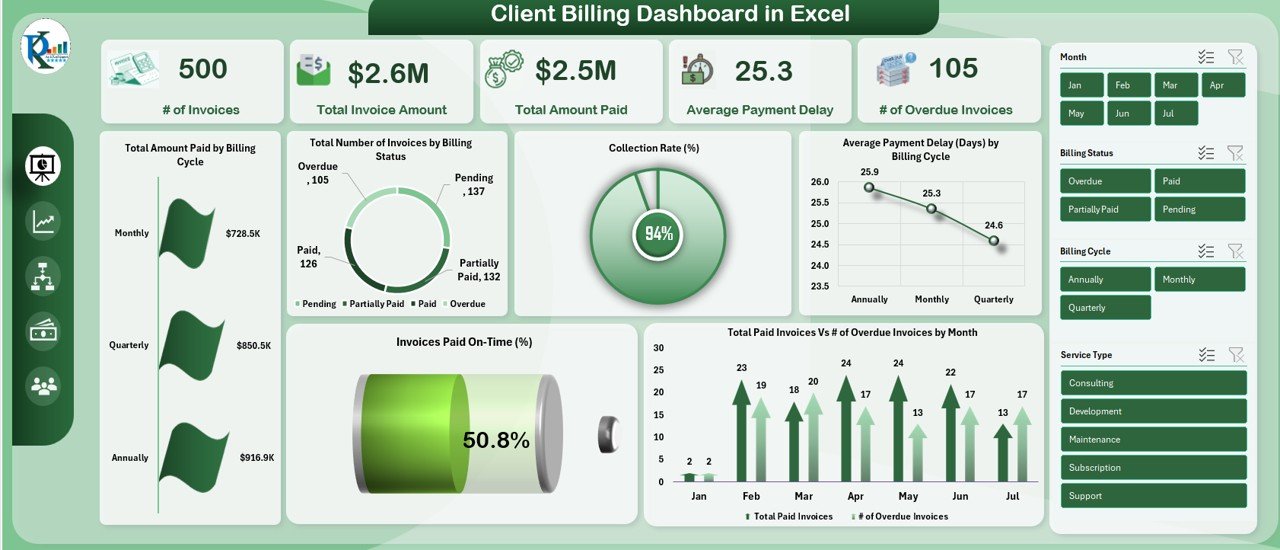
The Overview Sheet Tab offers a comprehensive summary of your billing data, helping you monitor critical billing metrics:
Cards:
- # of Invoices: Displays the total number of invoices created.
- Total Invoice Amount: Shows the total invoice amount for all clients.
- Total Amount Paid: Displays the total amount paid by clients.
- Average Payment Delay (Days): Calculates the average number of days clients take to pay their invoices.
- # of Overdue Invoices: Tracks the number of invoices that are overdue.
Charts:
- Total Amount Paid by Billing Cycle: Displays the payment distribution across different billing cycles.
- Total Number of Invoices by Billing Status: Shows the breakdown of invoices by their payment status (e.g., paid, overdue, partially paid).
- Average Payment Delay (Days) by Billing Cycle: Highlights payment delays across different billing cycles.
- Collection Rate %: Tracks the percentage of invoices paid on time.
- Invoices Paid On-Time (%): Displays the percentage of invoices paid by the due date.
- Total Paid Invoices Vs # of Overdue Invoices by Month: Visualizes the trend of paid invoices versus overdue invoices over time.
Click to buy Client Billing Dashboard in Excel
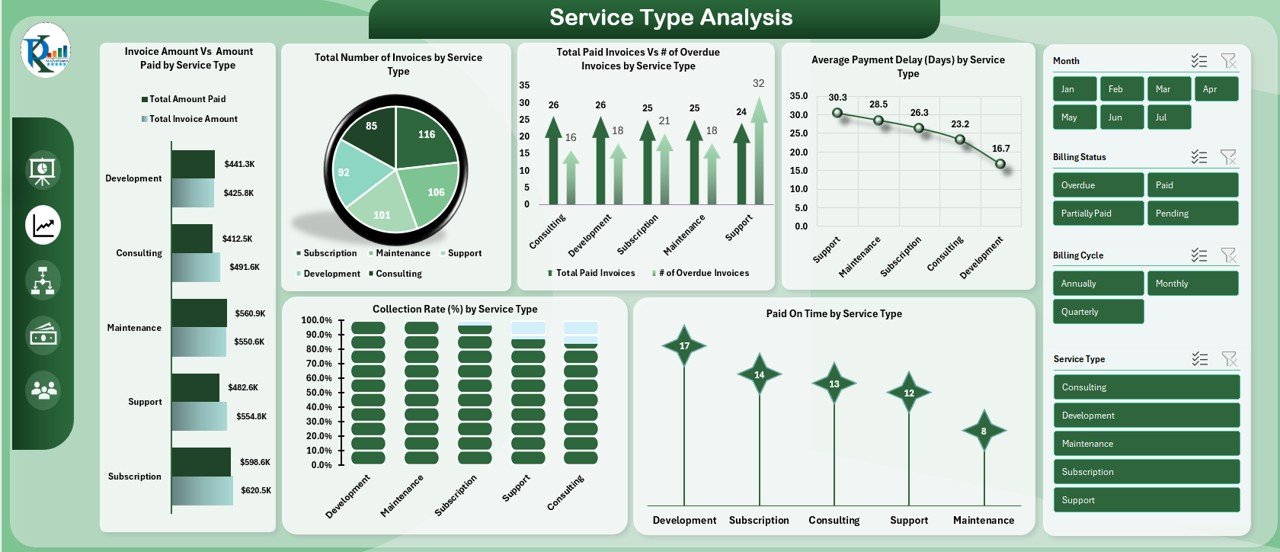
2) Service Type Analysis: In-Depth Billing Insights by Service
The Service Type Analysis tab provides detailed insights into billing performance based on service types:
Charts:
- Invoice Amount Vs Amount Paid by Service Type: Shows the comparison of total invoiced amounts versus amounts actually paid, broken down by service type.
- Total Number of Invoices by Service Type: Displays the total number of invoices generated for each service type.
- Total Paid Invoices Vs # of Overdue Invoices by Service Type: Compares the number of paid invoices versus overdue invoices for each service type.
- Average Payment Delay (Days) by Service Type: Analyzes the average payment delay for each service type.
- Paid On Time by Service Type: Tracks the percentage of invoices paid on time, segmented by service type.
- Collection Rate (%) by Service Type: Measures the collection rate for each service type.
This tab helps identify trends in payment delays and allows you to optimize payment collection based on specific services offered.
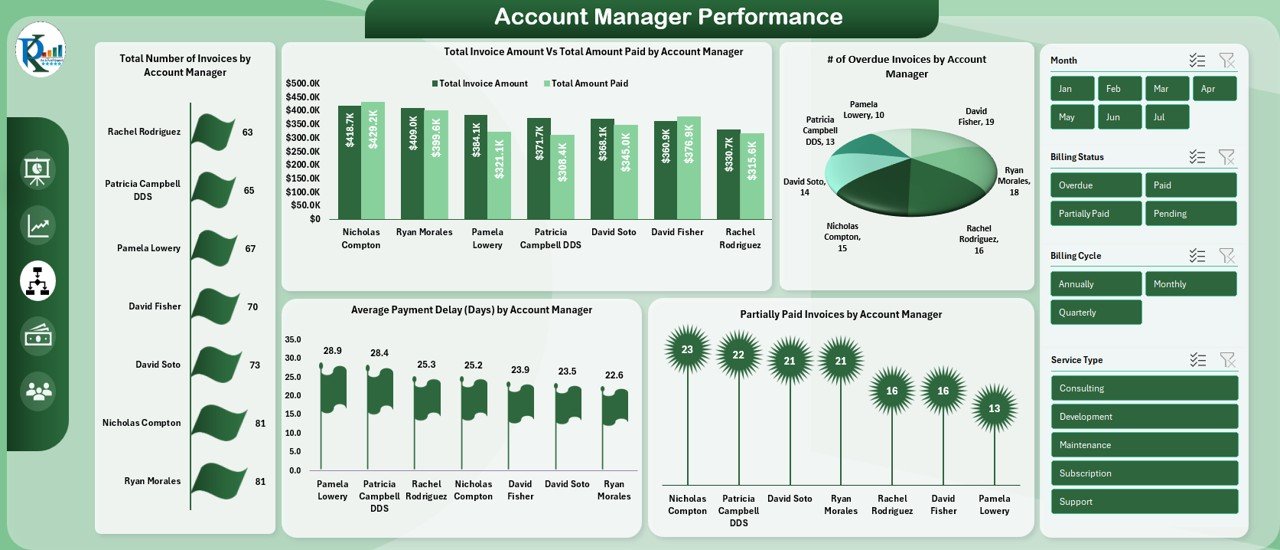
3) Account Manager Performance: Evaluating Billing Effectiveness
The Account Manager Performance tab helps monitor the effectiveness of your account managers in managing and collecting payments:
Charts:
- Total Number of Invoices by Account Manager: Shows the number of invoices managed by each account manager.
- Total Invoice Amount Vs Total Amount Paid by Account Manager: Compares the total invoiced amounts with the amounts collected for each account manager.
- # of Overdue Invoices by Account Manager: Tracks the number of overdue invoices for each account manager.
- Partially Paid Invoices by Account Manager: Displays the number of invoices that have been partially paid, organized by account manager.
- Average Payment Delay (Days) by Account Manager: Measures the average delay in payments handled by each account manager.
This tab provides a clear view of each account manager’s performance, helping businesses identify high-performing managers and those who may need additional support.
Click to buy Client Billing Dashboard in Excel
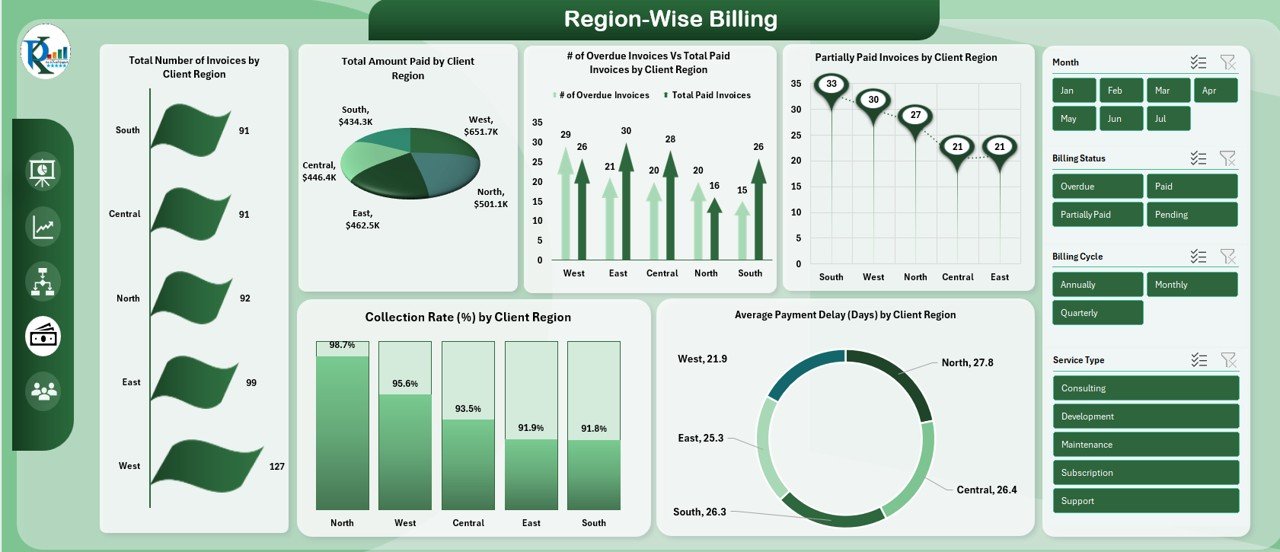
4) Region-Wise Billing: Insights Based on Client Location
The Region-Wise Billing tab enables you to monitor billing performance across different geographical regions:
Charts:
- Total Number of Invoices by Client Region: Displays the number of invoices generated per region.
- Total Amount Paid by Client Region: Shows the total amount paid by clients in each region.
- # of Overdue Invoices Vs Total Paid Invoices by Client Region: Compares overdue invoices to paid invoices for each region.
- Partially Paid Invoices by Client Region: Displays the number of partially paid invoices by region.
- Average Payment Delay (Days) by Client Region: Tracks average payment delays by region.
- Collection Rate (%) by Client Region: Measures the percentage of invoices paid on time by clients in each region.
This tab helps you understand regional trends in billing, allowing you to target specific areas for improvement in payment collection.
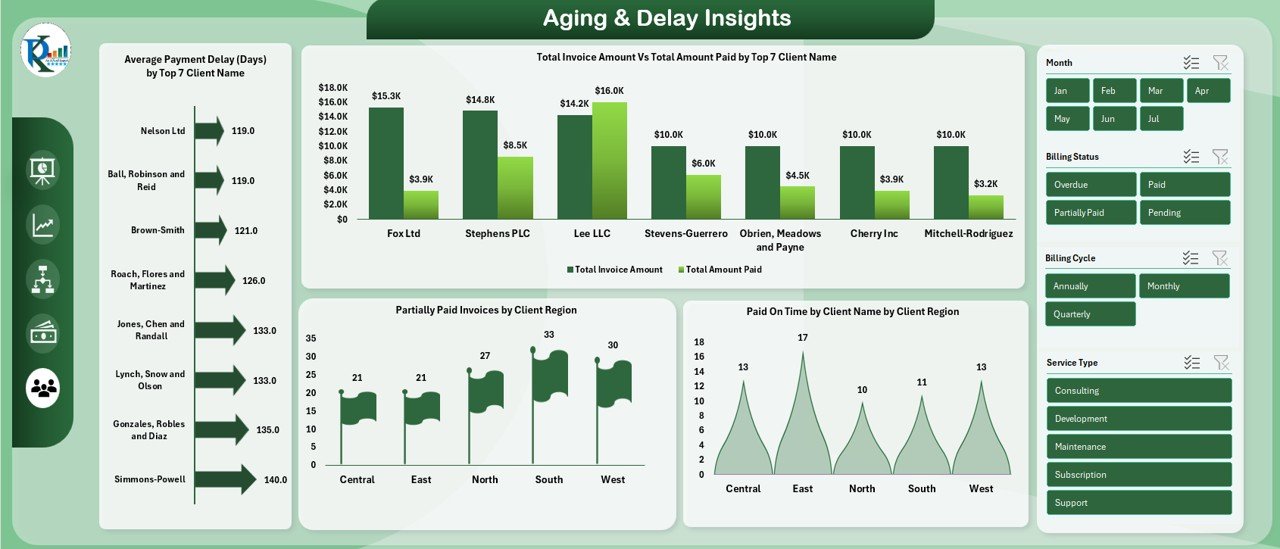
5) Aging & Delay Insights: Understanding Payment Delays
The Aging & Delay Insights tab helps track payment delays and provides insight into the most delayed invoices:
Charts:
- Average Payment Delay (Days) by Top 7 Client Name: Displays the top clients based on payment delays.
- Total Invoice Amount Vs Total Amount Paid by Top 7 Client Name: Compares the total invoiced amounts with the amounts paid by top clients.
- Paid On Time by Client Name by Client Region: Tracks the percentage of invoices paid on time by clients in different regions.
- Partially Paid Invoices by Client Region: Shows the percentage of invoices that have been partially paid for top clients.
This tab helps you identify your most critical clients in terms of payment delays, which can help you focus your efforts on collecting payments from these clients.
Click to buy Client Billing Dashboard in Excel
6) Data Sheet Tab: Input Data Management
The Data Sheet Tab is where all the invoice-related data is stored. It includes the following key fields:
Benefits of Using the Client Billing Dashboard in Excel
The Client Billing Dashboard in Excel offers several key benefits:
-
Enhanced Financial Monitoring: Easily track the status of all invoices, monitor overdue payments, and measure collection rates.
-
Data-Driven Decision Making: The dashboard provides valuable insights into payment trends, helping businesses make informed decisions about client relationships and collections.
-
Improved Cash Flow Management: By highlighting overdue invoices, the dashboard helps prioritize collections and improve cash flow.
-
Performance Tracking: Monitor the performance of account managers and regions to ensure timely payments.
-
Customizable: The dashboard is fully customizable, allowing you to adjust it to fit your business’s specific needs.
Conclusion
Click to buy Client Billing Dashboard in Excel
The Client Billing Dashboard in Excel is a powerful tool for managing billing operations, tracking payments, and improving the efficiency of your invoicing process. With detailed charts, cards, and analysis, this dashboard provides valuable insights that help businesses stay on top of their invoicing, minimize overdue payments, and optimize collection efforts.
Frequently Asked Questions (FAQs)
1. How can I track overdue invoices in the dashboard?
You can track overdue invoices by using the Overdue Invoices card in the Overview Sheet Tab, which displays the total number of overdue invoices.
2. Can I monitor the performance of specific account managers?
Yes, the Account Manager Performance tab allows you to track the number of invoices, the total amount collected, and the performance of each account manager.
3. How can I see the billing status by region?
The Region-Wise Billing tab provides insights into billing performance across different regions, including the total number of invoices, amount paid, and overdue invoices.
4. Can I customize the dashboard for my needs?
Yes, the dashboard is fully customizable. You can add or remove columns, modify charts, and adjust the data to meet your organization’s needs.
5. How do I input data into the dashboard?
The Data Sheet Tab is where you input all the relevant data. You can enter invoice-related information such as client name, invoice date, payment status, and amount paid.
Visit our YouTube channel to learn step-by-step video tutorials
Click to buy Client Billing Dashboard in Excel