Introduction
The Coding Bootcamps KPI Dashboard is a comprehensive and ready-to-use Excel template designed to help coding bootcamp administrators track and analyze their key performance indicators (KPIs) efficiently. This dashboard consolidates all vital data into one place, empowering users to make data-driven decisions and monitor monthly and yearly performance effectively.
Key Features of Coding Bootcamps KPI Dashboard
- Comprehensive 7-sheet layout covering all aspects of KPI tracking and analysis.
- Interactive dropdown selectors for dynamic data visualization.
- Conditional formatting including up/down arrows highlighting KPI trends.
- Separate input sheets for Actual, Target, and Previous Year data to ensure organized data entry.
- Insightful trend charts for KPI progress monitoring.
- Detailed KPI definitions with unit, formula, and performance type indicators.
- Easy navigation through a Home sheet with clickable buttons.
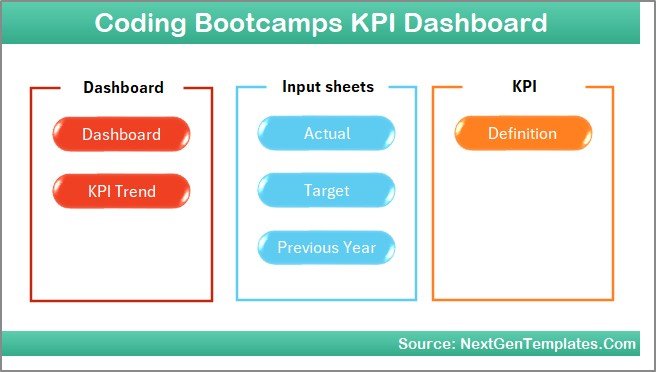
Dashboard Pages Explanation
1. Home Sheet
The Home sheet serves as the dashboard’s index page. It contains six buttons that allow users to jump quickly to respective sheets. This sheet enhances user experience by providing a centralized navigation hub.
 Home Page
Click to Buy Coding Bootcamps KPI Dashboard in Excel
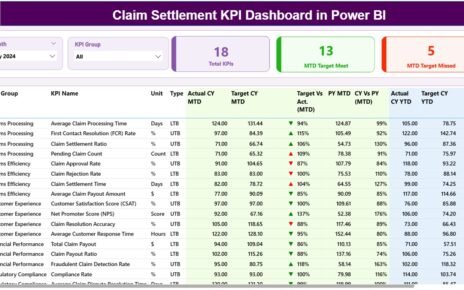
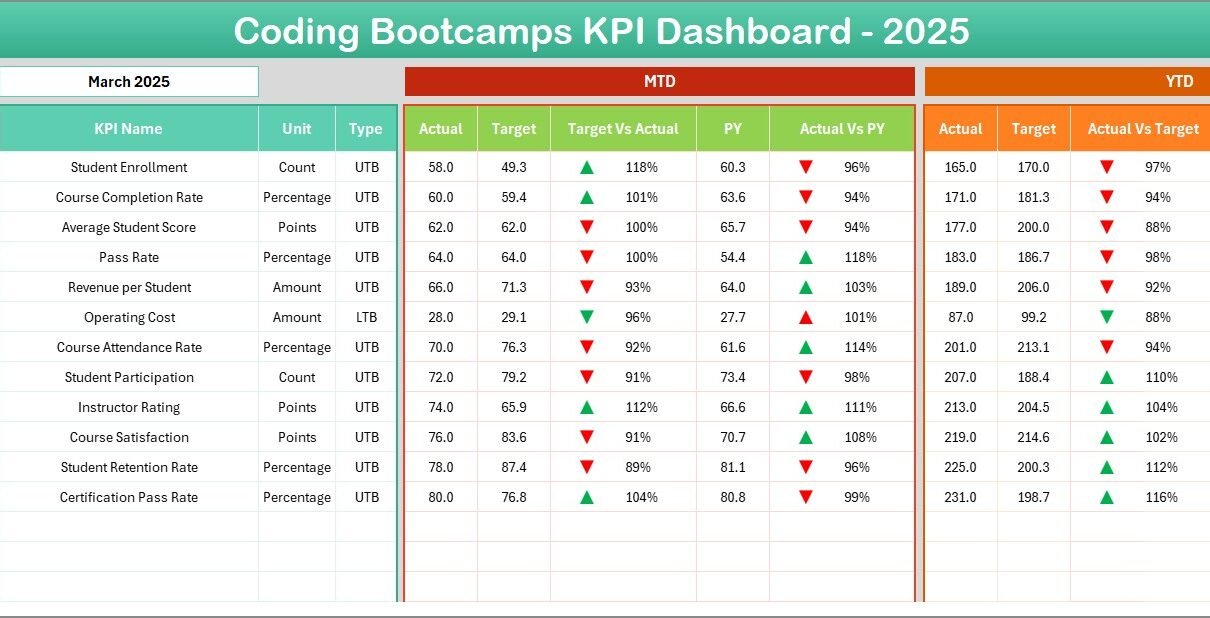
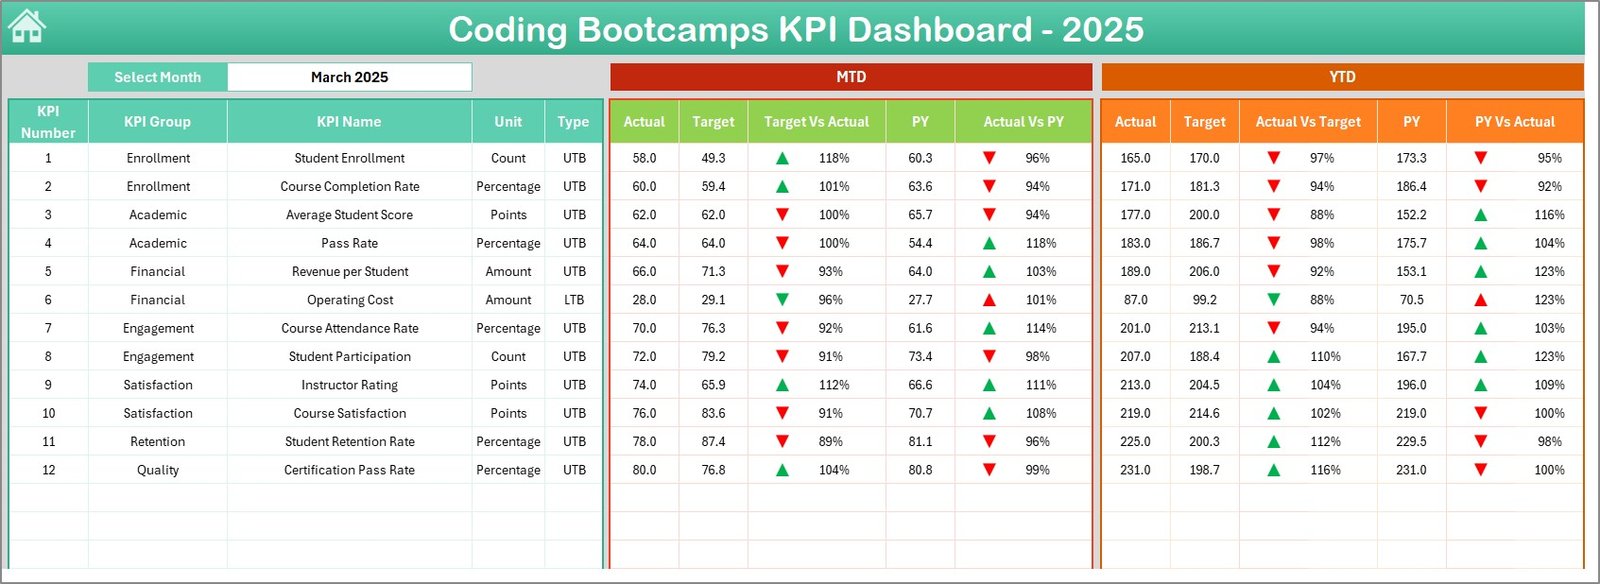
2. Dashboard Sheet
This is the main overview sheet displaying all KPIs with key data points. Users can select the month from a dropdown at cell D3, which dynamically updates the dashboard numbers.
- Displays Month-To-Date (MTD) Actual, Target, Previous Year data.
- Shows comparison between Target vs Actual and Previous Year (PY) vs Actual using conditional formatting arrows to indicate trends.
- Includes Year-To-Date (YTD) summaries of Actual, Target, and Previous Year data with similar trend indicators.
 Coding Bootcamps KPI Dashboard
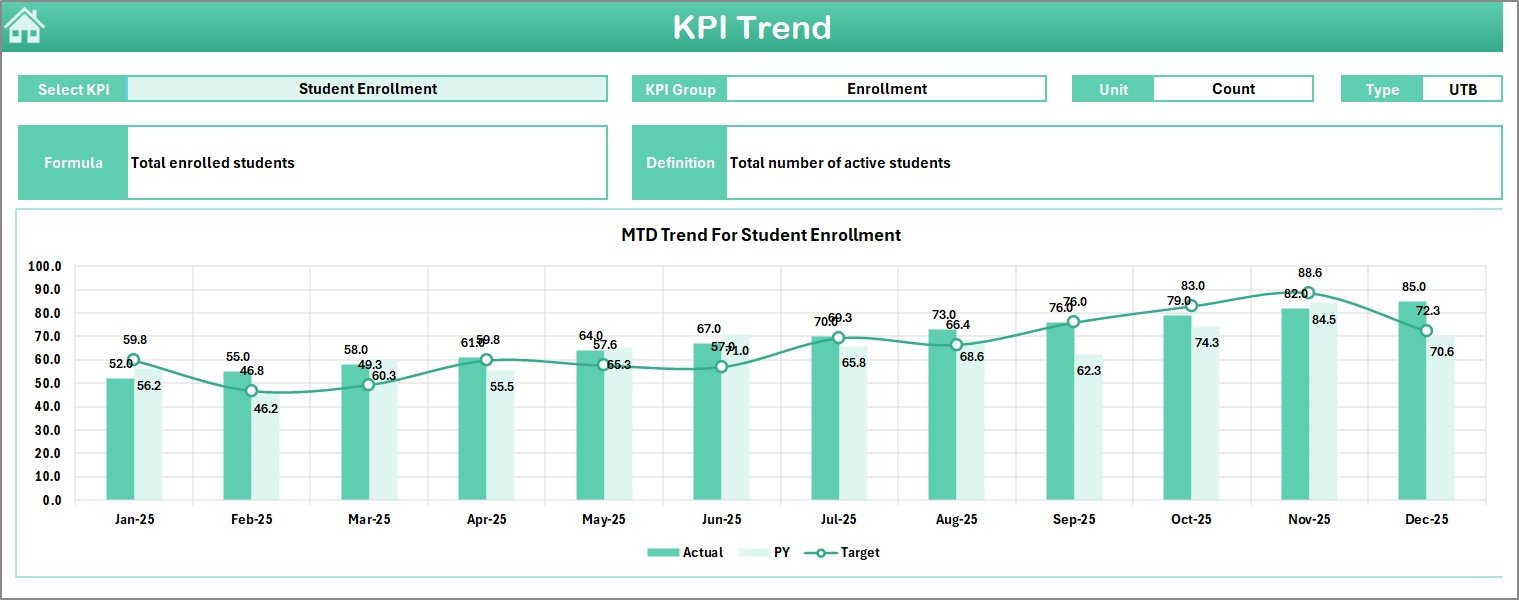
3. KPI Trend Sheet
This sheet allows you to select a particular KPI from the dropdown menu at cell C3. It provides detailed information including:
- KPI Group
- Unit of KPI
- Type of KPI – Lower The Better (LTB) or Upper The Better (UTB)
- Formula used to compute the KPI
- KPI definition to clarify its context and purpose
Additionally, this sheet visualizes MTD and YTD trend charts for Actual, Target, and Previous Year values enabling easy performance tracking.
 KPI Trend Sheet
Click to Buy Coding Bootcamps KPI Dashboard in Excel
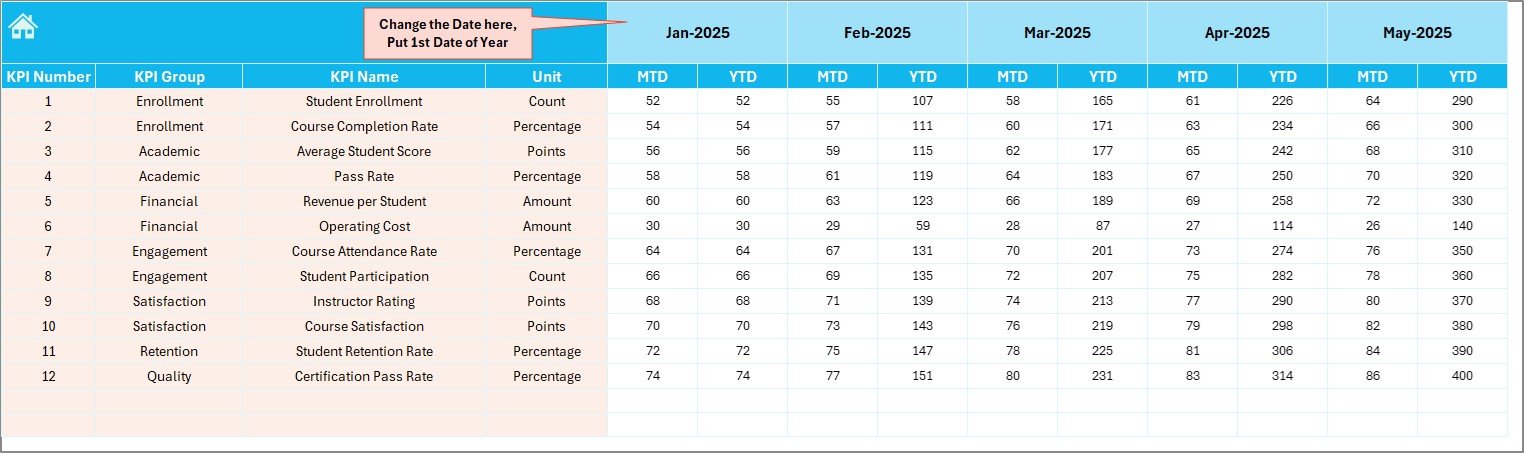
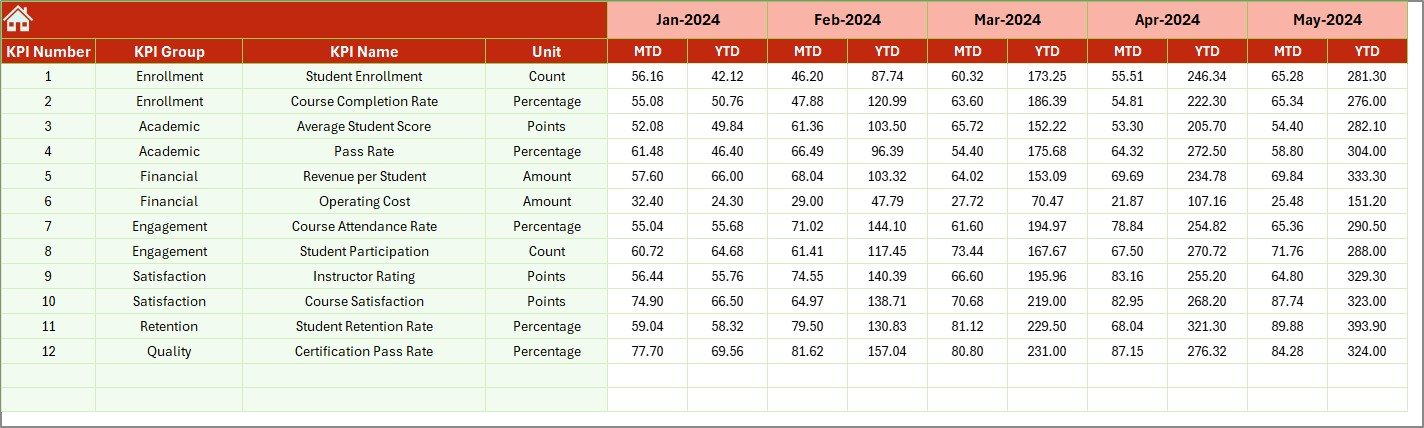
4. Actual Numbers Input Sheet
This sheet is dedicated to entering the actual numbers for both YTD and MTD for each month. Users can adjust the starting month of the year by changing cell E1 to reflect the first month.
 Actual Numbers Input sheet
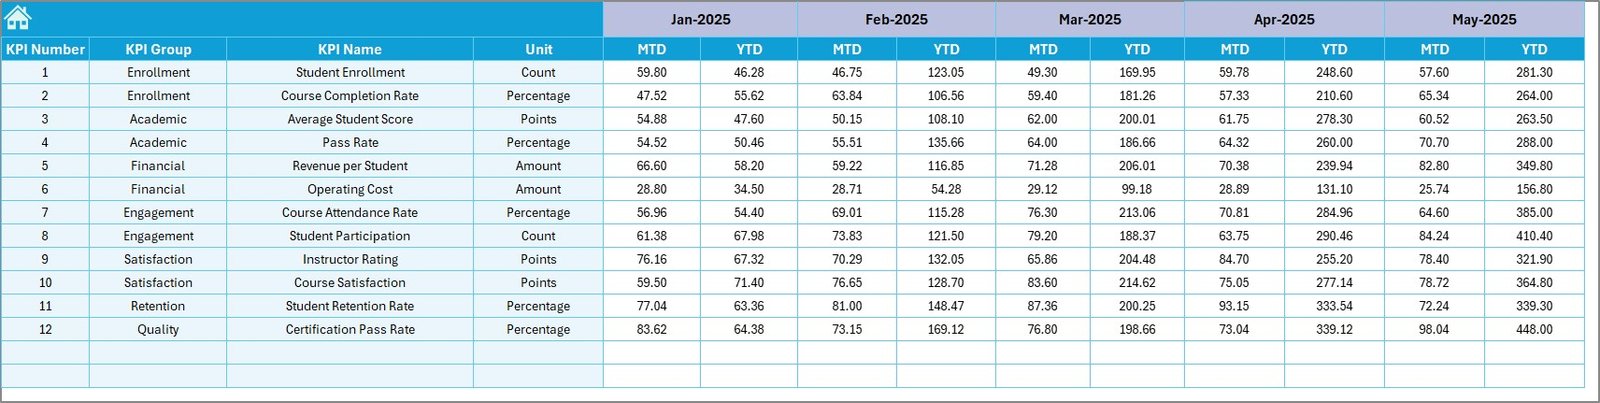
5. Target Number Input Sheet
In this tab, users input the target numbers for each KPI on a monthly basis. The sheet tracks both MTD and YTD target values, allowing for precise goal setting.
 Target Number Input sheet
Click to Buy Coding Bootcamps KPI Dashboard in Excel
6. Previous Year Number Sheet
This sheet is used to record the previous year’s numbers, mirroring the structure of the current year’s input sheets. This data is essential for year-over-year comparisons.
 Previous Year Number Input sheet
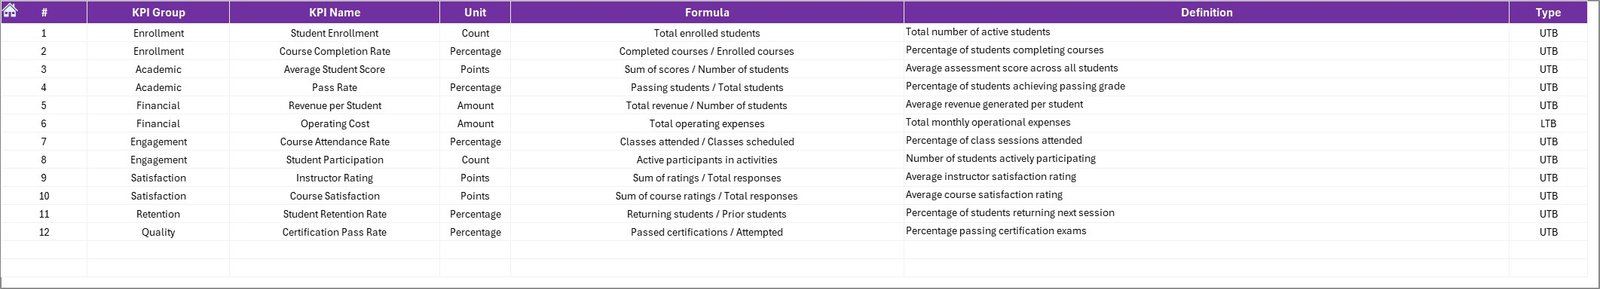
7. KPI Definition Sheet
To ensure clarity across all metrics, this sheet holds detailed information on each KPI, including:
- KPI Name
- KPI Group
- Unit
- Formula for calculation
- Definition
- KPI type: Lower The Better (LTB) or Upper The Better (UTB)
 KPI Definition sheet
Click to Buy Coding Bootcamps KPI Dashboard in Excel
Advantages of Coding Bootcamps KPI Dashboard
- Enhanced data visibility: All KPIs and related data are consolidated in one place.
- Time-saving: Pre-built charts and formulas reduce setup time.
- Accurate tracking: Conditional formatting and trend visuals help detect performance changes quickly.
- Customizable: Dropdown menus and input sheets allow users to tailor the dashboard to their specific bootcamp dynamics.
- Improved decision-making: Comprehensive data insights support strategic planning and resource allocation.
Opportunities for Improvement
- Adding automated alerts for KPIs falling below thresholds could further boost responsiveness.
- Integration with live data sources or APIs for real-time update capabilities.
- Mobile-friendly dashboard views to facilitate monitoring on-the-go.
- Expanding chart types for more advanced data visualization.
Best Practices
Click to Buy Coding Bootcamps KPI Dashboard in Excel
- Regularly update Actual, Target, and Previous Year sheets to ensure up-to-date analysis.
- Validate data inputs to reduce errors in calculations.
- Utilize the KPI Definition sheet thoroughly to align team understanding of each metric.
- Review dashboard monthly to track trends and make timely adjustments.
- Leverage the interactive dropdowns for customized views and deeper insights.
FAQs
Can I customize the KPIs in this dashboard?
Yes, the KPI Definition sheet allows you to add, modify, or remove KPIs, including their formulas and definitions, to fit your bootcamp’s unique metrics.
Is this dashboard compatible with Google Sheets?
While this template is optimized for Microsoft Excel, you can import it into Google Sheets. However, some advanced features like conditional formatting and drop-down menus may behave differently.
How often should I update the Actual and Target numbers?
It’s recommended to update these inputs at least monthly to reflect accurate and timely KPI tracking.
Conclusion
Click to Buy Coding Bootcamps KPI Dashboard in Excel
The Coding Bootcamps KPI Dashboard is a powerful, user-friendly tool for managing and tracking performance indicators efficiently. With its structured design, interactive features, and clear data visualization, bootcamp managers can ensure they stay on top of their goals and make informed decisions. This ready-to-use template simplifies KPI monitoring, saving time and helping to align operational efforts for maximum impact.
For more detailed insights and to see this dashboard in action, visit our YouTube channel to watch the demo.
For further reference on KPI best practices and dashboard design, consider visiting the Microsoft Excel Official Support.
Click to Buy Coding Bootcamps KPI Dashboard in Excel