In the world of supply chain management, time and temperature mean everything. Cold chain logistics ensures that temperature-sensitive products—like vaccines, frozen foods, and biopharmaceuticals—reach their destinations safely and efficiently. However, managing this intricate network requires constant monitoring, accurate data, and real-time insights. That’s where the Cold Chain Logistics KPI Dashboard in Power BI steps in.
This ready-to-use dashboard is a game-changer for logistics professionals. It empowers teams to monitor key performance indicators (KPIs), track efficiency, and ensure compliance—all through interactive visuals and dynamic data connections.
In this article, you’ll explore what this dashboard offers, its structure, benefits, best practices, and why it’s an essential tool for any organization operating in temperature-controlled logistics.
Click to buy Cold Chain Logistics KPI Dashboard in Power BI
What Is a Cold Chain Logistics KPI Dashboard in Power BI?
A Cold Chain Logistics KPI Dashboard is a performance-tracking solution built using Microsoft Power BI, designed specifically for cold chain and temperature-sensitive supply operations. It consolidates critical KPIs like delivery performance, temperature compliance, spoilage rate, and cost efficiency into one visual interface.
By integrating with Excel data sources, the dashboard automates updates, provides real-time visibility, and transforms raw logistics data into actionable insights. Whether you’re a logistics manager, warehouse supervisor, or supply chain analyst, this tool gives you everything you need to stay on top of performance metrics.
Why Cold Chain Logistics Needs KPI Monitoring
Cold chain logistics involves more than transportation—it’s about maintaining product integrity from the point of origin to delivery. Here are some reasons why monitoring KPIs is crucial:
- Ensures Temperature Compliance: Continuous tracking helps maintain the required temperature range for perishable goods.
- Prevents Spoilage: By detecting temperature breaches or delays early, businesses reduce wastage.
- Improves Operational Efficiency: Tracking transit times, warehouse efficiency, and delivery accuracy helps optimize routes and resources.
- Strengthens Customer Trust: Consistent performance builds reliability with clients and regulatory bodies.
- Supports Decision-Making: KPI dashboards transform scattered data into strategic insights, enabling data-driven decisions.
Structure of the Cold Chain Logistics KPI Dashboard
The Cold Chain Logistics KPI Dashboard in Power BI is organized into three key pages, each offering a unique analytical perspective.
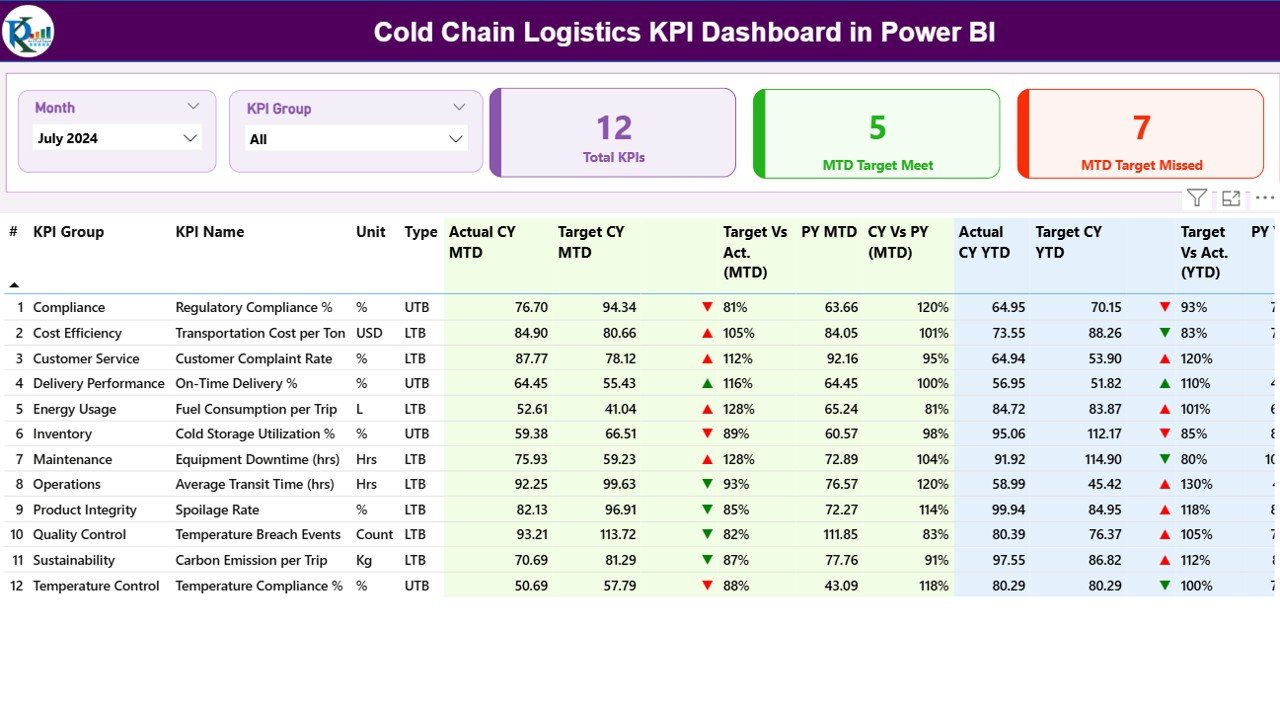
Summary Page: The Performance Overview
The Summary Page serves as the control center of the dashboard. It gives a holistic view of how your KPIs are performing across time and categories.
Key Elements of the Summary Page:
- Month and KPI Group Slicers: These filters allow users to view metrics by specific months or KPI categories, such as delivery, storage, or transportation.
- Performance Cards:
- Total KPIs Count – Displays how many KPIs are being tracked.
- MTD Target Met Count – Shows how many KPIs achieved their Month-to-Date targets.
- MTD Target Missed Count – Highlights underperforming KPIs.
- Detailed KPI Table
The main table below these cards contains essential information, including:
- KPI Number: The sequence identifier for each KPI.
- KPI Group: The functional area of the KPI (e.g., Transport, Warehouse, Quality).
- KPI Name: The specific indicator, such as Temperature Compliance Rate or On-Time Delivery Percentage.
- Unit: The unit of measurement, such as percentage (%), count, or hours.
- Type: The performance type — LTB (Lower the Better) or UTB (Upper the Better).
Performance Indicators:
- Actual CY MTD: Current Year’s Month-to-Date actual value.
- Target CY MTD: The MTD target value for the same period.
- MTD Icon: Red and green arrows (▼ and ▲) represent whether the KPI is meeting or missing the target.
- Target vs Actual (MTD): Percentage comparison using the formula:
= (Actual / Target) × 100 - PY MTD: Previous Year’s MTD value for comparison.
- CY vs PY (MTD): Trend comparison between current and previous MTD using:
= (CY MTD / PY MTD) × 100 - Actual CY YTD / Target CY YTD: Year-to-Date comparisons.
- YTD Icons: Red and green visuals indicate overall performance trends.
- CY vs PY (YTD): Long-term progress analysis for strategic insights.
Together, these visuals create a clear picture of organizational health, allowing managers to spot strengths and address weaknesses instantly.
Click to buy Cold Chain Logistics KPI Dashboard in Power BI
KPI Trend Page: Tracking Performance Over Time
The KPI Trend Page takes analysis a step further. It provides a visual representation of how each KPI has performed over time.
Core Features:
- Combo Charts:
- These dual-axis charts display Actual vs Target values for both MTD (Month-to-Date) and YTD (Year-to-Date).
- Trends for Current Year, Previous Year, and Targets are compared visually to reveal seasonality, fluctuations, or consistent performance.
- Interactive Slicers:
- A KPI Name slicer allows users to select individual KPIs for focused analysis.
- Visual Patterns:
- Steady trends indicate operational stability.
- Sharp spikes or dips may signal disruptions like delayed deliveries or temperature excursions.
- This page helps logistics analysts identify bottlenecks early, maintain compliance, and predict performance outcomes for future months.

Click to buy Cold Chain Logistics KPI Dashboard in Power BI
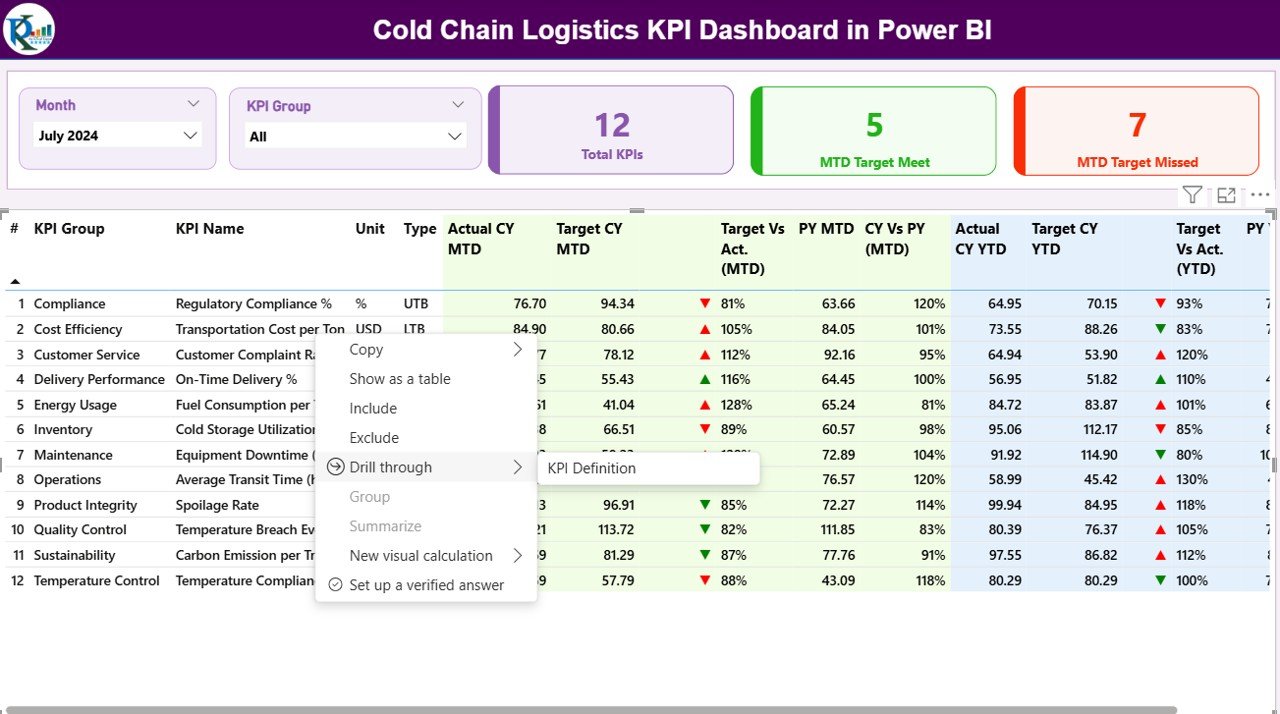
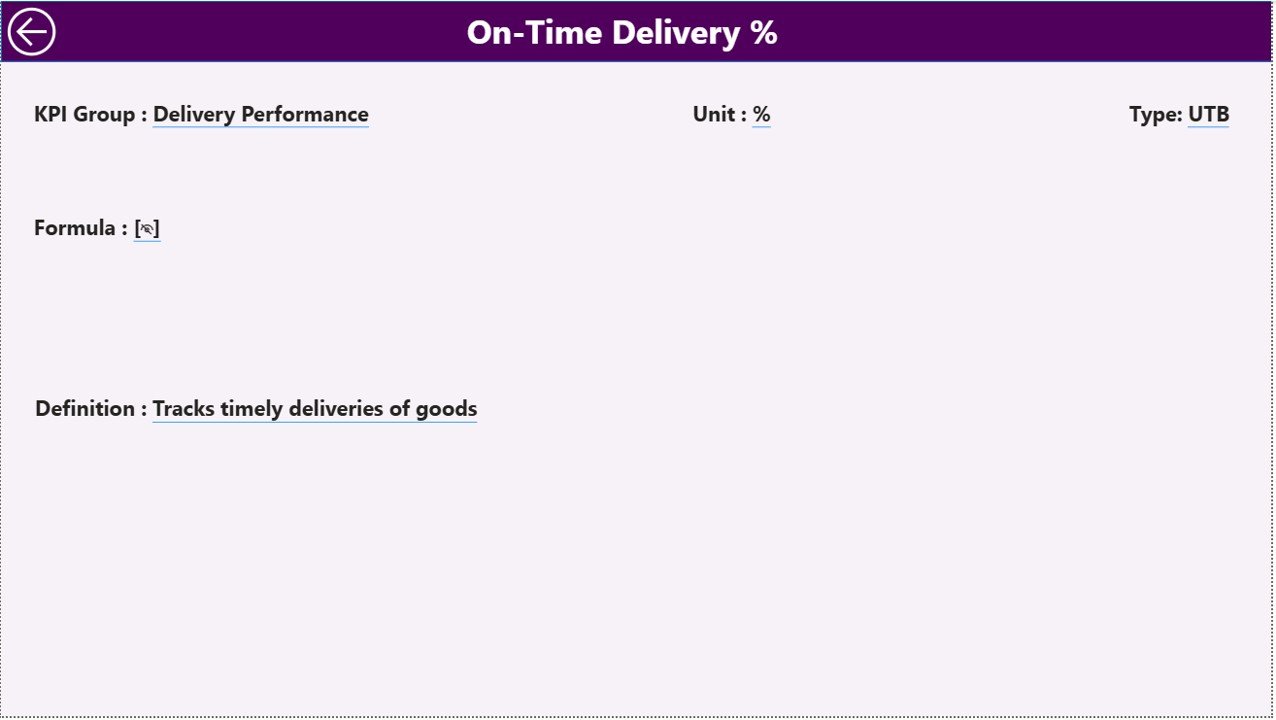
KPI Definition Page: The Data Foundation
The KPI Definition Page is a hidden, drill-through page accessible from the Summary Page. It serves as a reference sheet for understanding each KPI in detail.
Includes:
- KPI Number – Unique identification for each KPI.
- KPI Group – The operational area or department it belongs to.
- KPI Name – The descriptive name of the KPI.
- Unit, Formula, and Definition – Helps ensure every stakeholder interprets KPIs consistently.
- Type (LTB/UTB) – Clarifies performance expectations.
A “Back” button on the top-left corner allows users to return to the main page easily after drilling down.
Click to buy Cold Chain Logistics KPI Dashboard in Power BI
Excel Data Integration: Simple and Effective
The dashboard connects seamlessly to an Excel data source, making it easy to maintain and refresh.
Three Input Sheets:
- Input_Actual Sheet
- Enter Actual numbers for each KPI.
- Include KPI Name, Month (first date of the month), MTD values, and YTD values.
- Input_Target Sheet
- Record Target values for the same KPIs and time periods.
- KPI Definition Sheet
- Define each KPI clearly with KPI Number, Group, Unit, Formula, Definition, and Type.
This structure keeps the Power BI dashboard dynamic—once the Excel file is updated, Power BI automatically refreshes the visuals, ensuring your insights are always current.
Advantages of Using a Cold Chain Logistics KPI Dashboard
Implementing a KPI dashboard in Power BI offers several tangible and strategic benefits.
- Real-Time Performance Monitoring
The dashboard displays updated metrics instantly. Teams can react quickly to deviations in temperature or delays before they escalate into losses.
- Data-Driven Decision Making
With dynamic visuals, managers can compare trends, evaluate performance, and allocate resources based on real numbers instead of assumptions.
- Enhanced Transparency
Everyone—from warehouse teams to top management—gets a unified view of the operation, promoting accountability and cross-departmental coordination.
- Reduced Product Loss
Tracking temperature breaches and delivery times reduces spoilage, directly impacting profitability.
- Improved Compliance
The dashboard helps ensure that each operation meets regulatory requirements related to food safety, pharmaceuticals, and cold storage standards.
- Cost Optimization
By analyzing cost-related KPIs, businesses identify inefficiencies and optimize routes, storage, and labor use.
- Predictive Analysis
With Power BI’s forecasting capabilities, logistics managers can predict performance trends and prepare preventive measures in advance.
How Power BI Elevates Cold Chain Analytics
Power BI brings several advanced capabilities that make it an ideal platform for cold chain performance tracking:
- Interactive Visuals: Heat maps, combo charts, and KPI cards make data intuitive.
- Automated Refresh: No need to update reports manually. Excel data updates auto-refresh the dashboard.
- Drill-Through Functionality: Dive deeper into each KPI for detailed analysis.
- Cloud Access: View dashboards from any device, anywhere, ensuring 24×7 visibility.
- Security and Sharing: Role-based access and secure publishing for teams and clients.
Best Practices for the Cold Chain Logistics KPI Dashboard
To make the most of your dashboard, follow these practical guidelines:
- Define Clear KPIs
Avoid tracking too many indicators. Focus on KPIs that align with business goals—such as temperature compliance, delivery time, and spoilage.
- Maintain Data Accuracy
Ensure the Excel source data is consistently formatted and validated before importing into Power BI.
- Automate Data Refresh
Set automatic refresh schedules to keep visuals and reports updated without manual effort.
- Use Conditional Formatting
Color-coded visuals help highlight performance instantly—green for success, red for concern.
- Segment by Region or Product Type
Filter analysis by geography, warehouse, or product category for deeper insights.
- Benchmark Against Industry Standards
Compare performance metrics with industry norms to identify competitive advantages or gaps.
- Train Users
Provide short training sessions to help staff interpret data accurately and use filters effectively.
- Continuously Evolve
Regularly review and update KPIs as business objectives or compliance standards change.
Real-World Applications
The Cold Chain Logistics KPI Dashboard is widely used in industries such as:
- Pharmaceuticals: To monitor vaccine and medicine temperature integrity.
- Food & Beverages: For tracking freshness and minimizing spoilage during transport.
- Biotechnology: To ensure research samples remain viable during transfers.
- Retail & E-Commerce: To guarantee timely delivery of perishable goods to customers.
Each sector benefits from precise temperature tracking and real-time alerts, preventing costly product losses.
Conclusion
The Cold Chain Logistics KPI Dashboard in Power BI isn’t just a reporting tool—it’s a performance accelerator. By centralizing KPIs, integrating Excel data, and visualizing trends, it empowers logistics managers to maintain control, minimize risk, and boost efficiency.
From temperature tracking to delivery performance, every metric tells a story—and Power BI helps you read it instantly. Whether you manage pharmaceuticals, perishable foods, or biotech shipments, this dashboard gives you the clarity to act fast and make data-driven decisions confidently.
Frequently Asked Questions (FAQs)
- What is a Cold Chain Logistics KPI Dashboard?
It’s a Power BI-based dashboard designed to monitor temperature-sensitive logistics performance using key metrics like temperature compliance, on-time delivery, and spoilage rate.
- What data sources does this dashboard use?
It connects to an Excel file with three sheets—Actuals, Targets, and KPI Definitions. Once you update the Excel data, the dashboard automatically refreshes.
- Can I customize the KPIs?
Yes. You can modify KPI names, formulas, and visuals to match your organization’s requirements.
- How does this dashboard help reduce spoilage?
It tracks temperature deviations and transit times, allowing managers to take immediate corrective actions before losses occur.
- Is this dashboard suitable for small businesses?
Absolutely. Small and medium-sized enterprises can use this ready-to-use Power BI dashboard to improve efficiency without large investments in IT infrastructure.
- Can I access the dashboard remotely?
Yes. With Power BI’s cloud service, you can view and interact with the dashboard from any device, anywhere.
- What skills are needed to use this dashboard?
Basic Power BI navigation skills are sufficient. No coding or advanced analytics expertise is required.
- How often should I update the data?
Ideally, update monthly for MTD/YTD analysis, or more frequently for real-time operations.
- How does this dashboard improve decision-making?
It consolidates data into one view, provides instant insights, and highlights deviations—helping decision-makers act quickly.
- Where can I get this dashboard?
You can download the Cold Chain Logistics KPI Dashboard in Power BI from NextGenTemplates.com, where it’s available as a ready-to-use, customizable file.
Visit our YouTube channel to learn step-by-step video tutorials
Watch the step-by-step video tutorial:
lick to buy Cold Chain Logistics KPI Dashboard in Power BI