In today’s consulting industry, information moves fast and clients expect measurable results. Successful consulting firms rely on Key Performance Indicators (KPIs) to track performance, manage efficiency, and improve client satisfaction. However, managing dozens of KPIs across projects, departments, and consultants can quickly become overwhelming without the right tools.
That’s where the Consulting KPI Dashboard in Excel comes in — a dynamic, ready-to-use solution designed to help consulting businesses measure, analyze, and visualize performance effortlessly.
This comprehensive article explores what the dashboard is, how it works, its structure, advantages, best practices, and everything you need to know to get started.
Click to buy Consulting KPI Dashboard in Excel
What Is a Consulting KPI Dashboard in Excel?
A Consulting KPI Dashboard in Excel is a structured performance-monitoring tool that consolidates all key business metrics into one interactive Excel workbook. It provides a real-time view of how your consulting firm is performing across various parameters such as:
- Project delivery timelines
- Consultant utilization rates
- Client satisfaction scores
- Revenue vs. target comparison
- Billable hours and profitability
Instead of relying on multiple reports or manual calculations, this Excel dashboard centralizes all your KPIs into one easily accessible file. With a few clicks, you can evaluate Month-to-Date (MTD) and Year-to-Date (YTD) progress and compare it against both targets and previous-year performance.
Why Every Consulting Firm Needs a KPI Dashboard
In consulting, every decision affects profitability and client relationships. Without an integrated system to track KPIs, it becomes nearly impossible to identify weak areas or optimize performance.
A KPI dashboard in Excel helps consulting managers and executives:
Make data-driven decisions based on facts, not assumptions.
Identify underperforming areas before they impact client outcomes.
Measure the effectiveness of consultants and project teams.
Provide transparent reporting to clients and stakeholders.
Align business goals with operational execution.
Simply put, this dashboard is the control center for your consulting firm’s performance.
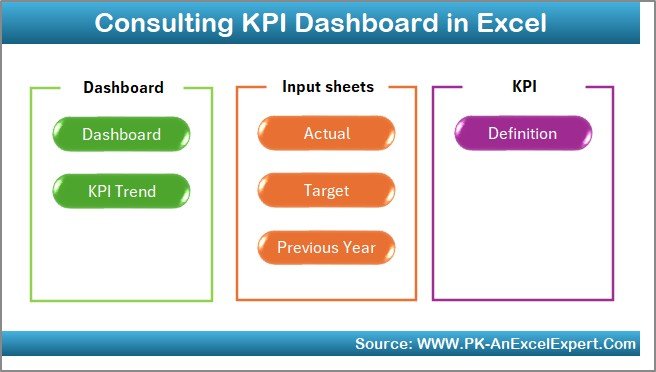
Structure of the Consulting KPI Dashboard in Excel
The Consulting KPI Dashboard template is built with seven interactive worksheets, each serving a unique purpose. Let’s take a closer look at each one.
Home Sheet — Your Navigation Hub
The Home sheet works like an index page, making it simple to navigate between different parts of the dashboard. It includes six buttons that let you jump directly to sheets such as Dashboard, KPI Trend, Targets, and others.
This design ensures that even users with limited Excel knowledge can easily access every section of the file. Think of it as a command center for your entire performance-tracking system.
Click to buy Consulting KPI Dashboard in Excel
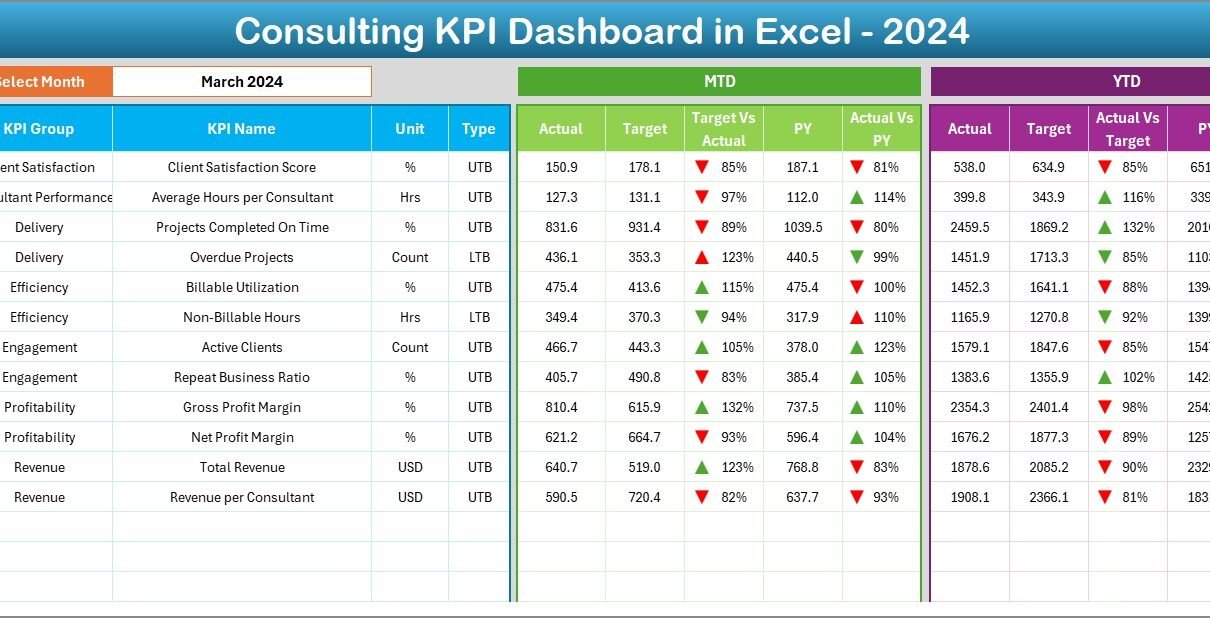
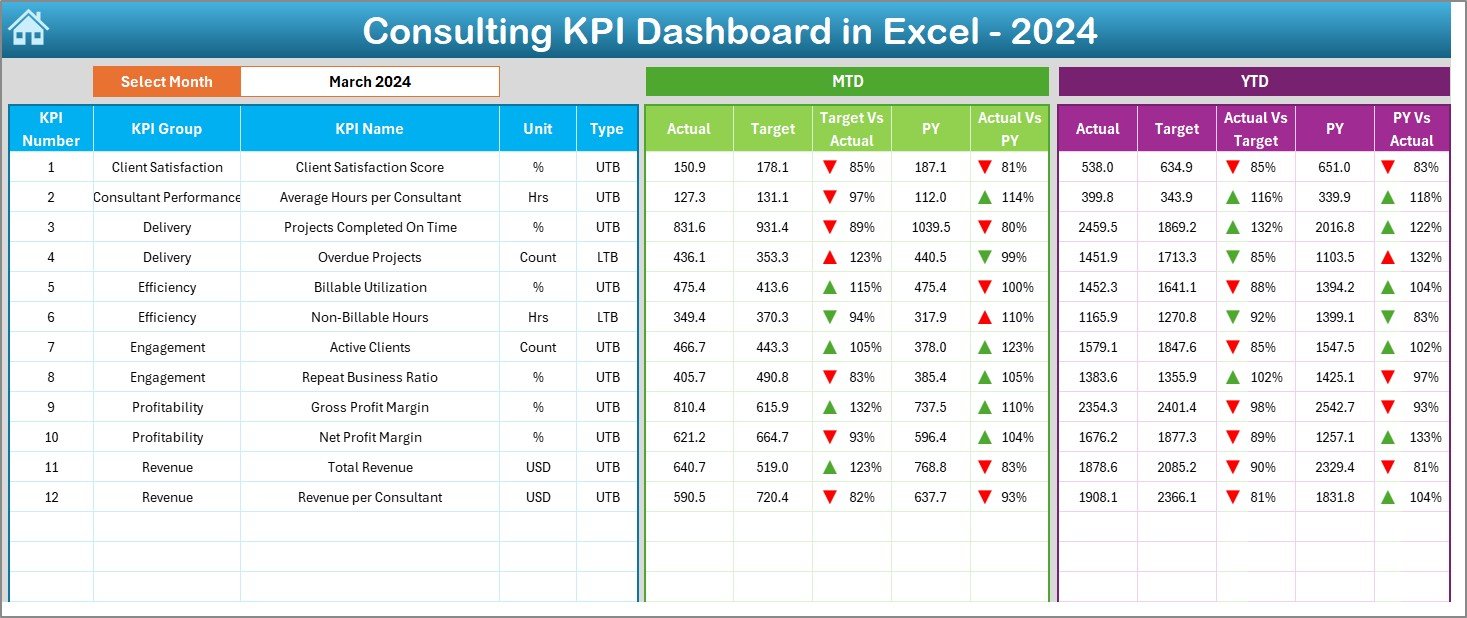
Dashboard Sheet — The Heart of the Tool
The Dashboard sheet tab is where the real magic happens.
Here, you can select a specific month from a drop-down menu in cell D3, and instantly all charts and figures refresh to show that month’s data.
The dashboard displays both MTD (Month-to-Date) and YTD (Year-to-Date) performance against:
Click to buy Consulting KPI Dashboard in Excel
- Targets
- Previous Year (PY) values
It also includes conditional formatting arrows — green for improvement, red for decline — helping you instantly identify whether performance is trending in the right direction.
This visual clarity enables consultants and managers to evaluate results quickly and take informed actions.
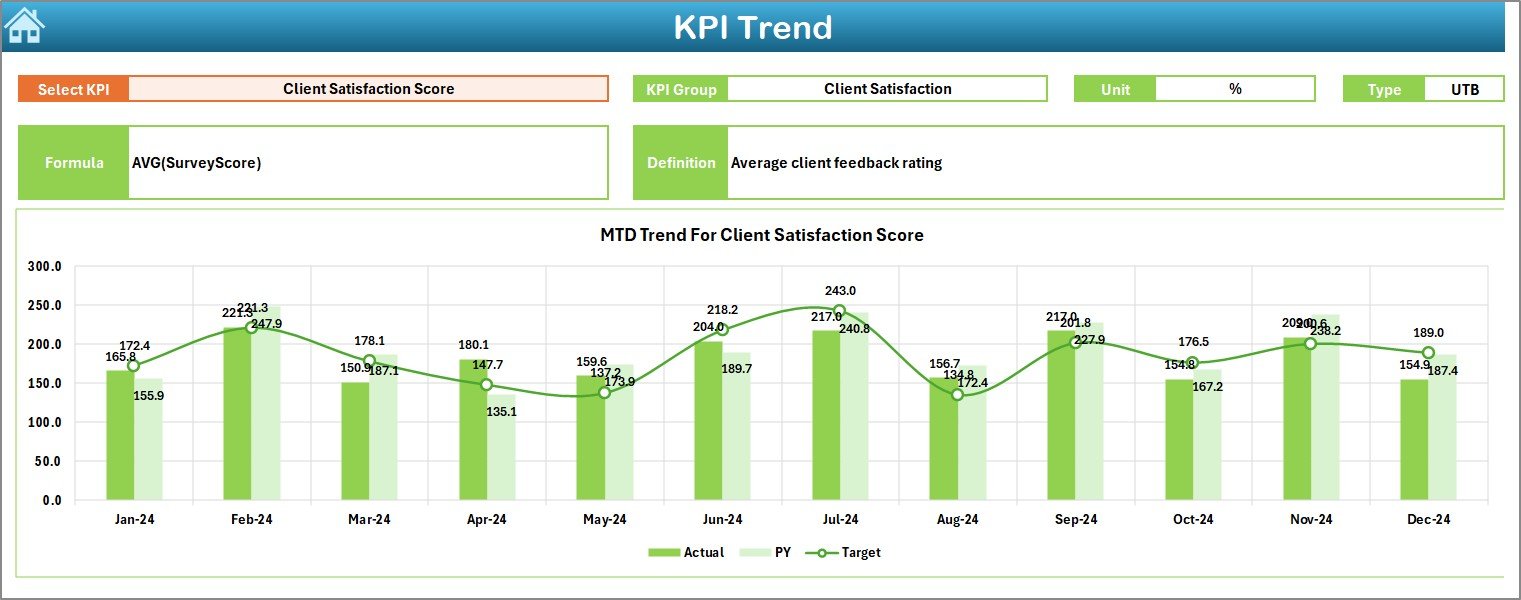
KPI Trend Sheet — Tracking Performance Over Time
The KPI Trend sheet lets you drill deeper into individual KPIs.
Select a KPI name from the drop-down in cell C3, and you’ll instantly see:
- KPI Group and Unit
- KPI Type (UTB = Upper The Better, LTB = Lower The Better)
- KPI Formula and Definition
- Graphical trend charts for MTD and YTD data
This sheet reveals performance patterns and helps managers identify seasonal fluctuations or long-term improvements.
For example, if client satisfaction dips every quarter end, you can trace the reason and act early to fix it.
Click to buy Consulting KPI Dashboard in Excel
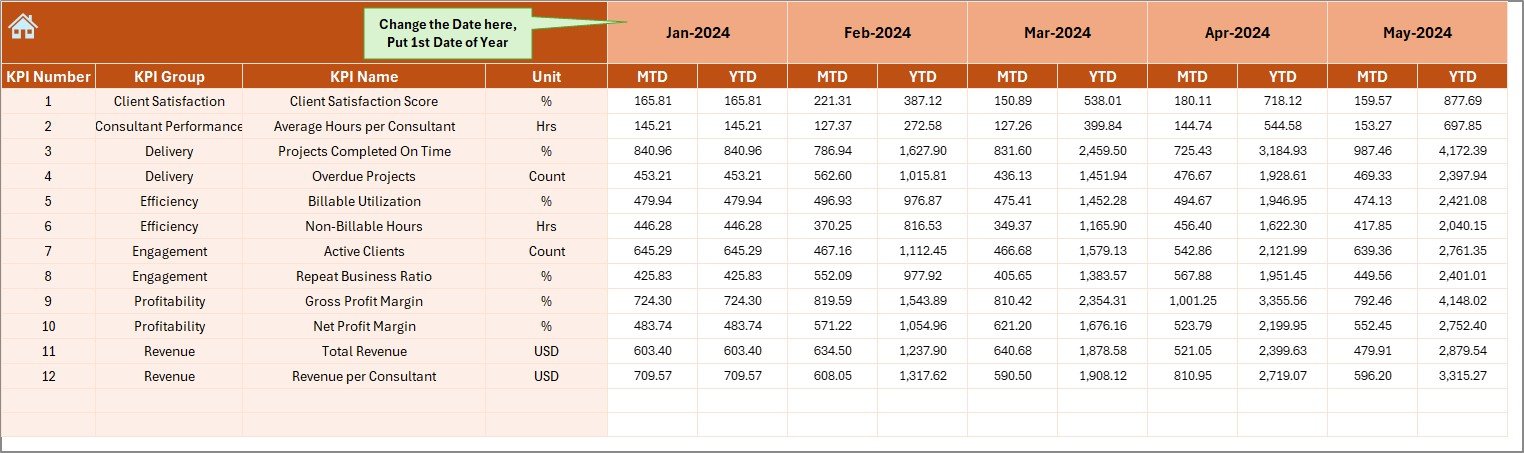
Actual Numbers Input Sheet — Entering Real Performance Data
The Actual Numbers Input sheet is where you input your real performance metrics.
You can adjust the starting month using cell E1, which makes the dashboard flexible for different financial years.
This sheet captures MTD and YTD actuals for each KPI, ensuring your dashboard always reflects the latest performance results.
Because it uses structured data input, the dashboard automatically pulls this information into its visuals, reducing manual work.
Click to buy Consulting KPI Dashboard in Excel
Target Sheet — Setting Clear Performance Goals
The Target sheet tab is where you define your performance expectations.
Each KPI includes both MTD and YTD targets for every month. Setting measurable goals helps consulting teams stay focused on outcomes rather than activities.
For instance, a KPI like “Project Completion Rate (%)” might have a target of 95%, giving your consultants a clear benchmark for success.
Previous Year Number Sheet — Benchmarking Past Results
This sheet helps you compare current performance with previous year data.
By analyzing trends and year-over-year growth, you can easily determine whether your firm is improving, stagnating, or falling behind.
For example:
- If Client Retention Rate rose from 82% to 90%, it shows improved satisfaction.
- If Billable Utilization dropped, you can explore reasons like staffing or project delays.
This comparison adds critical context to your KPIs and ensures continuous improvement.
KPI Definition Sheet — The Knowledge Base
The final sheet, KPI Definition, serves as a reference guide for your dashboard.
Here you’ll find columns for:
- KPI Name
- KPI Group
- Unit
- Formula
- Definition
This structure ensures everyone in your consulting firm interprets each KPI the same way, preventing confusion and enhancing consistency in performance tracking.
Advantages of Using a Consulting KPI Dashboard in Excel
Implementing a KPI dashboard in your consulting business delivers multiple benefits. Let’s explore the major ones.
- Centralized Performance Tracking
All KPIs are stored in one Excel file. You don’t need to open multiple reports or tabs — everything is accessible in a single, well-organized system.
- Real-Time Decision Making
Instant updates allow managers to react quickly. When MTD or YTD values change, the dashboard recalculates and updates visuals automatically.
- Easy Customization
Since it’s built in Excel, you can easily add new KPIs, modify formulas, or adjust targets to match your firm’s evolving goals.
- Data-Driven Culture
By visualizing data transparently, the dashboard encourages consultants to base decisions on numbers rather than assumptions.
- Cost-Effective Solution
Unlike expensive BI tools, Excel dashboards require no additional software investment. It’s a low-cost, high-impact performance-tracking system.
- Better Client Reporting
The visuals and charts make client presentations more professional. Instead of raw numbers, you can show visual performance trends and comparisons.
How the Consulting KPI Dashboard Enhances Business Outcomes
A well-implemented KPI dashboard bridges the gap between strategy and execution.
- Consultant Productivity: Measure utilization and identify workload imbalances.
- Project Management: Monitor on-time delivery and scope adherence.
- Financial Performance: Compare revenue, profit margins, and billing efficiency.
- Client Relations: Track satisfaction scores and feedback trends.
- Operational Efficiency: Discover bottlenecks and improve resource allocation.
Ultimately, this dashboard helps consulting firms become more agile, profitable, and client-centric.
Best Practices for Using the Consulting KPI Dashboard in Excel
To get the best results, follow these practical tips while working with your Consulting KPI Dashboard.
- Define KPIs Clearly
Ensure every KPI has a clear definition, formula, and ownership. Avoid vague or overlapping metrics.
- Keep Data Updated
Regularly update the Actual Numbers sheet. Consistent data entry ensures accurate visualizations and insights.
- Align KPIs with Business Goals
Every KPI should tie back to a strategic objective such as growth, profitability, or client retention.
- Visualize Trends Effectively
Use color coding and conditional formatting to highlight good or bad performance instantly.
- Review KPIs Monthly
At the end of each month, analyze MTD and YTD numbers to identify areas that need attention.
- Simplify User Navigation
Use the Home sheet buttons to make navigation intuitive, especially for non-technical users.
- Compare Against Benchmarks
Use the Previous Year sheet to measure improvements and set realistic targets for upcoming periods.
- Maintain Data Integrity
Protect formulas and important cells to avoid accidental modifications.
Opportunities for Improvement
Even though Excel dashboards are powerful, you can enhance their functionality further with a few improvements:
- Automate Data Entry: Connect to online databases or CRM tools to pull live data.
- Add Power Query or Power Pivot: Handle larger datasets efficiently.
- Enable Macros: Automate repetitive actions like refreshing data or exporting reports.
- Include Interactive Slicers: Allow users to filter KPIs by consultant, region, or project type.
- Integrate with Power BI: Combine the simplicity of Excel with advanced analytics for deeper insights.
These upgrades can elevate your dashboard from a static reporting tool to a dynamic analytics system.
Common Challenges in Consulting Performance Tracking
While dashboards simplify KPI monitoring, consulting firms often face a few recurring challenges:
- Data Collection Delays: Inconsistent reporting schedules lead to outdated insights.
- Lack of KPI Clarity: When KPIs aren’t well-defined, teams misinterpret results.
- Overloaded Dashboards: Too many KPIs dilute focus and create confusion.
- Human Errors: Manual data entry can lead to inaccuracies.
Recognizing these issues early allows you to take corrective measures and maintain reliable performance tracking.
How to Implement the Consulting KPI Dashboard Successfully
Here’s a simple, step-by-step approach to implement your dashboard effectively:
- Identify Key Metrics: Choose KPIs relevant to your firm’s goals.
- Collect Historical Data: Input previous year’s performance for baseline comparison.
- Set Monthly Targets: Define achievable goals aligned with strategic plans.
- Enter Actual Data Regularly: Update MTD and YTD metrics each month.
- Analyze Trends: Review charts to identify improvement opportunities.
- Share Insights: Present visuals during monthly review meetings.
- Refine KPIs: Drop less useful metrics and introduce new ones as needed.
Following this process ensures your Consulting KPI Dashboard becomes an actionable decision-support tool.
Conclusion
The Consulting KPI Dashboard in Excel is more than just a spreadsheet — it’s a comprehensive performance-management solution tailored for consulting professionals.
By combining simplicity, flexibility, and powerful visual analytics, it empowers consulting firms to track results, optimize operations, and drive business growth.
Whether you’re managing a boutique consulting firm or a large advisory organization, this Excel-based KPI dashboard provides the clarity and control you need to stay ahead of the competition.
Frequently Asked Questions (FAQs)
- What types of KPIs can be tracked in this dashboard?
You can track financial, operational, and client-based KPIs such as billable utilization, project completion rate, client satisfaction, revenue growth, and consultant productivity.
- Can beginners use the Consulting KPI Dashboard?
Yes. The dashboard is designed with intuitive navigation and drop-downs, making it suitable even for users with basic Excel knowledge.
- How often should the data be updated?
Ideally, you should update your data monthly to analyze both MTD and YTD performance accurately.
- Can I customize the KPIs and visuals?
Absolutely! Since it’s built in Excel, you can easily add new KPIs, modify formulas, or redesign charts to match your business needs.
- What are the system requirements to run this dashboard?
The dashboard works seamlessly in Microsoft Excel 2016 or later. It doesn’t require any external plugins or software.
- Is this dashboard suitable for large consulting firms?
Yes. Whether your firm has 10 or 1,000 consultants, this scalable dashboard can manage multiple KPI groups and monthly datasets efficiently.
Visit our YouTube channel to learn step-by-step video tutorials
Watch the step-by-step video tutorial:
Click to buy Consulting KPI Dashboard in Excel