In today’s business world, auditing plays a vital role in maintaining accountability, transparency, and compliance. Whether it’s an internal review or an external inspection, organizations must ensure that their financial and operational processes meet standards. However, managing audit data across departments, locations, and time periods can be complex without a proper system.
That’s where the Corporate Audit Dashboard in Excel comes in. This ready-to-use Excel template helps organizations monitor, track, and analyze audit performance in one place. It simplifies reporting and decision-making with visually rich charts, KPI cards, and automatic calculations — giving business leaders instant insights into audit effectiveness.
Click to buy Corporate Audit Dashboard in Excel
What Is a Corporate Audit Dashboard in Excel?
A Corporate Audit Dashboard in Excel is a dynamic and interactive Excel-based reporting tool designed to centralize all audit information. It displays critical metrics such as total audits, cost impact, findings, recommendations, and action closures through visual elements like charts and KPI cards.
Unlike static reports, this dashboard updates instantly when new data is entered in the Data Sheet tab, allowing you to make real-time audit performance evaluations.
It is built with Excel formulas, pivot tables, and charts — so no complex coding or software is required. With a few clicks, you can filter data by month, department, or audit type and get the complete audit health overview of your organization.
Key Features of the Corporate Audit Dashboard
This Excel dashboard template includes several analytical sheets, each designed for a specific audit perspective. Here’s what’s inside:
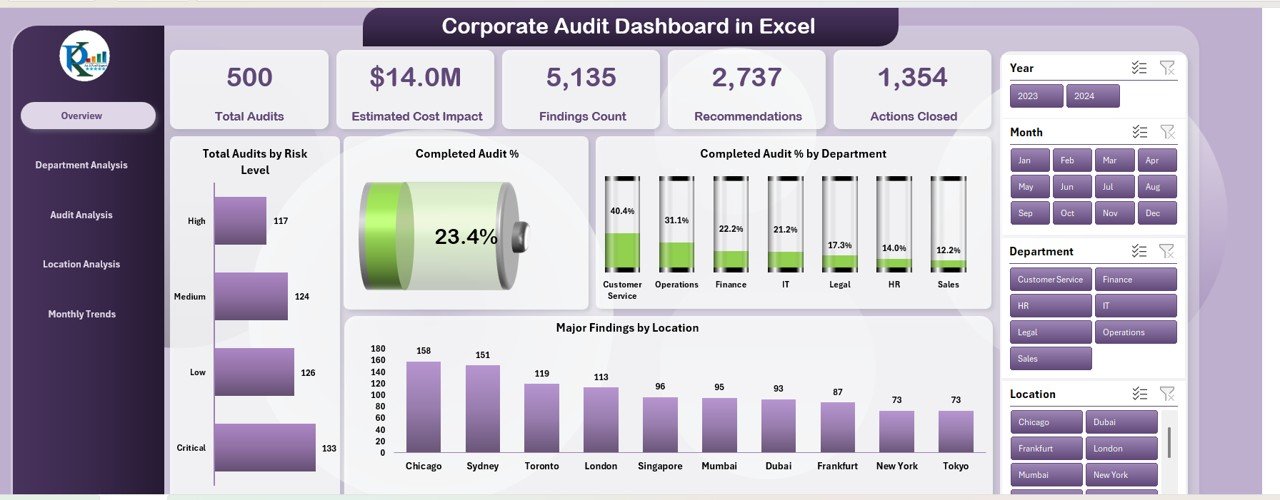
Overview Sheet Tab
The Overview sheet acts as the main control panel of the dashboard. It summarizes all key audit indicators in one snapshot.
Cards Included:
- Total Audits
- Estimated Cost Impact (USD)
- Findings Count
- Recommendations
- Actions Closed
Charts Displayed:
- Total Audits by Risk Level
- Completed Audit %
- Major Findings by Location
- Completed Audit % by Department
- Major Findings by Location (drill-down visuals)
These visuals help management quickly identify high-risk areas and track progress over time.
Click to buy Corporate Audit Dashboard in Excel
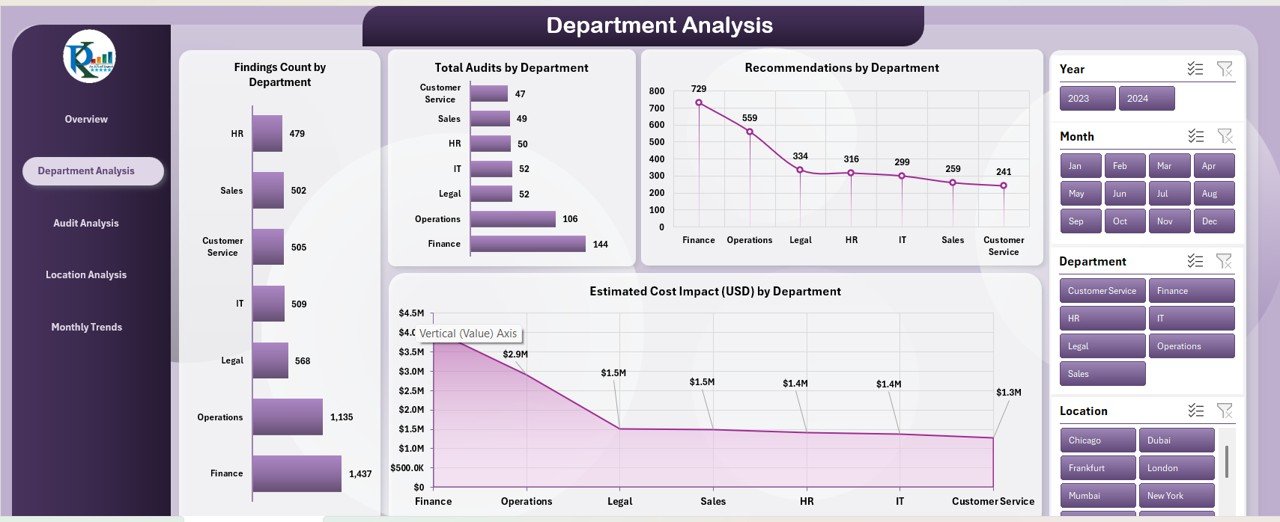
Department Analysis Sheet
The Department Analysis sheet provides a deep dive into department-wise performance.
Charts Included:
- Findings Count by Department
- Total Audits by Department
- Recommendations by Department
- Estimated Cost Impact (USD) by Department
This view helps pinpoint which departments face the highest audit issues or cost exposure. It supports better allocation of resources and corrective actions.
Click to buy Corporate Audit Dashboard in Excel
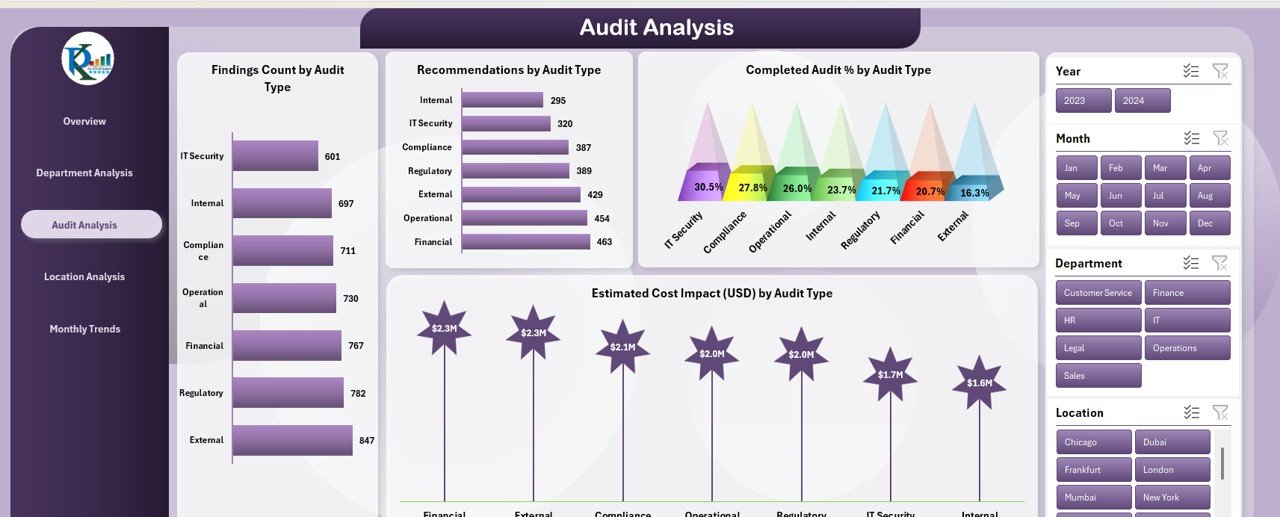
Audit Analysis Sheet
This sheet analyzes performance by audit type — internal, compliance, process, or financial audits.
Charts Displayed:
- Findings Count by Audit Type
- Recommendations by Audit Type
- Estimated Cost Impact (USD) by Audit Type
- Completed Audit % by Audit Type
Such insights help auditors and managers evaluate the effectiveness of different audit categories.
Click to buy Corporate Audit Dashboard in Excel
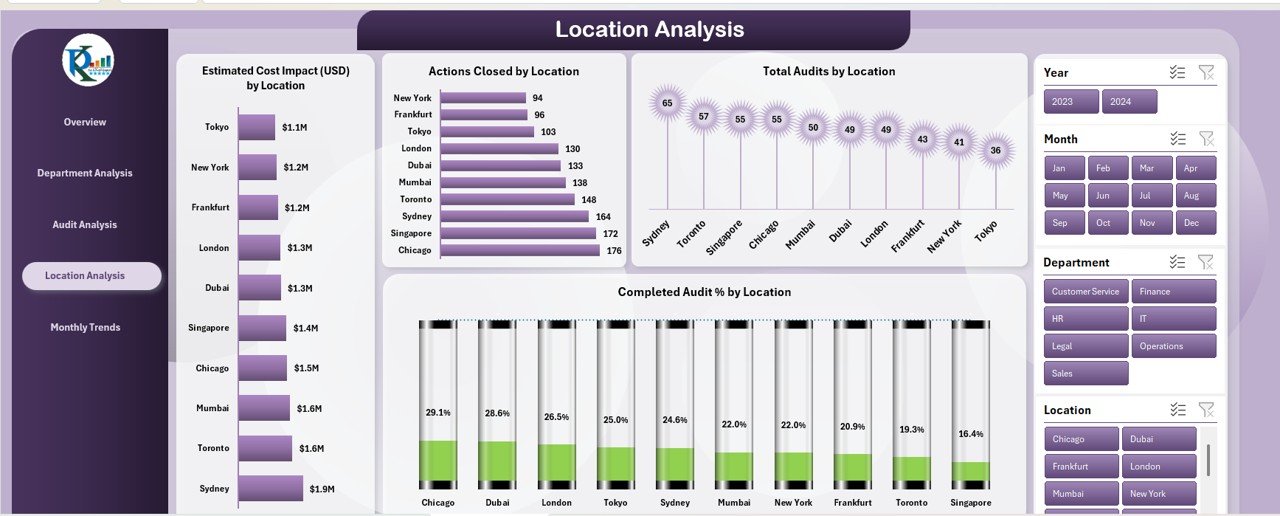
Location Analysis Sheet
When audits span multiple offices or branches, the Location Analysis sheet helps identify geographical trends.
Charts Included:
- Estimated Cost Impact (USD) by Location
- Actions Closed by Location
- Completed Audit % by Location
- Total Audits by Location
With this data, leadership can identify which locations show strong compliance versus which need attention.
Click to buy Corporate Audit Dashboard in Excel
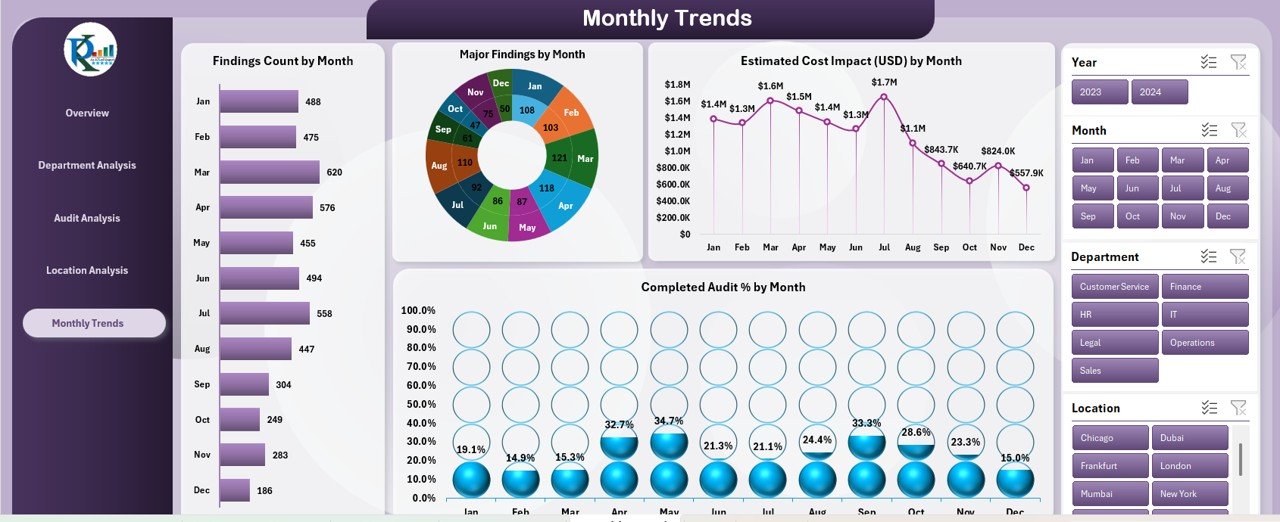
Monthly Trends Sheet
This tab shows how audit performance evolves over time.
Charts Covered:
- Findings Count by Month
- Completed Audit % by Month
- Estimated Cost Impact (USD) by Month
It helps visualize audit improvements, cost trends, and seasonal variations in audit outcomes.
Click to buy Corporate Audit Dashboard in Excel
Data Sheet Tab
The Data Sheet is where you input your raw audit data — such as audit ID, type, department, risk level, findings, recommendations, and completion status.
The dashboard automatically processes and visualizes this data, making updates instant and effortless.
Why You Need a Corporate Audit Dashboard
Auditing teams often deal with large volumes of data spread across spreadsheets, emails, and systems. Without consolidation, analysis becomes slow and error-prone.
The Corporate Audit Dashboard in Excel brings structure and clarity to this process. It not only saves time but also enhances decision-making with accurate visuals.
Here are a few reasons every organization should adopt it:
- Simplifies audit reporting and tracking
- Reduces manual errors through automation
- Provides quick visual insights
- Helps identify trends and patterns early
- Supports compliance and governance goals
Advantages of the Corporate Audit Dashboard in Excel
Let’s explore the key benefits that make this dashboard essential for every organization.
- Centralized Audit Information
All audit data — from findings to cost impact — stays in one file, eliminating data silos and confusion.
- Real-Time Updates
Once you input or modify data, every chart and KPI updates automatically. This ensures your reports are always current.
- Easy Visualization
With Excel charts and slicers, complex data turns into easy-to-understand visuals. Decision-makers don’t have to read lengthy reports.
- Enhanced Accountability
Each department’s audit performance is visible, promoting transparency and responsibility.
- Cost-Effective
No need for expensive audit software — this Excel-based solution provides professional-grade insights at zero recurring cost.
- User-Friendly Interface
Anyone familiar with Excel can use it. No coding or BI skills are required.
How to Use the Corporate Audit Dashboard Effectively
To make the most of this dashboard, follow these steps:
- Go to the Data Sheet tab and enter your audit records — including audit name, type, department, cost impact, findings, and completion status.
- Navigate to the Overview sheet to view high-level KPIs and visual summaries.
- Use slicers (filters) to analyze specific months, departments, or risk levels.
- Explore Department, Audit, and Location Analysis sheets for deeper insights.
- Review Monthly Trends to monitor progress over time.
By following this workflow, you’ll transform raw audit data into powerful visual reports within minutes.
Key Metrics Tracked in the Dashboard
The Corporate Audit Dashboard focuses on measurable and actionable KPIs, including:
- Total Audits Conducted
- Findings Count
- Estimated Cost Impact (USD)
- Completed Audit Percentage
- Actions Closed
- Recommendations Implemented
- Major Findings by Risk Level and Location
These KPIs ensure that both operational and compliance aspects of auditing are covered.
Best Practices for the Corporate Audit Dashboard
To keep your dashboard efficient and accurate, follow these best practices:
- Keep your data clean – Regularly review the Data Sheet for missing or duplicate entries.
- Update monthly – Enter fresh audit data at least once a month to maintain accuracy.
- Use consistent naming – Use the same department, location, and audit type names for uniform analysis.
- Back up regularly – Save dashboard copies periodically to prevent data loss.
- Review KPIs – Validate your KPI definitions annually to align with audit strategy changes.
- Train your team – Ensure all users know how to navigate and update the dashboard.
Following these practices ensures your dashboard remains a reliable audit management tool.
Advantages of Using Excel for Corporate Auditing
Many companies use sophisticated BI tools, but Excel remains the most accessible and flexible option. Here’s why:
- Familiar Interface: Most professionals already use Excel daily, reducing learning curves.
- Offline Access: You can work without internet connectivity.
- Customizable: Modify formulas, charts, or layouts easily based on your organization’s needs.
- Scalable: Handle hundreds or even thousands of audit records.
- Integrated Reporting: Combine with other Excel dashboards like Risk Management or Compliance Reports.
Common Use Cases of This Dashboard
- Annual Audit Planning: Track scheduled and completed audits over the year.
- Compliance Reporting: Prepare quick summaries for internal or external auditors.
- Management Review: Present visual reports during board meetings.
- Performance Monitoring: Measure how departments are improving after audit recommendations.
- Cost Control: Analyze estimated vs. actual cost impact trends.
How This Dashboard Supports Decision-Making
By integrating financial and operational audit metrics, this dashboard empowers decision-makers with actionable insights.
For instance:
- If findings increase in a specific department, management can conduct focused training or reviews.
- If cost impact rises in one region, finance can allocate resources strategically.
- If completion rates drop, audit timelines can be adjusted to ensure compliance.
Such insights turn audit data into measurable organizational improvement.
Conclusion
The Corporate Audit Dashboard in Excel is more than a report — it’s a strategic decision-making tool. It turns complex audit data into meaningful visuals that reveal patterns, risks, and opportunities.
With this template, organizations can save time, reduce manual effort, and enhance audit transparency — all using the familiar power of Excel.
Whether you’re an internal auditor, compliance officer, or business leader, this dashboard provides everything you need to monitor and improve your audit performance effectively.
Frequently Asked Questions (FAQs)
- What is included in the Corporate Audit Dashboard in Excel?
It includes multiple analytical sheets — Overview, Department Analysis, Audit Analysis, Location Analysis, Monthly Trends, and a Data Sheet for input. Each offers visual insights through charts and KPIs.
- Do I need any coding skills to use this dashboard?
No. The dashboard is built entirely with Excel formulas, pivot tables, and charts — no VBA or macros are required.
- Can I customize the dashboard for my organization?
Yes. You can easily modify KPI names, department lists, or chart formats to suit your company’s needs.
- How often should I update the data?
Ideally, update it monthly or after each audit cycle to ensure accuracy and timeliness of insights.
- Can this dashboard handle large datasets?
Yes. The structure is optimized to manage hundreds of audit records efficiently without performance issues.
- Is the dashboard suitable for non-finance departments?
Absolutely. It can track operational, process, safety, or compliance audits — not just financial ones.
- Where can I download the Corporate Audit Dashboard in Excel?
You can download it from NextGenTemplates.com and start analyzing your audit performance instantly.
Visit our YouTube channel to learn step-by-step video tutorials
Watch the step-by-step video tutorial:
Click to buy Corporate Audit Dashboard in Excel