In today’s competitive business world, understanding customer engagement has become one of the most important goals for any organization. Every successful business knows that retaining existing customers and keeping them engaged is far more cost-effective than constantly acquiring new ones.
To measure this engagement accurately, companies need a structured, data-driven approach — and that’s where the Customer Engagement KPI Scorecard in Excel becomes an invaluable tool.
This ready-to-use Excel template helps you track, analyze, and visualize customer engagement metrics (KPIs) effectively. It brings together all key performance indicators in one place, giving you real-time insights into customer satisfaction, loyalty, and interaction levels.
Click to buy Customer Engagement KPI Scorecard in Excel
What Is a Customer Engagement KPI Scorecard in Excel?
A Customer Engagement KPI Scorecard is a performance measurement tool that allows organizations to monitor how actively customers are interacting with their brand.
This scorecard helps you track key engagement metrics such as repeat purchase rate, churn rate, customer satisfaction score (CSAT), Net Promoter Score (NPS), and social media engagement rate — all within an interactive Excel dashboard.
Unlike complex analytics platforms, this Excel-based scorecard is:
- Easy to use
- Highly customizable
- Completely offline and secure
It serves as both a reporting dashboard and a strategic monitoring system, enabling managers and teams to make data-driven decisions about customer relationship strategies.
Key Features of the Customer Engagement KPI Scorecard
This KPI Scorecard in Excel has been designed to offer clarity, control, and convenience. It consists of four major worksheets, each serving a unique purpose in tracking customer engagement performance.
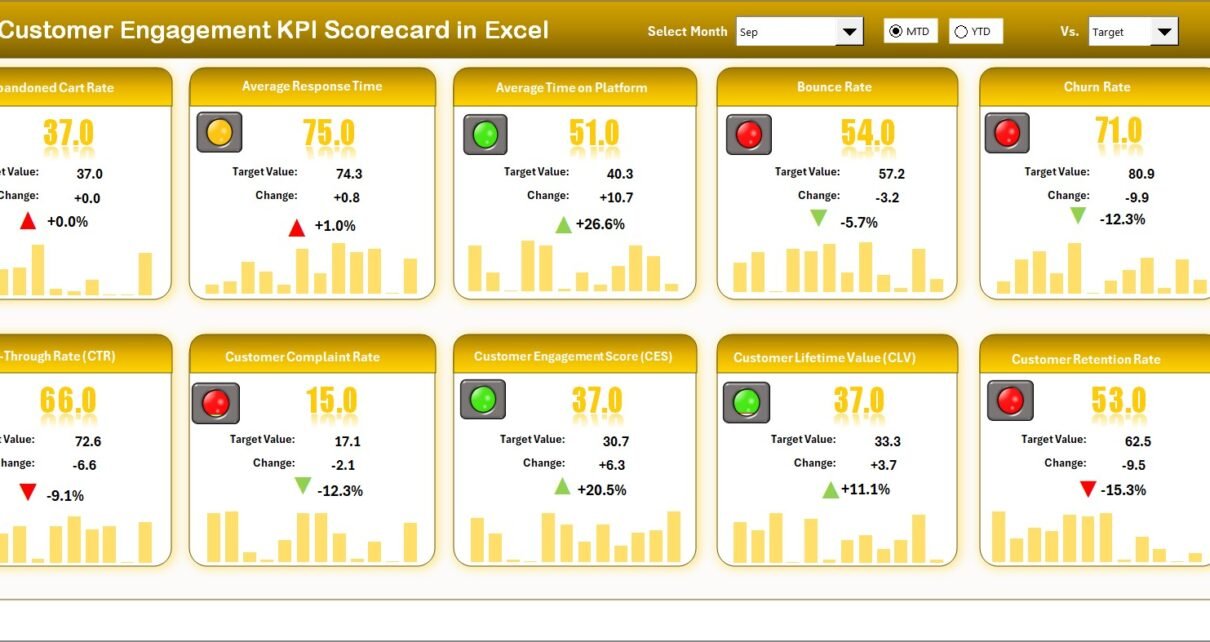
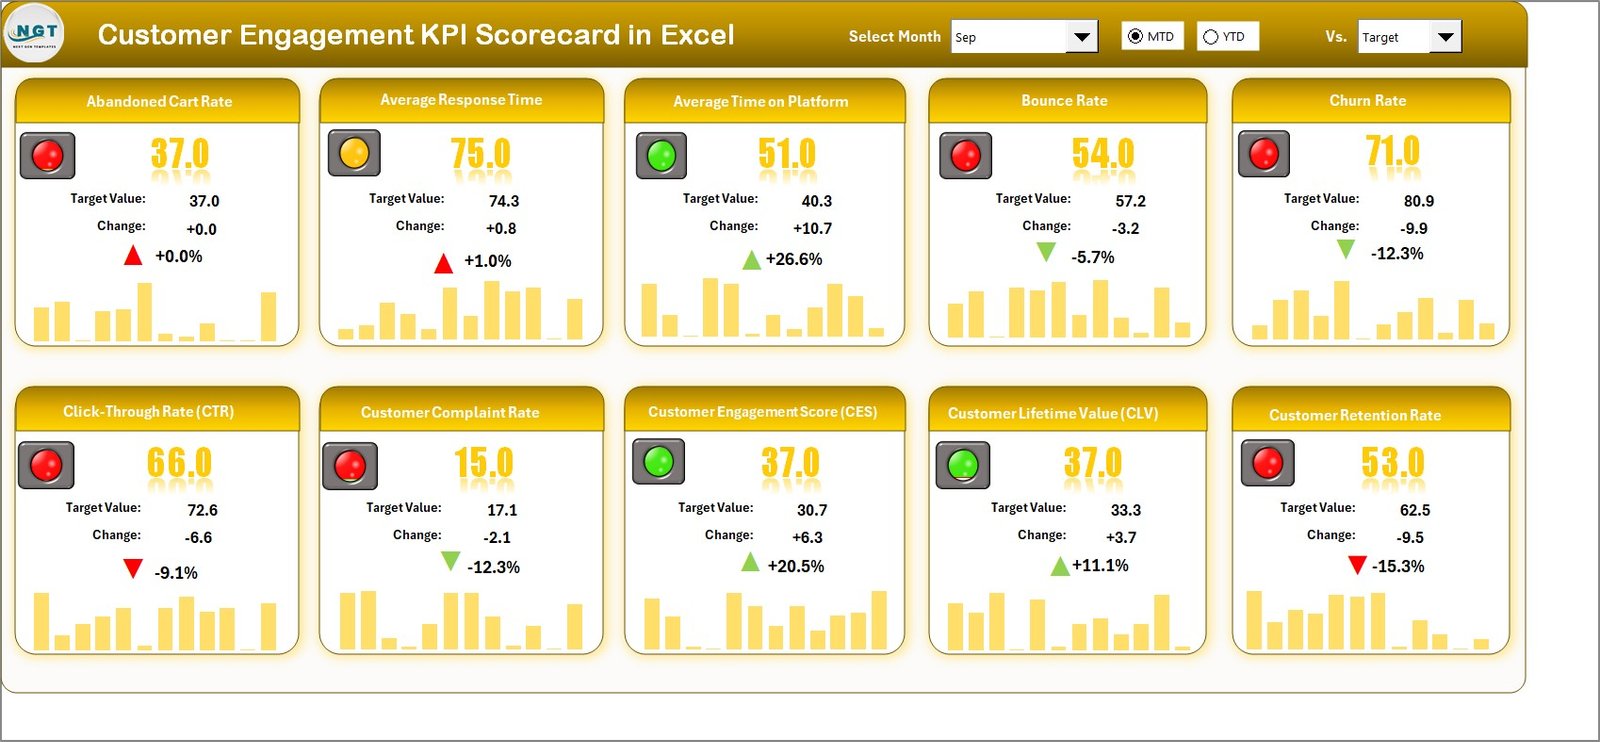
Scorecard Sheet – The Main Dashboard
The Scorecard Sheet is the central view of the tool.
It allows users to interactively monitor performance for all KPIs in one glance.
Key Highlights:
- Dropdown Menus – Easily select Month, MTD (Month-to-Date), or YTD (Year-to-Date) to analyze results.
- Actual vs Target Comparison – View how each KPI performs against its target values.
- Color-Coded Visuals – Conditional formatting instantly shows if performance is “On Track,” “Needs Improvement,” or “Falling Behind.”
- Compact Layout – Displays 10 KPIs in one view for a comprehensive summary.
- Automatic Refresh – All charts and results update automatically as new data is entered.
This sheet acts as your command center, giving leadership teams a snapshot of engagement health across departments or customer segments.
Click to buy Customer Engagement KPI Scorecard in Excel
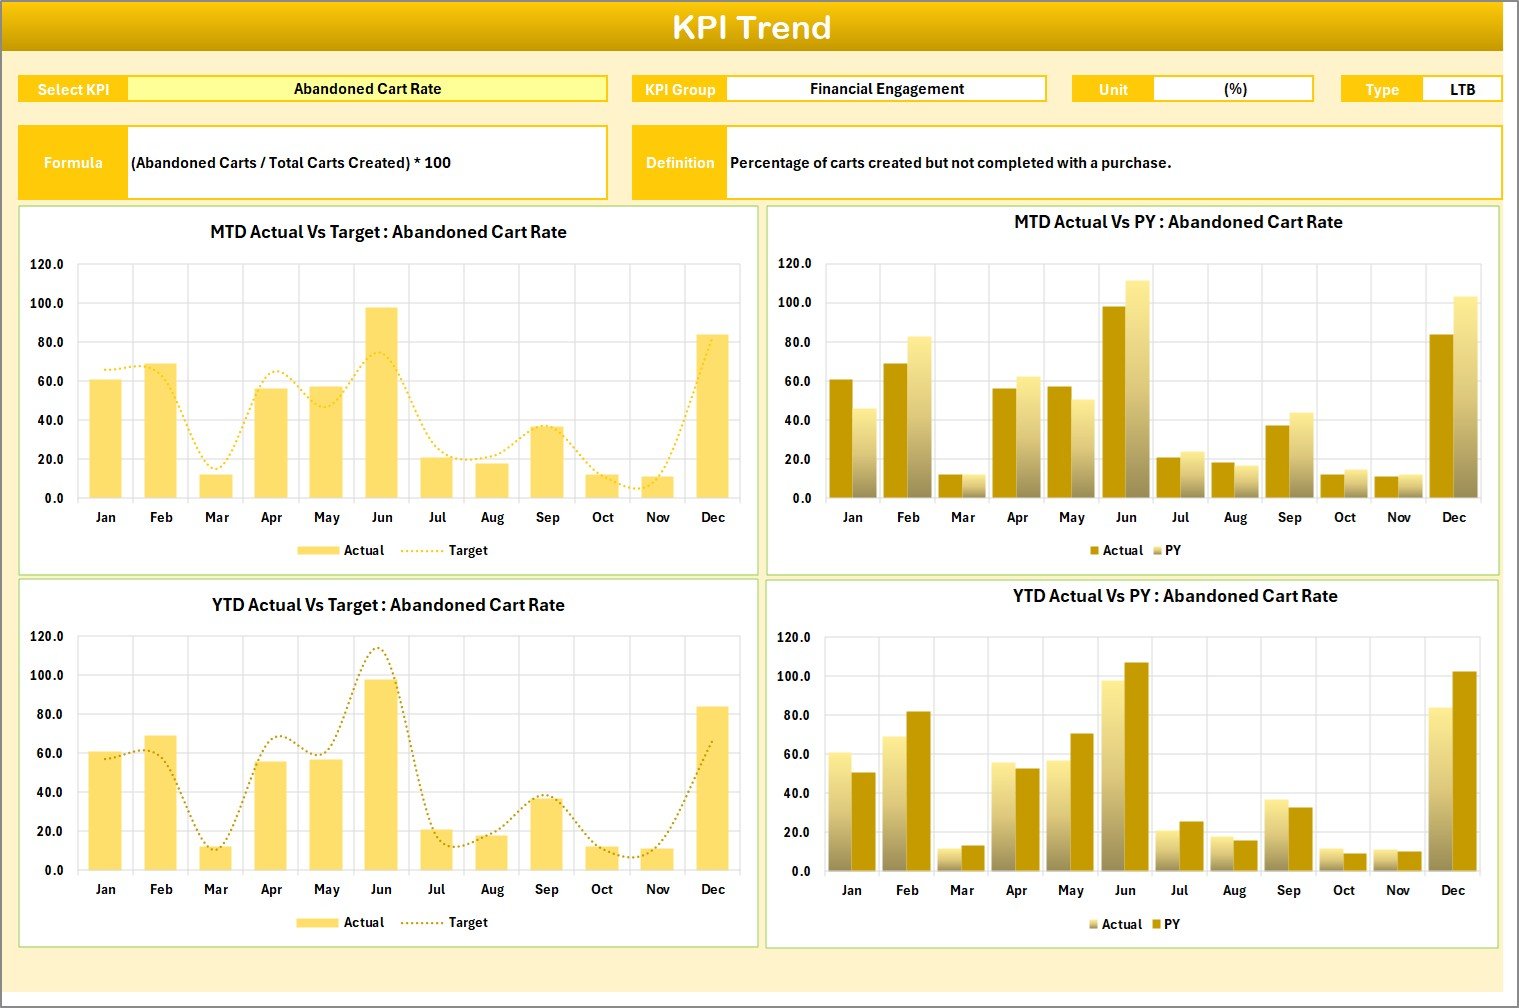
KPI Trend Sheet – Analyze Performance Over Time
The KPI Trend Sheet allows deeper insight into how engagement evolves over months or quarters.
Key Highlights:
- Dynamic Dropdown Selection (Cell C3) – Choose any KPI to view its detailed trend.
- Detailed KPI Information – Automatically display the KPI Group, Unit, Formula, Definition, and Type (Lower-the-Better or Upper-the-Better).
- Trend Visualization – MTD and YTD trend charts for Actual, Target, and Previous Year values.
- Comparative Insights – Understand seasonality or long-term growth patterns using visual trend lines.
This sheet helps marketing and customer success teams identify patterns — for instance, whether engagement spikes after campaigns or declines due to low satisfaction scores.
Click to buy Customer Engagement KPI Scorecard in Excel
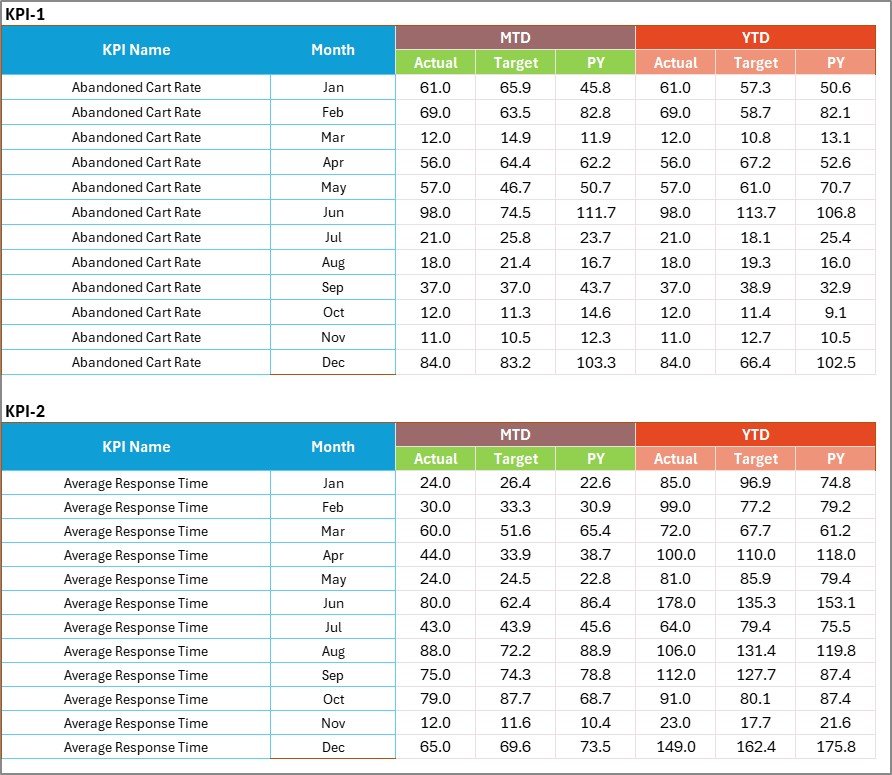
Input Data Sheet – Centralized Data Entry
The Input Data Sheet is the foundation of the entire scorecard.
🧮 Key Highlights:
- Simple Data Entry – Enter monthly data for each KPI, including Actual, Target, and Previous Year values.
- Dynamic Structure – As soon as you input new data, all linked dashboards refresh automatically.
- Flexibility – Add or remove KPIs based on your business’s changing priorities.
- Accuracy Control – Built-in data validation ensures correct units, months, and formats.
It’s designed for ease of maintenance, so even non-technical users can update it without breaking any formulas.
Click to buy Customer Engagement KPI Scorecard in Excel
KPI Definition Sheet – Clear Metric Understanding
Every successful dashboard starts with clarity on what each metric means.
The KPI Definition Sheet provides a structured view of every KPI included in the scorecard.
- Key Highlights:
- Columns for:
- KPI Name
- KPI Group
- Unit
- Formula
- Definition
- Ensures consistency and accuracy across reports.
- Helps new users quickly understand what each KPI measures and how it is calculated.
This section adds transparency and helps teams stay aligned on definitions — ensuring everyone speaks the same “KPI language.🎯 Why Use Excel for Customer Engagement Tracking?
Many businesses rely on Excel because it offers flexibility, accessibility, and simplicity — without requiring expensive tools.
Benefits of Using Excel:
- Ease of Customization: Modify KPIs, formulas, or visuals anytime.
- Offline Access: No internet needed — great for data privacy.
- Integration Capability: Easily import/export data from CRM or ERP systems.
- Interactive Dashboards: Add slicers, filters, and dynamic charts for richer visualization.
- Cost-Effective: No subscription fees — one file serves multiple users.
Excel remains a timeless choice for businesses that prefer control, transparency, and customization.
Advantages of the Customer Engagement KPI Scorecard in Excel
Let’s explore the major benefits of using this powerful Excel template:
Real-Time Visibility
Gain instant insights into how your customer engagement is performing — across all channels.
Improved Decision-Making
Visualize trends and gaps quickly so managers can make data-driven strategic improvements.
Easy Customization
Add or modify KPIs, color codes, or formulas according to your unique business requirements.
Enhanced Accountability
Assign KPI ownership to departments or individuals and monitor their progress transparently.
Performance Benchmarking
Compare current results against previous periods or targets to assess consistency and growth.
Simple Yet Powerful Design
No coding or complex setup — just plug in data and get automated visual insights.
Opportunities for Improvement
While the Excel scorecard offers numerous benefits, there are areas where it can evolve further:
- Automation Integration: Connecting it with live CRM or ERP databases can automate data refresh.
- Power BI Integration: For businesses needing real-time dashboards, integrating Excel data into Power BI adds more depth.
- KPI Expansion: Include advanced metrics like sentiment analysis or behavioral segmentation.
- Mobile Optimization: Create simplified views for executives to check results on tablets or phones.
- Collaborative Features: Using cloud-based Excel (Microsoft 365) enables shared editing among teams.
These enhancements can make the scorecard even more dynamic and enterprise-ready.
Best Practices for Using the Customer Engagement KPI Scorecard
To get the best results from your Excel scorecard, follow these proven practices:
Define Clear Objectives
Always begin with clarity — identify what you want to achieve with your engagement tracking. Whether it’s improving NPS or reducing churn, each KPI should align with a goal.
Keep KPIs Balanced
Include a mix of quantitative (e.g., conversion rate) and qualitative (e.g., satisfaction score) indicators.
Maintain Data Accuracy
Regularly validate and clean your data before analysis. Even one incorrect figure can mislead strategic decisions.
Review Trends Monthly
Compare Month-to-Date and Year-to-Date results consistently. This helps you catch downward trends early.
Visualize Effectively
Use color codes, traffic lights, and arrows to show improvement or decline clearly.
Encourage Team Ownership
Assign specific KPIs to departments like marketing, sales, or support. This improves accountability.
Update Definitions
Revisit the KPI Definition Sheet periodically to ensure formulas and interpretations remain aligned with business goals.
Use Conditional Formatting Wisely
Highlight critical areas automatically, such as low engagement or high churn rates.
Link KPIs to Actions
Every KPI should drive an action plan — for example, if the churn rate rises, launch a re-engagement campaign.
Protect Your Workbook
Lock formulas and define user roles to prevent accidental changes.
By following these best practices, you can ensure your KPI Scorecard remains a reliable, decision-driven tool.
How This Scorecard Supports Business Growth
Customer engagement lies at the heart of business sustainability.
By using this Excel Scorecard, organizations can:
- Detect weak engagement areas early.
- Identify top-performing channels.
- Understand the link between engagement and revenue.
- Optimize retention strategies.
- Foster long-term brand loyalty.
The structured data helps teams act proactively rather than reactively — leading to improved satisfaction, reduced churn, and stronger lifetime value.
Conclusion
The Customer Engagement KPI Scorecard in Excel is not just a tracking tool — it’s a strategic performance system that empowers your organization to monitor, evaluate, and enhance every touchpoint of the customer journey.
With its intuitive design, flexible structure, and insightful visualizations, this scorecard enables businesses to translate data into action.
Whether you are a small startup or an established enterprise, it provides the clarity needed to strengthen customer relationships and achieve consistent growth.
By adopting this ready-to-use Excel template, you gain the ability to turn raw data into meaningful insights, streamline decision-making, and create an engagement-driven culture that boosts loyalty and revenue.
Frequently Asked Questions (FAQs)
- What is a Customer Engagement KPI Scorecard?
A Customer Engagement KPI Scorecard is an analytical tool used to track and measure how customers interact with your business. It helps monitor satisfaction, loyalty, and overall engagement performance.
- How can Excel help in tracking customer engagement?
Excel provides a simple yet powerful platform to calculate, store, and visualize engagement data through charts, formulas, and dashboards without requiring advanced software.
- What are the key KPIs for customer engagement?
Common KPIs include Customer Satisfaction Score (CSAT), Net Promoter Score (NPS), Retention Rate, Churn Rate, Repeat Purchase Rate, and Social Media Engagement.
- Is this Excel template suitable for all industries?
Yes. Whether you’re in retail, finance, healthcare, or technology, the scorecard can be customized easily to match your business’s engagement metrics.
- Can I integrate the Excel scorecard with other systems?
Absolutely. You can connect it with CRM systems like Salesforce, HubSpot, or Zoho using data import/export or Power Query functions.
- How often should I update the scorecard?
Ideally, update your scorecard monthly to maintain accurate Month-to-Date (MTD) and Year-to-Date (YTD) analysis.
- Can non-technical users operate this tool?
Yes. The template has a user-friendly interface with dropdowns and visual indicators, making it accessible to everyone.
- What benefits will I get from using this scorecard?
You’ll gain clear visibility into customer engagement trends, faster decision-making, improved retention, and better overall performance tracking.
- How is “Upper the Better” and “Lower the Better” used?
KPIs like CSAT and NPS are “Upper the Better” (higher values mean better performance), while Churn Rate or Average Resolution Time are “Lower the Better.”
- Where can I download the Customer Engagement KPI Scorecard?
You can download the ready-to-use Excel template directly from NextGenTemplates.com, customize it for your business, and start tracking engagement right away.
Visit our YouTube channel to learn step-by-step video tutorials
Watch the step-by-step video tutorial:
Click to buy Customer Engagement KPI Scorecard in Excel