Digital media agencies deal with hundreds of campaigns, multiple platforms, fast-moving client demands, and ever-changing performance metrics. Because everything moves quickly, teams need a structured way to measure KPIs, compare trends, understand performance gaps, and improve results every month. A Digital Media Agencies KPI Dashboard in Excel solves this problem in the simplest and most effective way.
Since it works inside Excel, it becomes easy for teams to update KPIs, track performance, compare targets, and review results without any complex tools. The dashboard centralizes campaign metrics, client-wise performance, MTD and YTD data, and KPI definitions inside seven powerful worksheet tabs. It also helps agency owners, marketing managers, and data analysts track targets, view trends, and instantly identify areas that need improvement.
In this article, you will learn everything about the Digital Media Agencies KPI Dashboard in Excel. You will explore its structure, page-wise analysis, working logic, benefits, best practices, and frequently asked questions. Each section uses simple language and clear explanations so every reader can understand and use the dashboard easily.
Click to buy Digital Media Agencies KPI Dashboard in Excel
What Is a Digital Media Agencies KPI Dashboard in Excel?
A Digital Media Agencies KPI Dashboard in Excel is a ready-to-use reporting template that helps agencies track the performance of all their key digital marketing KPIs. Because it collects data from Excel tables and uses formulas, conditional formatting, and pivot charts, it gives users a simple yet powerful tool for decision-making.
Agencies can monitor important KPIs such as:
- Campaign clicks
- Impressions
- CTR
- Conversion rate
- CAC
- ROI
- Revenue contribution
- Lead quality
- Project delivery timelines
- Team productivity
Since the dashboard runs entirely in Excel, the agency does not rely on any paid software or coding-based tools. It works for agencies of all sizes—whether you manage 5 KPIs or 50.
Why Do Digital Media Agencies Need a KPI Dashboard?
Digital marketing involves multiple activities happening at the same time. Teams handle content creation, running ads, tracking leads, reporting to clients, and optimizing campaigns. Without a structured KPI dashboard:
- Numbers spread across different sheets
- Team members track KPIs manually
- Reporting becomes slow
- Errors increase
- Trends remain unclear
- Decision-making becomes delayed
Therefore, agencies need a dashboard that brings all KPIs together and presents them with clarity. This dashboard turns raw numbers into meaningful insights so users make better decisions every day.
Structure of the Digital Media Agencies KPI Dashboard in Excel
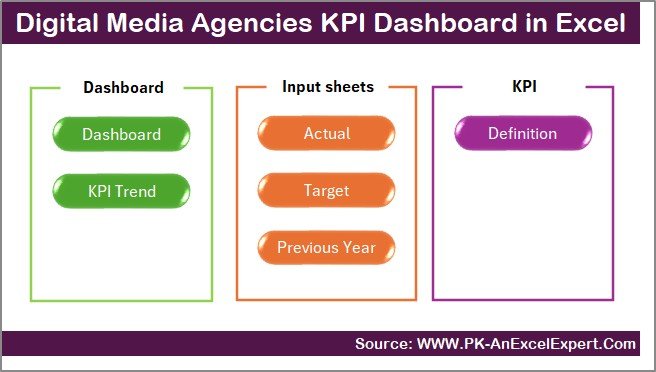
The dashboard contains 7 fully functional worksheets, each designed for a specific purpose. These pages work together to give a complete view of the agency’s performance.
Let us explore each sheet in detail.
Summary Page
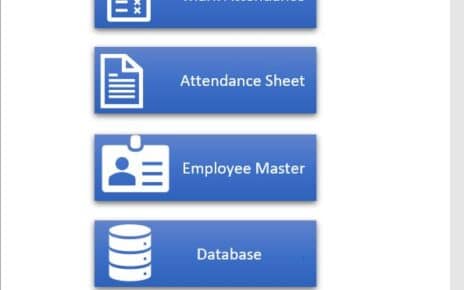
The Summary Page acts as the central navigation hub. It contains six smart buttons, each linked to one of the dashboard sheets. Because of this setup, users do not waste time scrolling or searching through sheets. They jump directly to the page they want to analyze.
This page keeps the file user-friendly and improves workflow for all users—managers, analysts, and executives.
Click to buy Digital Media Agencies KPI Dashboard in Excel
Dashboard Sheet Tab
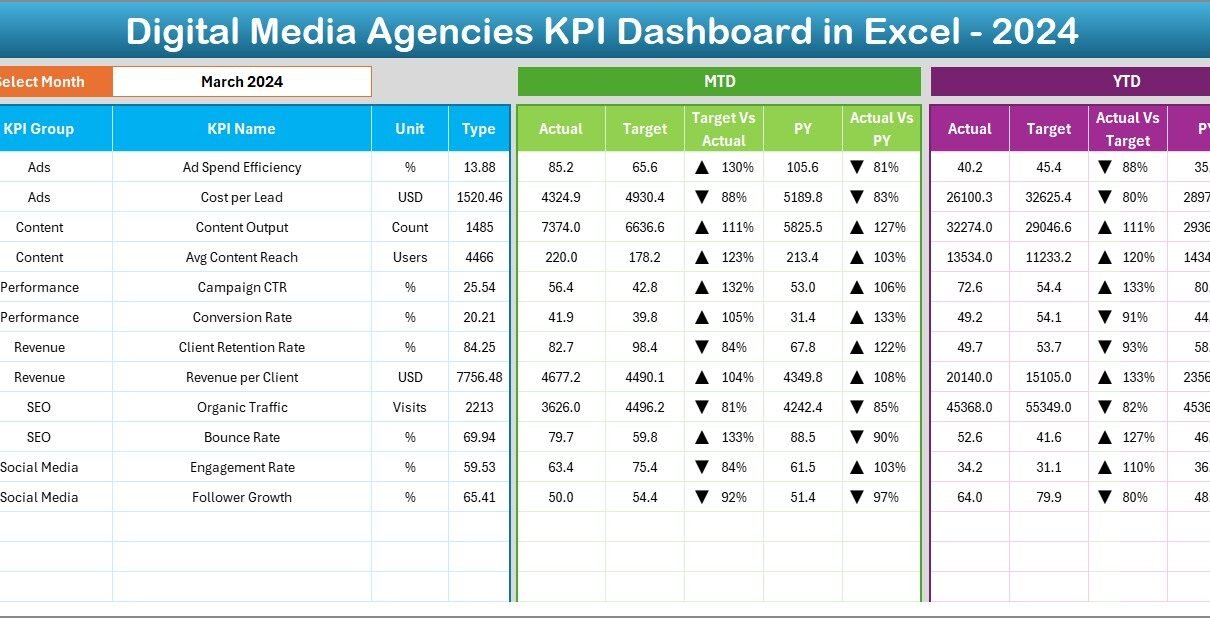
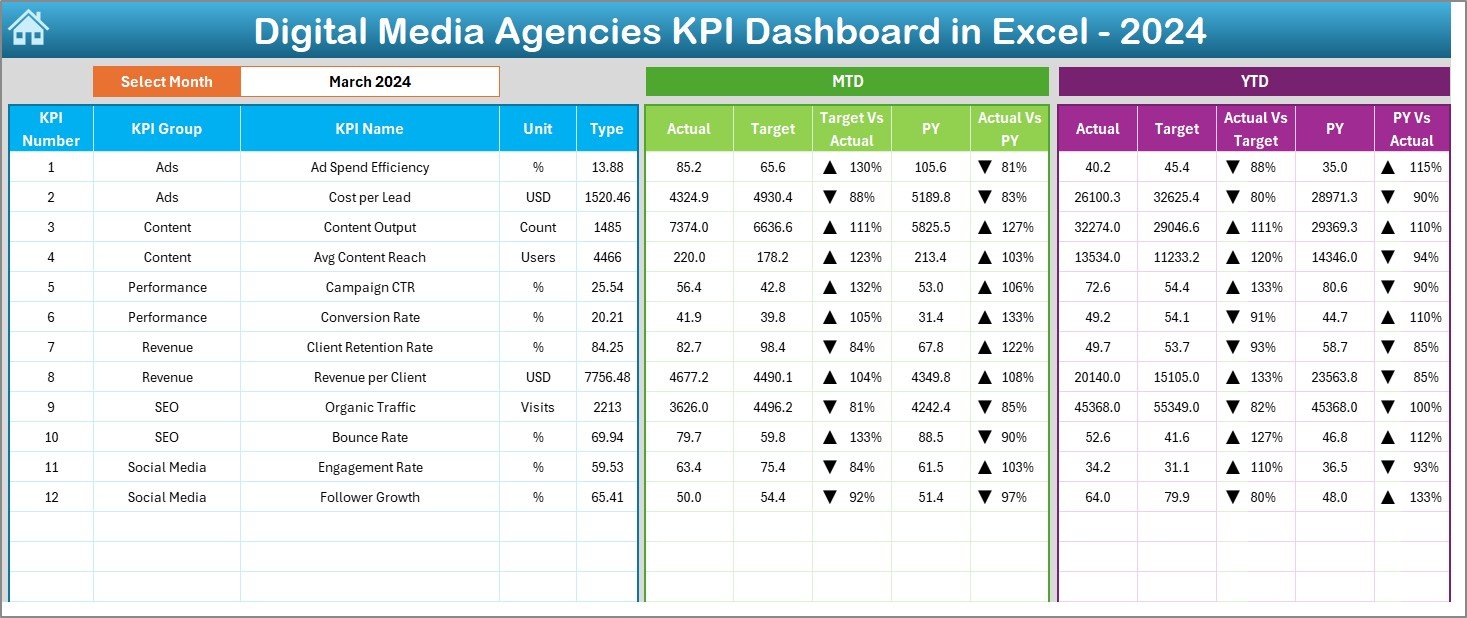
The Dashboard sheet is the main analysis page of this entire Excel file. It displays all digital media KPIs in a clear visual format, making it the most important worksheet.
Key Highlights:
- A drop-down in cell D3 allows the user to select any month.
- Once the month changes, the complete dashboard updates instantly.
- You can see MTD (Month-to-Date) and YTD (Year-to-Date) values.
- The dashboard displays Actual, Target, and Previous Year numbers side by side.
- Conditional formatting uses up/down arrows to show performance direction.
- Target vs Actual and PY vs Actual comparisons become easier.
This setup gives instant clarity about which KPIs improved, which lagged behind, and which need immediate action.
Click to buy Digital Media Agencies KPI Dashboard in Excel
Trend Sheet Tab
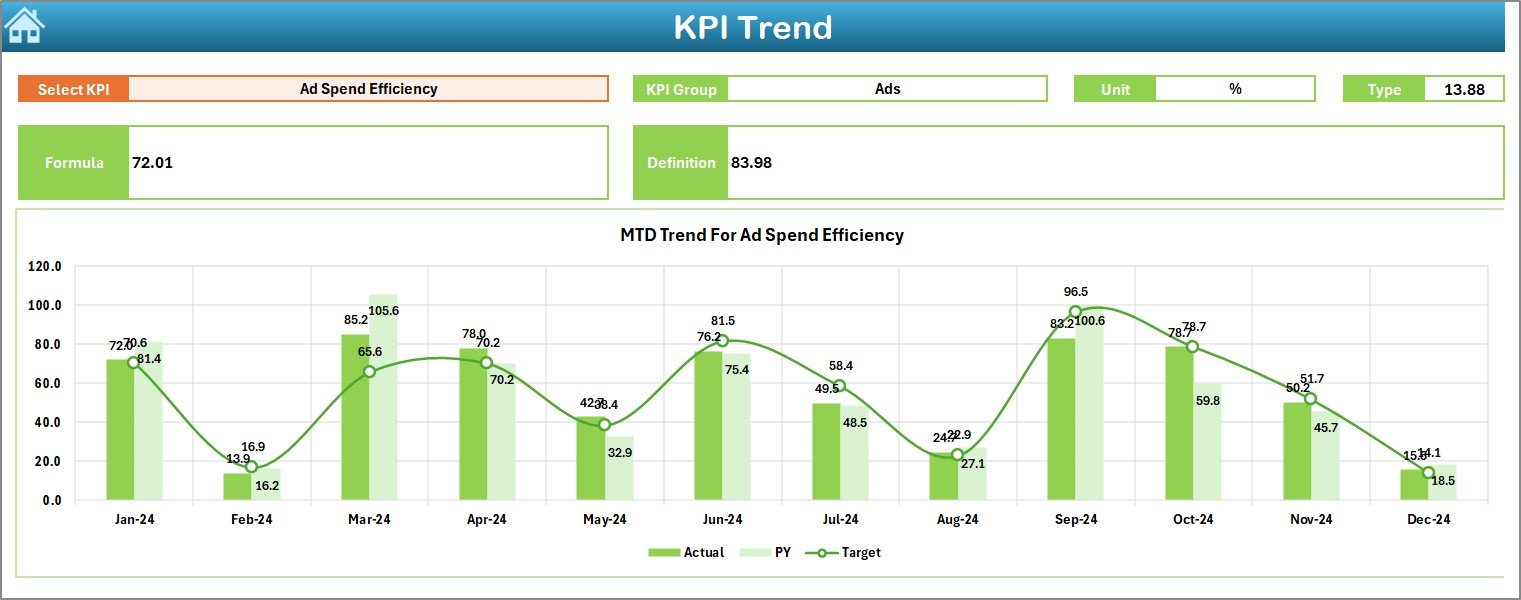
The Trend sheet helps track how each KPI performs over time. Because digital media KPIs evolve every month, this page becomes extremely valuable.
Features of the Trend Page:
- A drop-down in cell C3 helps select any KPI.
- The sheet shows KPI Group, Unit, Formula, and Definition.
- It displays Type of KPI—UTB (Upper the Better) or LTB (Lower the Better).
- The page presents two charts:
- MTD Trend Chart
- YTD Trend Chart
- Actual, Target, and Previous Year values appear together for easier comparison.
This sheet helps teams understand whether performance improves, declines, or stays stable.
Click to buy Digital Media Agencies KPI Dashboard in Excel
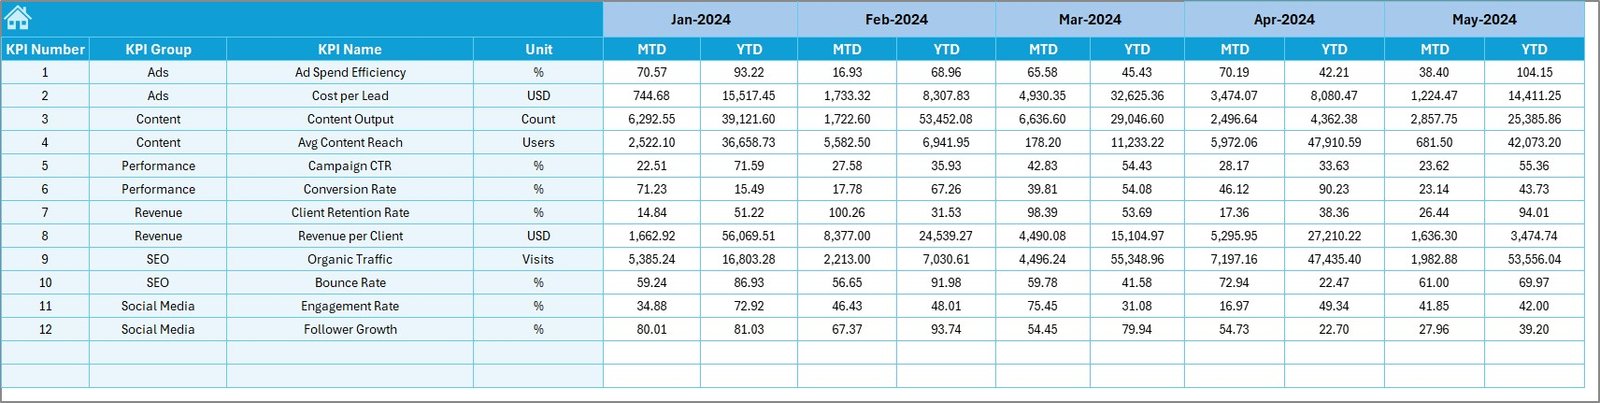
Actual Numbers Input Sheet
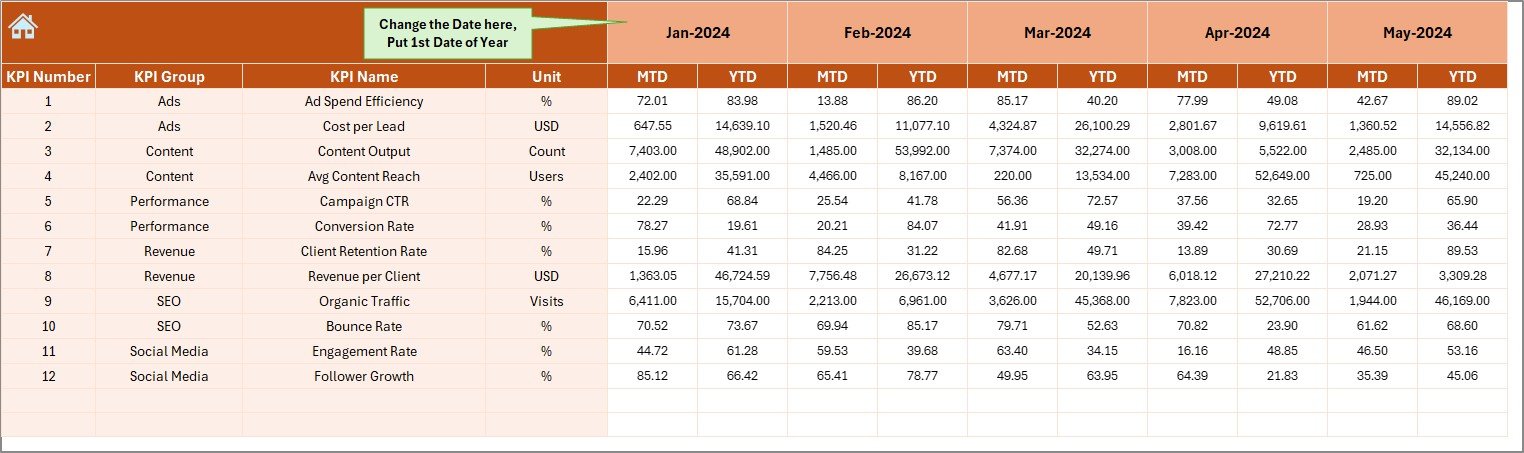
The Actual Numbers sheet is where users enter performance data for every month.
Important Details:
- Enter MTD and YTD numbers for each KPI.
- The month selection happens in cell E1.
- When you update the first month of the year, calculations for all other months adjust automatically.
This page ensures accuracy and removes confusion between monthly and yearly figures.
Click to buy Digital Media Agencies KPI Dashboard in Excel
Target Sheet Tab
The Target sheet contains the performance expectations for each KPI.
Users enter:
- Monthly Target
- YTD Target
Since all dashboards rely on target comparison, this sheet becomes a critical part of the overall structure.
Click to buy Digital Media Agencies KPI Dashboard in Excel
Previous Year Numbers Sheet Tab
This sheet stores the Previous Year numbers for all KPIs. These values help compare current performance against last year’s performance. Because year-over-year growth is one of the most essential metrics for a digital media agency, this sheet acts as the foundation for meaningful trend analysis.

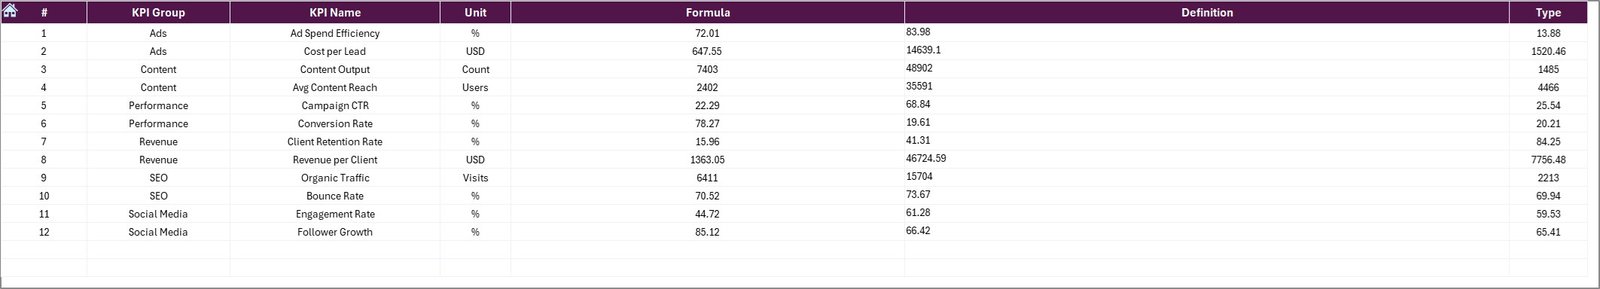
KPI Definition Sheet Tab
This sheet contains details of each KPI, such as:
- KPI Name
- KPI Group
- Unit of Measurement
- Formula
- KPI Description
It works as a reference guide for all users so new team members understand each KPI quickly. The definitions bring standardization across the agency and eliminate confusion during reporting.
Key Advantages of Digital Media Agencies KPI Dashboard in Excel
A well-designed Excel KPI dashboard helps digital media agencies in many ways. Here are the major advantages:
Clear and Unified KPI Tracking
The dashboard stores every KPI in one single file. This central view helps teams review all performance metrics without opening multiple sheets or tools.
Instant Month-to-Month Comparison
With the drop-down month selector, users switch between different months within seconds. This feature makes it easy to understand:
- What improved
- What dropped
- What stayed consistent
Better Decision Making
Because Actual, Target, and Previous Year numbers appear side by side, managers get instant clarity. They take decisions based on facts, not assumptions.
Easy Trend Analysis
The Trend sheet tells the complete performance story of each KPI. It helps answer questions like:
- Did CTR improve over the last six months?
- How did ROI behave compared to last year?
- Are conversions increasing?
Accurate Reporting Without Errors
All calculations rely on formulas built inside Excel. This reduces manual errors and increases reporting accuracy.
Fast Performance Review for Clients
Agencies use the dashboard during client meetings. Because the dashboard updates automatically, clients get fresh and correct numbers every time.
Best Practices for Using Digital Media Agencies KPI Dashboard in Excel
To get the full benefit of the dashboard, agencies must follow certain best practices.
Update Actual Numbers Every Week
Digital media campaigns move quickly. Frequent updates help teams respond to performance changes immediately.
Set Realistic Targets
Targets must match industry norms and campaign types. Unrealistic targets create unnecessary stress and misleading reporting.
Keep KPI Definitions Clear
When all team members understand KPIs clearly, reporting becomes smooth and consistent.
Review MTD and YTD Results Separately
Both views offer different insights. MTD tells the current month’s story, while YTD reveals long-term patterns.
Compare Current Year with Previous Year
Year-over-year comparisons help agencies evaluate long-term progress.
Use Conditional Formatting Wisely
Up/down arrows give powerful visual signals. Teams understand performance direction instantly.
Maintain the File Structure
Never rename sheet tabs or change formulas without understanding the complete workflow. This keeps the dashboard stable.
How Does This Dashboard Help Improve Agency Performance?
Digital media agencies handle many responsibilities. This dashboard strengthens operations in several important ways:
- It supports data-driven decisions.
- It improves team productivity.
- It reduces reporting time.
- It standardizes KPI measurement.
- It speeds up client communication.
- It highlights performance gaps instantly.
As a result, agencies deliver stronger results and build better client relationships.
Conclusion
A Digital Media Agencies KPI Dashboard in Excel becomes a powerful performance management tool for any marketing team. It brings clarity, structure, and accuracy to the reporting process. Because it works inside Excel, users avoid complex software and still enjoy detailed KPI insights.
With its seven well-organized sheets—Summary, Dashboard, Trend, Actual Inputs, Target Inputs, Previous Year Data, and KPI Definitions—the dashboard creates a complete performance ecosystem. It empowers agencies to understand trends, evaluate targets, identify gaps, and take corrective actions quickly.
When teams use this dashboard regularly, they communicate better, work more efficiently, and improve campaign performance. It becomes an essential tool for every digital media agency that wants to grow, deliver value, and impress clients with well-structured data insights.
Frequently Asked Questions (FAQs)
- Who can use the Digital Media Agencies KPI Dashboard in Excel?
Any digital media agency, marketing team, freelancer, or analyst can use it. It works for SEO, social media, paid ads, and content teams.
- Does this dashboard require advanced Excel skills?
No, the dashboard uses simple formulas, drop-downs, and charts. Beginner-level Excel knowledge is enough.
- Can I add more KPIs?
Yes, you can add as many KPIs as you want by updating the KPI Definition sheet and data input sheets.
- How often should I update the data?
Weekly updates give the best results, but monthly updates also work well.
- Can this dashboard replace professional BI tools?
If your reporting needs are simple, it works perfectly. For advanced automation, BI tools offer additional features.
- Will the dashboard work on Excel for Mac?
Yes, all formulas and charts work on both Windows and Mac versions of Excel.
Visit our YouTube channel to learn step-by-step video tutorials
Watch the step-by-step video tutorial:
Click to buy Digital Media Agencies KPI Dashboard in Excel