In today’s fast-evolving educational landscape, institutions must continuously evaluate their performance across multiple dimensions — academic outcomes, administrative efficiency, financial management, and student satisfaction. However, tracking all these key metrics manually can be time-consuming and prone to errors.
That’s where the Education KPI Scorecard in Excel comes in. This dynamic, ready-to-use template enables schools, colleges, and universities to measure and visualize performance using structured KPIs. It empowers administrators to make informed decisions based on accurate data — without requiring specialized software or coding knowledge.
In this article, we’ll explore what an Education KPI Scorecard is, how it works in Excel, its key features, benefits, best practices, and frequently asked questions to help you use it effectively.
Click to buy Education KPI Scorecard in Excel
What Is an Education KPI Scorecard in Excel?
An Education KPI Scorecard is an Excel-based performance tracking tool designed to monitor the most important Key Performance Indicators (KPIs) within an educational institution.
These KPIs represent measurable values that indicate how effectively an institution is achieving its academic, operational, and strategic goals.
Using Excel to manage KPIs makes performance management accessible and efficient. With built-in formulas, charts, and automation, users can easily analyze monthly or yearly results without complex systems.
Why Do Educational Institutions Need a KPI Scorecard?
Managing education involves balancing multiple goals — from improving student outcomes to optimizing resources. Without a structured tracking system, it becomes difficult to evaluate progress or make data-driven improvements.
An Education KPI Scorecard helps to:
- Align institutional goals with measurable targets.
- Visualize performance trends in one place.
- Save time by automating calculations and comparisons.
- Identify strengths and areas needing improvement.
- Facilitate transparency and accountability among departments.
Whether it’s monitoring attendance rates, teacher performance, student satisfaction, or budget utilization, this Excel tool provides the clarity needed for continuous improvement.
Key Features of the Education KPI Scorecard in Excel
The Education KPI Scorecard Template comes with four powerful worksheets that simplify data entry, tracking, and analysis:
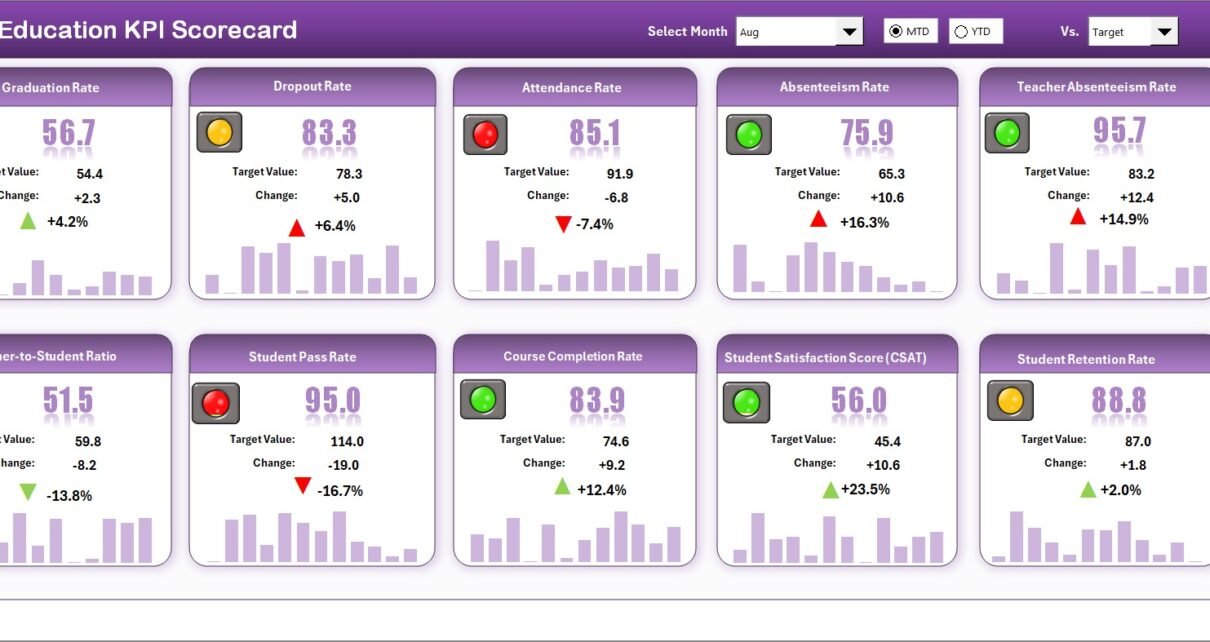
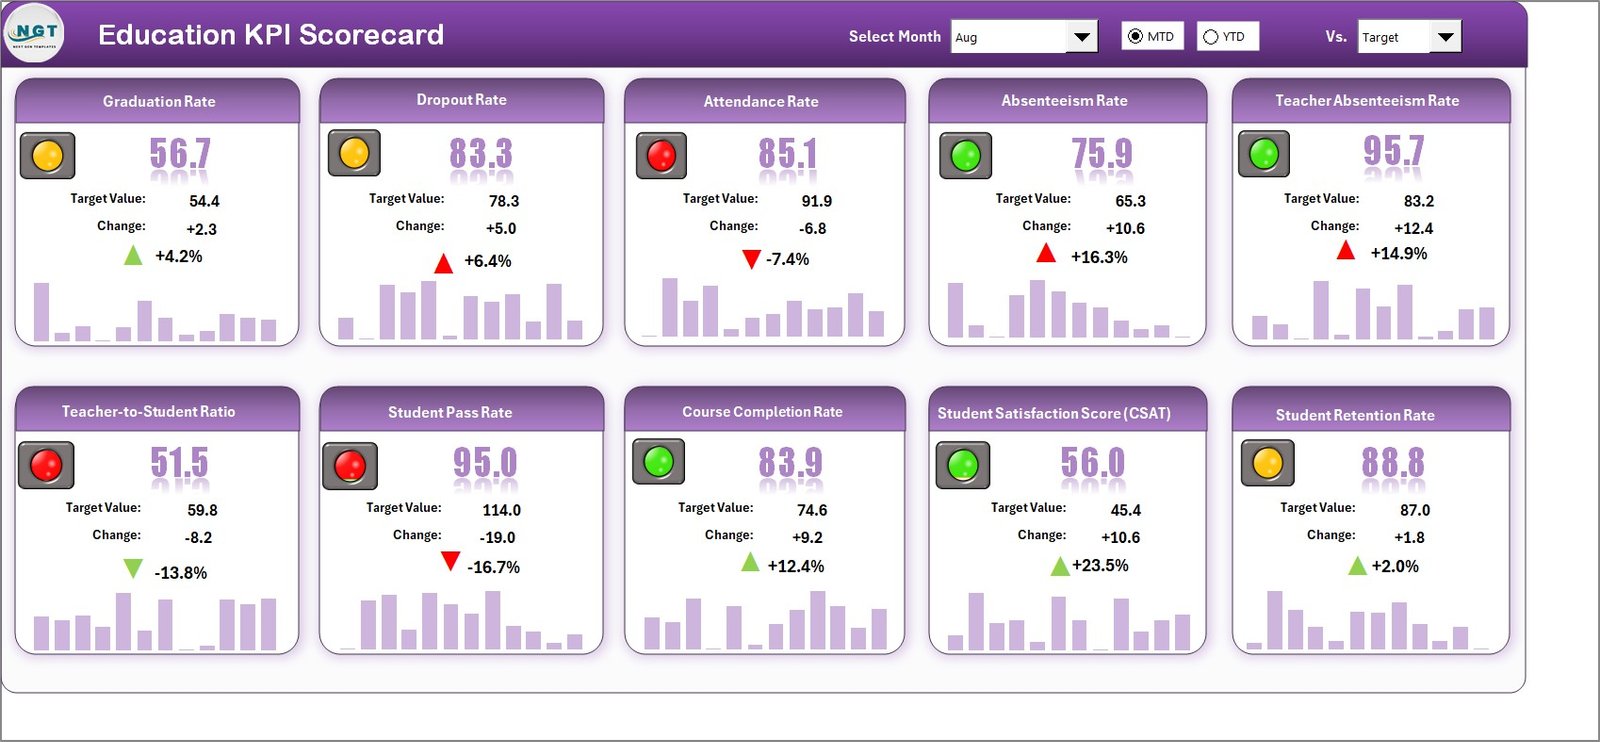
Scorecard Sheet (Main Dashboard)
The Scorecard Sheet is the main interface of the template — your go-to page for reviewing KPI performance.
Key elements include:
- Dropdown Menus: Quickly switch between months or choose Month-to-Date (MTD) and Year-to-Date (YTD) views.
- Actual vs Target Comparison: Instantly compare actual performance values against the target.
- Color-Coded Indicators: Use visual signals (like green for success, red for underperformance) to make analysis intuitive.
- Comprehensive KPI View: Get a snapshot of all key performance indicators on one page — up to 10 KPIs can be viewed simultaneously.
This sheet acts as the heart of the scorecard, offering both high-level insights and granular details.
Click to buy Education KPI Scorecard in Excel
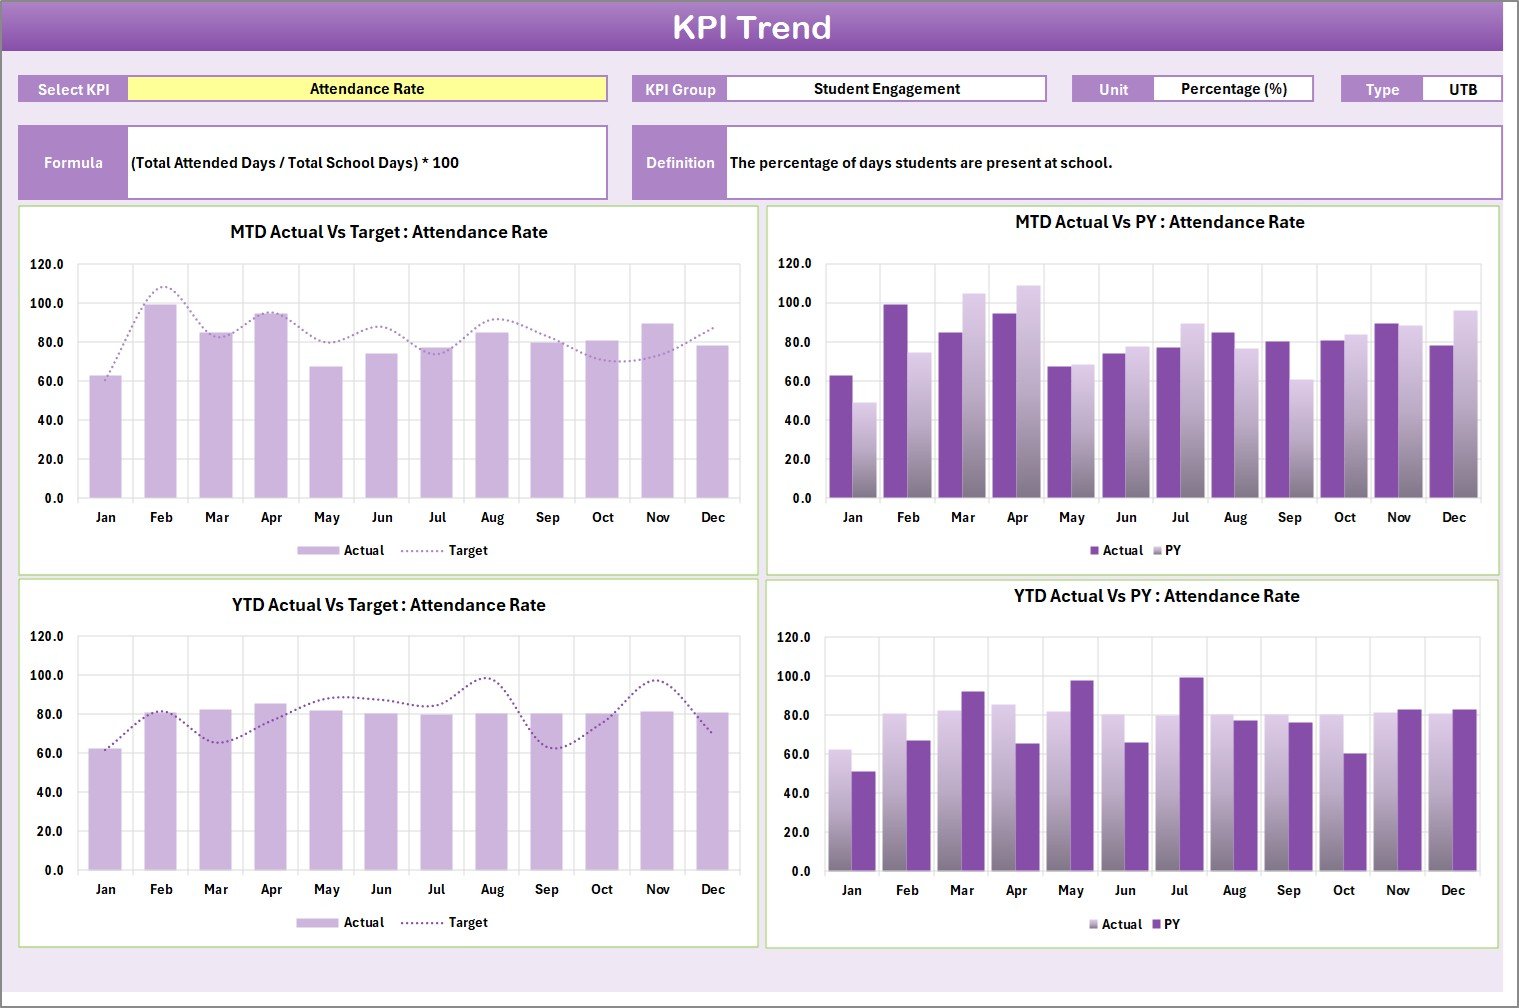
KPI Trend Sheet
The KPI Trend sheet helps visualize performance over time, allowing management to understand patterns, progress, and consistency.
Features include:
- KPI Selector: Pick a KPI name from the dropdown list (cell C3).
- Detailed KPI Info: Displays KPI Group, Unit, Type (UTB — Upper The Better or LTB — Lower The Better), Formula, and Definition.
- Trend Charts: Show MTD and YTD charts for Actual, Target, and Previous Year (PY) data to compare performance evolution.
This sheet makes it easy to track whether improvement initiatives are working and helps forecast future performance.
Click to buy Education KPI Scorecard in Excel
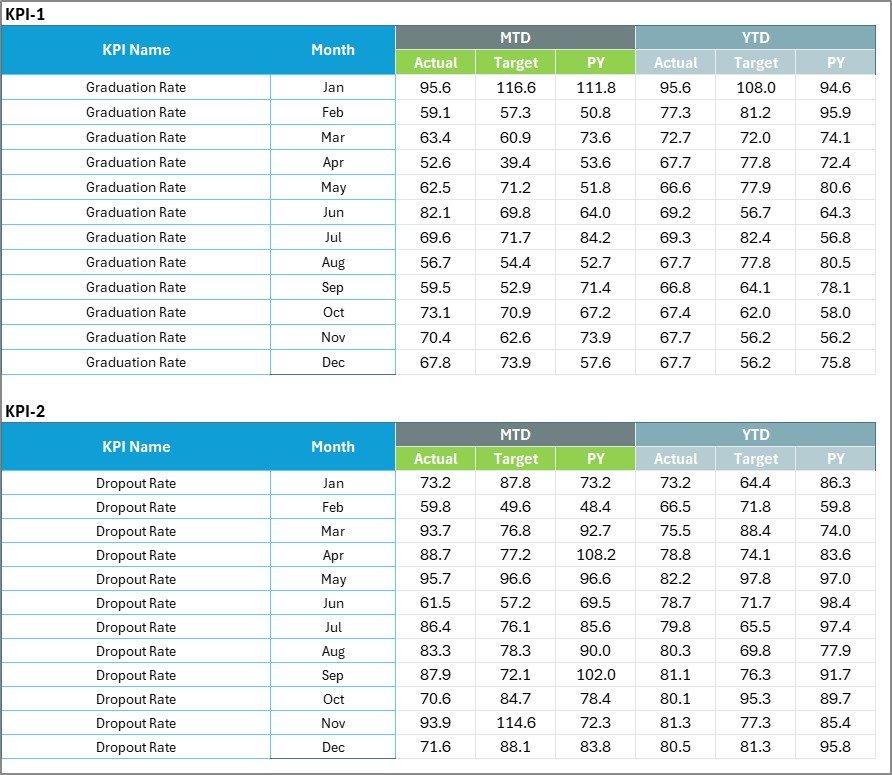
Input Data Sheet
Every analytical tool needs a strong data foundation — that’s what the Input Data Sheet provides.
- Data Entry Section: Record all KPI data, including actual values, targets, and any other key figures.
- Ease of Updates: Simply add new results each month to keep the scorecard current.
- Auto-Linked Calculations: Once data is updated, all other sheets (Scorecard and Trend) refresh automatically.
This ensures your performance metrics stay accurate, relevant, and up-to-date.
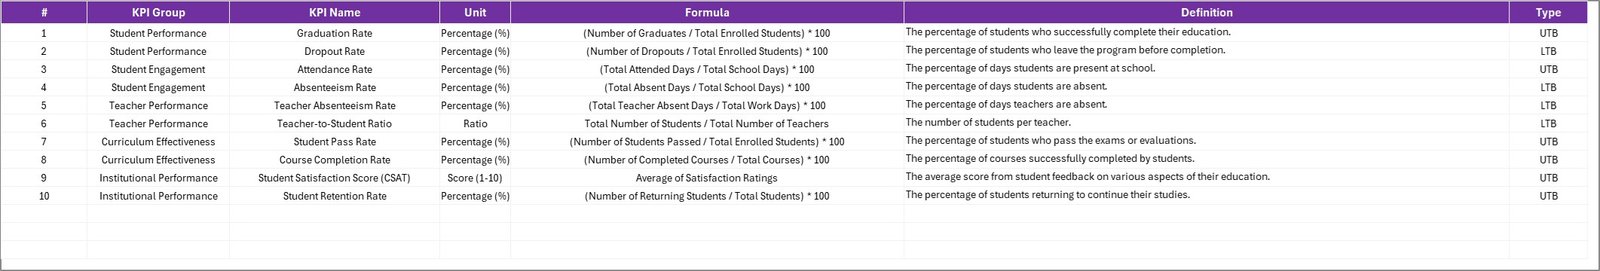
KPI Definition Sheet
This sheet is your KPI Reference Library. It contains all definitions, formulas, and metadata related to each KPI.
You can store details such as:
- KPI Name
- KPI Group (e.g., Student, Financial, Faculty, Operations)
- Unit of Measurement
- Formula
- Definition
Having this reference ensures every team member interprets metrics consistently and avoids confusion when reviewing data.
Click to buy Education KPI Scorecard in Excel
How Does the Education KPI Scorecard Work?
The template works through structured data integration and automated visualization in Excel.
Here’s how it functions step by step:
- Data Entry: Enter or update KPI data (actuals and targets) in the Input Data Sheet.
- Automatic Calculation: Excel formulas compute MTD, YTD, and variance automatically.
- Visualization: The Scorecard and KPI Trend sheets display this data in easy-to-read visuals.
- Review and Action: Decision-makers analyze trends, compare performance, and take necessary actions.
No advanced Excel knowledge is required — all formulas and visuals are pre-built.
Advantages of Education KPI Scorecard in Excel
Using this Excel-based scorecard brings numerous benefits to educational institutions:
🎯 1. Centralized Performance Tracking
All performance metrics are consolidated into one Excel workbook, eliminating the need for multiple reports or systems.
⚡ 2. Data-Driven Decision Making
Charts, conditional formatting, and MTD/YTD comparisons enable quick insights for smarter decisions.
🧠 3. Easy to Customize
The Excel format allows you to modify KPI names, formulas, or visuals to match your institution’s structure.
🧾 4. Real-Time Monitoring
As soon as new data is entered, the dashboard updates instantly — no manual recalculations needed.
💼 5. Cost-Effective Solution
Unlike complex business intelligence tools, Excel requires no expensive licenses or advanced training.
🔍 6. Transparent Performance Communication
Departments can use the same scorecard format for presentations, making communication consistent and clear.
Who Can Benefit from the Education KPI Scorecard?
This Excel template serves a wide range of educational stakeholders, including:
- School Administrators: To monitor institutional goals, teacher performance, and student results.
- College Deans & Principals: To track academic progress and resource utilization.
- Finance Teams: To manage budget performance and cost efficiency.
- Quality Assurance Teams: To evaluate compliance and accreditation readiness.
- Faculty Members: To align teaching performance with institutional KPIs.
Essentially, it’s a single, versatile solution for tracking, analyzing, and improving educational performance.
How to Use the Education KPI Scorecard Template
Follow these simple steps to start using your Education KPI Scorecard:
- Open the Template: Launch the Excel file on your desktop.
- Set KPI Definitions: In the “KPI Definition” sheet, enter your KPI names, groups, units, formulas, and definitions.
- Input Data: Go to the “Input Data” sheet and record actual values and targets for each month.
- View Dashboard: Navigate to the “Scorecard” sheet to see color-coded KPI comparisons.
- Analyze Trends: Use the “KPI Trend” sheet to explore performance over time.
- You can duplicate sheets or modify charts as needed to adapt the template for your institution.
- Best Practices for Using the Education KPI Scorecard
To maximize the effectiveness of your KPI Scorecard, follow these best practices:
- Define SMART KPIs: Ensure each KPI is Specific, Measurable, Achievable, Relevant, and Time-bound.
- Keep Data Updated: Enter actual and target data monthly to maintain accurate insights.
- Use Visual Indicators: Apply color codes or icons to highlight high or low performance areas.
- Limit KPI Count: Track 10–15 core KPIs per department to avoid data overload.
- Ensure Consistent Data Sources: Collect information from reliable, verified systems only.
- Review Trends Quarterly: Compare quarter-on-quarter changes for strategic analysis.
- Engage Stakeholders: Discuss KPI results with staff and faculty to encourage ownership and improvement.
These practices ensure your dashboard remains accurate, actionable, and aligned with institutional goals.
Conclusion
The Education KPI Scorecard in Excel is a must-have tool for educational organizations aiming to enhance accountability, transparency, and performance.
It empowers administrators, faculty, and managers to monitor progress effectively, visualize key trends, and take timely actions.
With its intuitive design, automation, and flexibility, this Excel-based solution offers a cost-efficient alternative to complex software — all while helping institutions stay on track with their strategic goals.
By adopting this tool, you can transform your educational data into a powerful decision-making asset.
Frequently Asked Questions (FAQs)
- What is the main purpose of an Education KPI Scorecard?
The main purpose is to track and visualize institutional performance across academic, administrative, and financial areas using measurable KPIs.
- How many KPIs can I track using this Excel Scorecard?
The template allows tracking up to 10 KPIs on the main scorecard, but you can easily expand it by adding rows.
- Can I customize the KPI list based on my institution’s goals?
Yes. The KPI Definition sheet is fully editable, allowing you to define your own KPI names, formulas, and definitions.
- Is the Education KPI Scorecard suitable for small schools?
Absolutely. The template works for any scale — from small schools to large universities — and can be adjusted as needed.
- Do I need advanced Excel skills to use this scorecard?
No. The template is designed for users with basic Excel knowledge. Most calculations and visuals update automatically.
- Can this Scorecard be integrated with Power BI or Google Sheets?
Yes. You can export data from Excel and connect it to Power BI or import it into Google Sheets for advanced visualization.
- How often should I update the KPI data?
It’s best to update the data monthly or quarterly, depending on your reporting cycle, to ensure accurate insights.
Visit our YouTube channel to learn step-by-step video tutorials
Watch the step-by-step video tutorial:
Click to buy Education KPI Scorecard in Excel