Introduction
The Food Supply Chain KPI Scorecard is an essential tool designed to help businesses monitor and enhance the performance of their food supply chain operations. This ready-to-use scorecard template provides a structured and visual approach to managing key performance indicators (KPIs), enabling companies to track critical metrics, compare actual values to targets, and make data-driven decisions efficiently.
Key Features of Food Supply Chain KPI Scorecard
- Comprehensive Dashboard: Get a holistic view of food supply chain performance through an interactive and easy-to-navigate scorecard.
- Multiple Worksheets: The template includes four specialized sheets to manage KPIs effectively – Scorecard Sheet, KPI Trend, Input Data, and KPI Definition.
- Dynamic Data Selection: Use dropdown menus to switch between monthly, month-to-date (MTD), and year-to-date (YTD) metrics.
- Visual Performance Indicators: Color-coded visuals and conditional formatting allow for quick status checks of KPIs.
- Detailed KPI Information: Provides definitions, formulas, KPI groupings, and units to ensure clarity and consistency.
- Trend Analysis: MTD and YTD trend charts enable tracking of actual vs target vs prior year’s numbers for each KPI.
- Easy Data Entry: The Input Data sheet allows seamless updating of KPI results and targets to keep the scorecard current.
Dashboard Pages Explanation
1. Scorecard Sheet
The Scorecard Sheet is the heart of this template. It gives an overview of KPI performance in a clear and concise manner.
- Dropdown Menus: Select the Month, MTD, or YTD to customize the performance analysis.
- Actual vs Target Values: Quickly compare what was achieved against the goals set for each KPI.
- Visual Indicators: Uses color-coded signals to highlight whether KPIs are meeting, exceeding, or falling short of targets.
- Comprehensive KPI Overview: Displays KPIs alongside their month-to-date and year-to-date stats for full transparency.
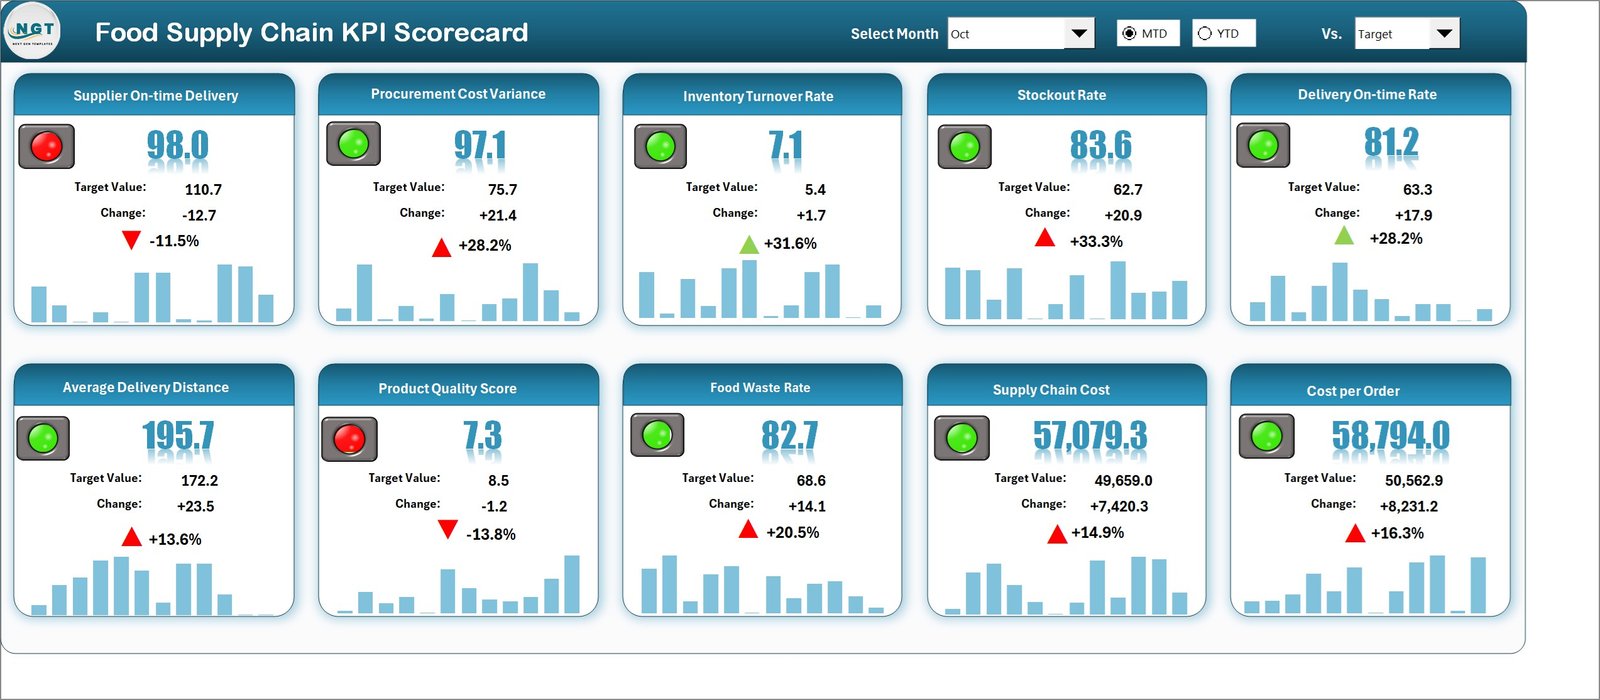 Figure: Food Supply Chain KPI Scorecard
2. KPI Trend Sheet
The KPI Trend Sheet provides deeper insight into the performance trends of individual KPIs.
- KPI Selection Dropdown: Choose any KPI from the list in cell C3 to view its detailed information.
- KPI Metadata: Displays KPI Group, Measurement Unit, KPI Type (whether lower or upper values are better), formula, and definition.
- Trend Charts: Visual charts showcase MTD and YTD actual, target, and prior year (PY) values for easy comparison.
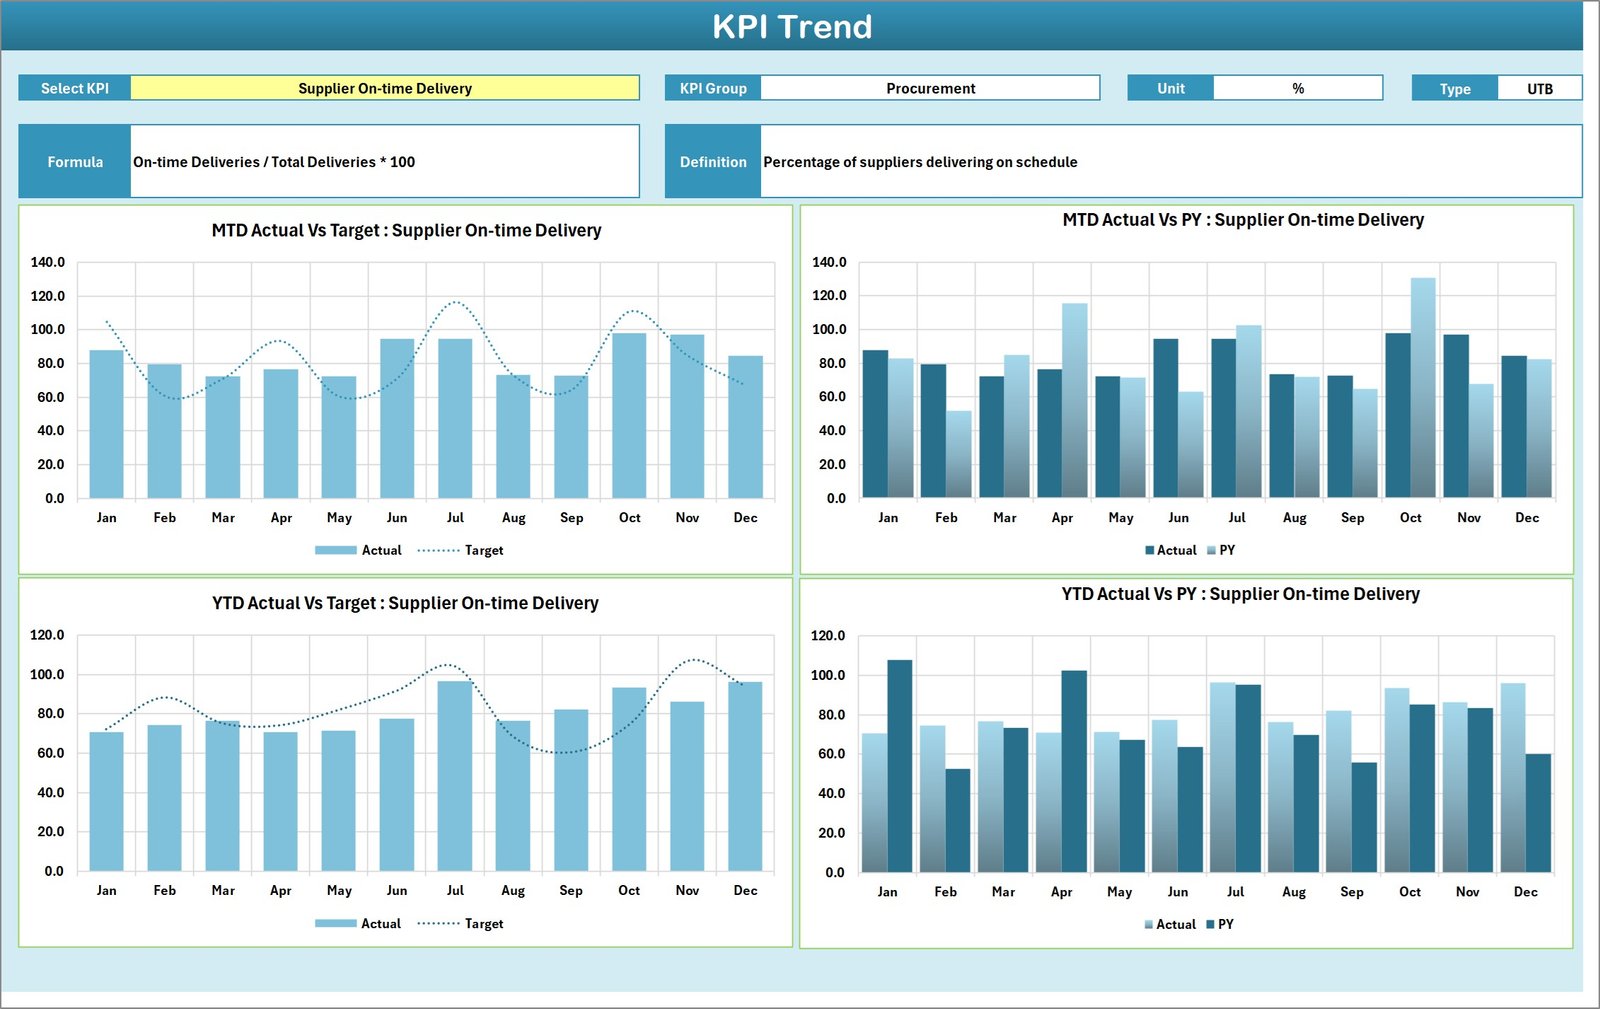 Figure: KPI Trend Sheet
3. Input Data Sheet
This sheet is where all KPI data entries are recorded and updated.
- Data Entry Fields: Record actual values, targets, and other critical metrics for each KPI.
- Flexibility: Update KPI performance data regularly to keep the scorecard reflective of the latest results.
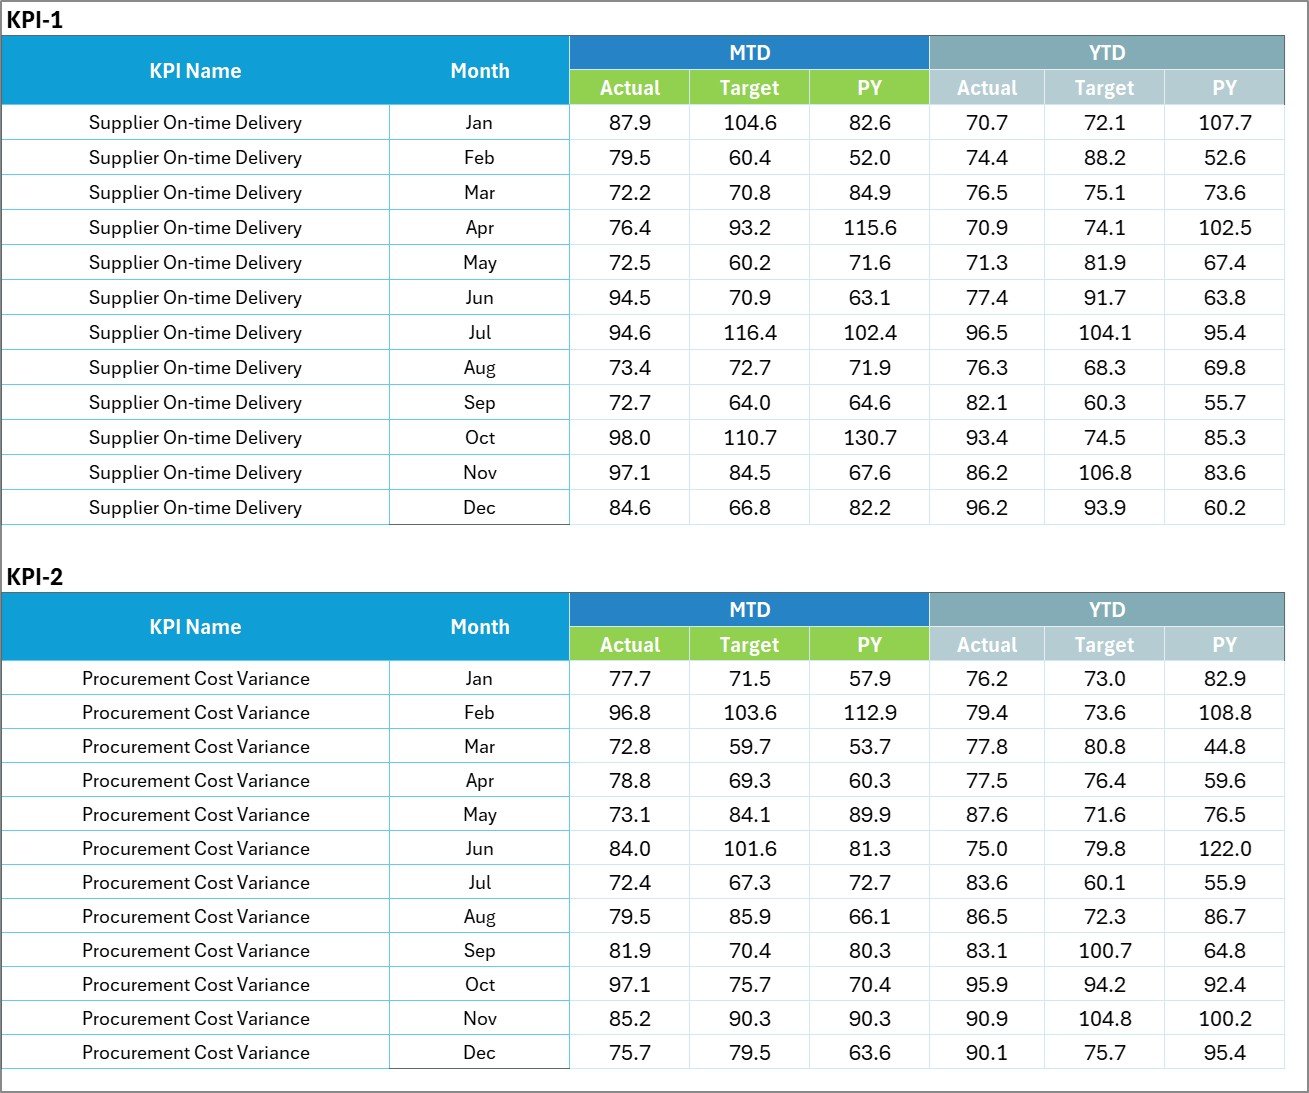 Figure: Input Data Sheet
4. KPI Definition Sheet
This tab holds all key details about each KPI, ensuring clarity and standardization across the team.
- KPI Information: Enter KPI Name, Group, Unit, formula, and a detailed definition.
- Transparency: Supports understanding of each metric’s purpose and calculation method.
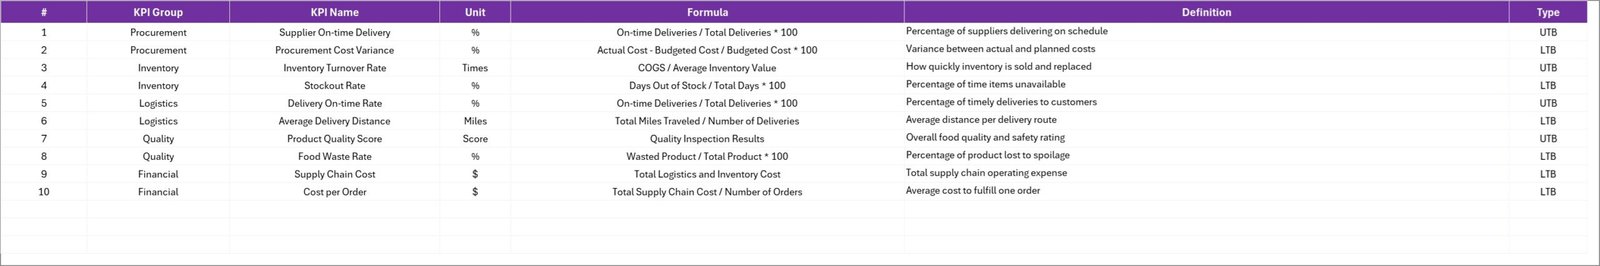 Figure: KPI Definition sheet tab
Advantages of Food Supply Chain KPI Scorecard
- Improved Visibility: Centralizes supply chain data for instant access to performance metrics.
- Better Decision Making: Helps identify bottlenecks and areas needing improvement quickly.
- Enhanced Accountability: Clear comparisons between actual and target metrics promote responsibility.
- Time-Saving: Automated dropdown menus and conditional formatting reduce manual analysis time.
- Scalability: Suitable for small businesses and large enterprises managing complex supply chains.
- Customization: Easily modified to meet unique business needs and KPI sets.
Opportunities for Improvement
Click to Buy Food Supply Chain KPI Scorecard in Excel
- Integration with ERP Systems: Automate data updates by linking the scorecard with enterprise resource planning software.
- Mobile Accessibility: Develop smartphone-compatible versions for managers on the go.
- Advanced Analytics: Incorporate forecasting models and AI-driven insights to predict supply chain trends.
- Collaborative Features: Add multi-user access for team collaboration and real-time updating.
Best Practices
- Regular Data Updates: Keep the Input Data Sheet current to ensure scorecard accuracy.
- Clear KPI Definitions: Avoid confusion by consistently detailing KPI formulas and measurement units.
- Use Visual Cues: Employ color coding to make compliance or issues instantly recognizable.
- Monitor Trends: Leverage the KPI Trend Sheet to identify emerging patterns and adjust strategies accordingly.
- Engage Stakeholders: Use the scorecard as a communication tool to align cross-functional teams on supply chain goals.
FAQs
Click to Buy Food Supply Chain KPI Scorecard in Excel
What KPIs are included in the Food Supply Chain KPI Scorecard?
The scorecard covers various supply chain KPIs relating to supplier performance, inventory management, delivery timelines, quality control, and waste reduction, though you can customize it to include more.
Can I customize the Food Supply Chain KPI Scorecard template?
Yes, the template is fully customizable to fit your specific business processes and KPIs.
How often should KPIs be updated in the scorecard?
Ideally, KPIs should be updated monthly or in real-time if your system allows, to maintain accuracy and relevance.
Is the scorecard suitable for small businesses?
Absolutely. The template is scalable and can be adapted for businesses of all sizes.
Conclusion
Implementing the Food Supply Chain KPI Scorecard empowers your business to track essential metrics, streamline supply chain operations, and enhance overall efficiency. With its comprehensive design and user-friendly layout, this ready-made template serves as a decision-making powerhouse. Stay proactive in your food supply management by leveraging this scorecard to analyze performance trends, identify improvement areas, and meet your strategic goals.
For more resources on optimizing business dashboards, visit Microsoft’s official Excel support page.
Visit our YouTube channel to watch the demo: Youtube.com/@NextGenTemplates
Click to Buy Food Supply Chain KPI Scorecard in Excel