Franchises have become one of the most powerful business models across industries. From food and retail to education and healthcare, the franchise model allows organizations to expand faster while maintaining consistent quality. However, managing a franchise network comes with challenges. Business owners need a structured way to track performance, compare results across locations, and ensure that each branch contributes to overall growth.
This is where a Franchise Performance KPI Dashboard in Excel plays a vital role. It provides a centralized system to monitor performance indicators, track monthly and yearly trends, and measure results against targets. Instead of relying on guesswork or scattered reports, the dashboard helps decision-makers analyze data at a glance and make informed choices.
Click to buy Franchise Performance KPI Dashboard In Excel
In this article, we will explore what a Franchise Performance KPI Dashboard is, how it works, its advantages, and the best practices to maximize its potential.
What Is a Franchise Performance KPI Dashboard?
A Franchise Performance KPI Dashboard is an Excel-based tool designed to track the key performance indicators (KPIs) of franchise operations. It consolidates data from different outlets or units into a single interactive file. The dashboard provides month-to-date (MTD), year-to-date (YTD), and previous year (PY) comparisons with easy-to-read charts, tables, and conditional formatting.
This tool eliminates manual reporting and creates an automated system where franchise owners and managers can review performance in real time. By using slicers, drop-down menus, and interactive charts, the dashboard becomes not only practical but also easy to use.
Key Features of the Franchise Performance KPI Dashboard
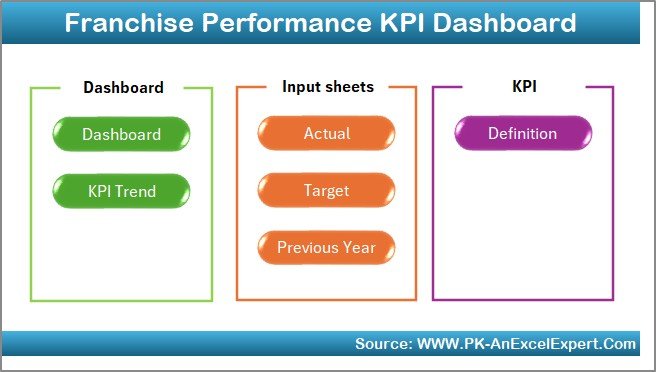
This ready-to-use Excel dashboard includes seven main worksheet tabs, each serving a specific function:
Home Sheet
- Acts as an index page for the dashboard.
- Provides six buttons for quick navigation to other sheets.
- Helps users save time by jumping directly to the required section.
Click to buy Franchise Performance KPI Dashboard In Excel
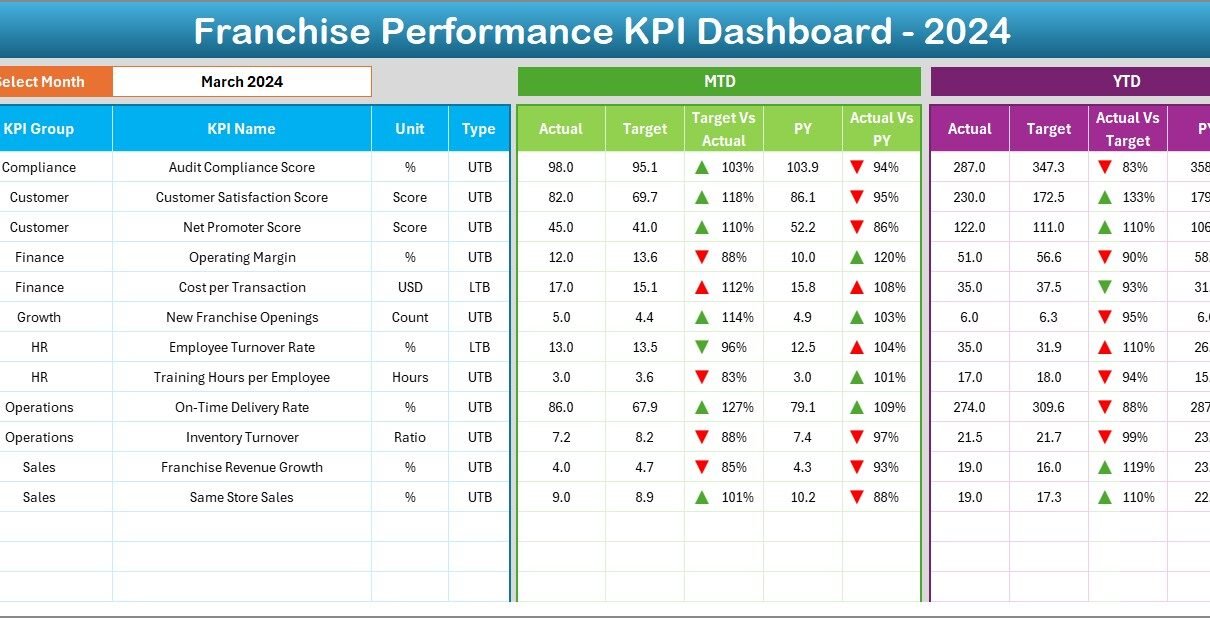
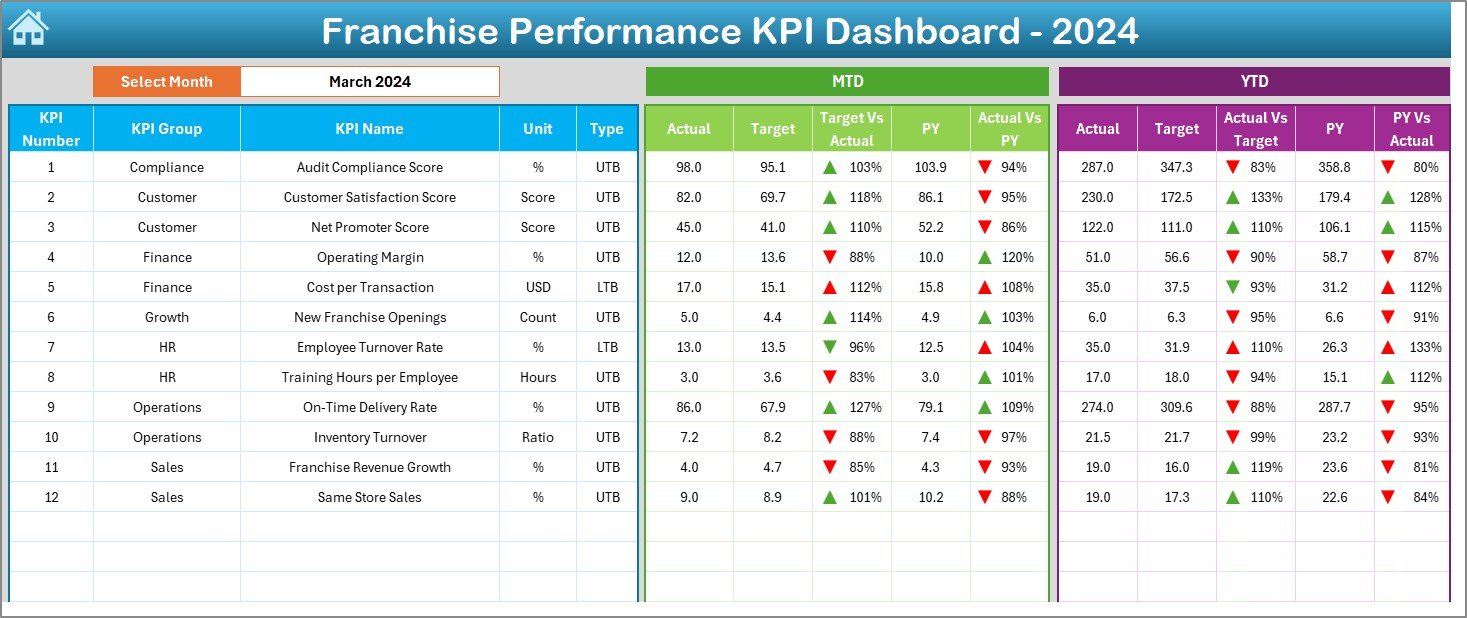
Dashboard Sheet
- The central sheet where all KPI information is displayed.
- Users can select the reporting month from a drop-down menu.
- Displays MTD and YTD Actual, Target, and Previous Year data.
- Shows variance analysis with up and down arrows for quick understanding.
- Uses conditional formatting for visual clarity.
Click to buy Franchise Performance KPI Dashboard In Excel
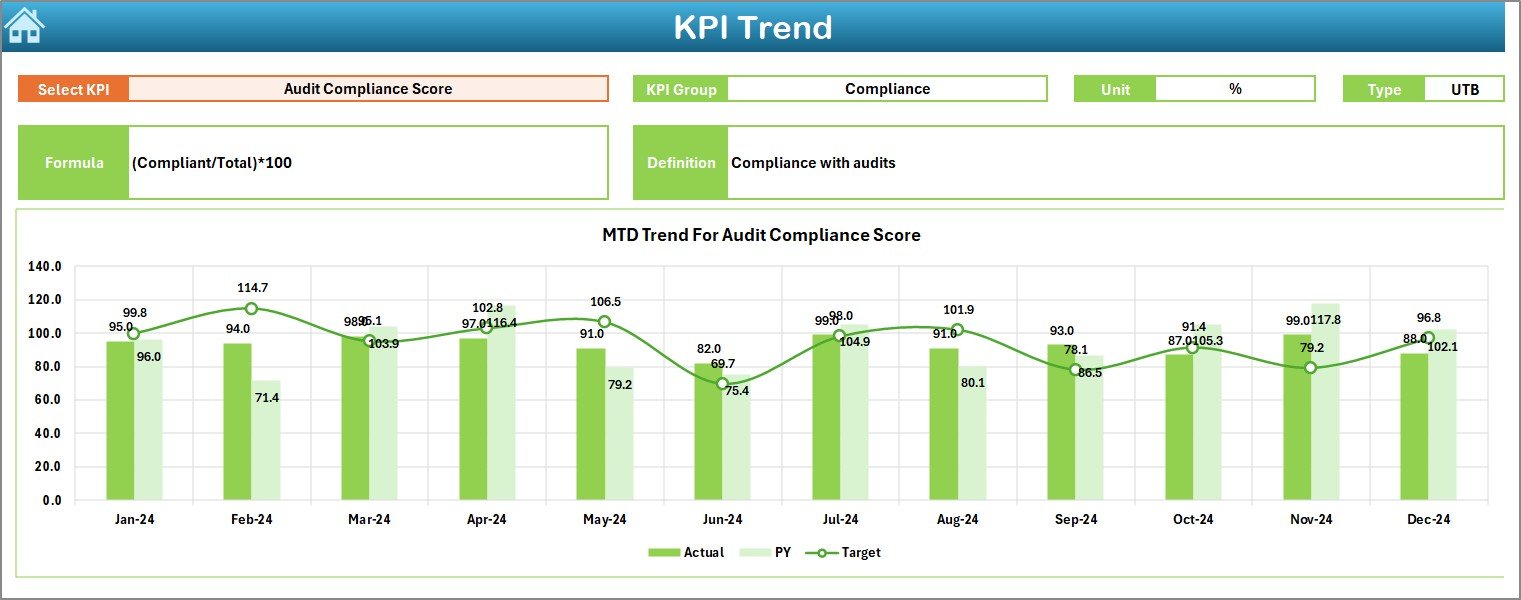
KPI Trend Sheet
- Allows selection of any KPI from a drop-down list.
- Displays details such as KPI Group, Unit, Formula, and Definition.
- Indicates whether the KPI is Lower the Better (LTB) or Upper the Better (UTB).
- Provides trend charts for MTD and YTD comparisons (Actual, Target, and Previous Year).
Click to buy Franchise Performance KPI Dashboard In Excel
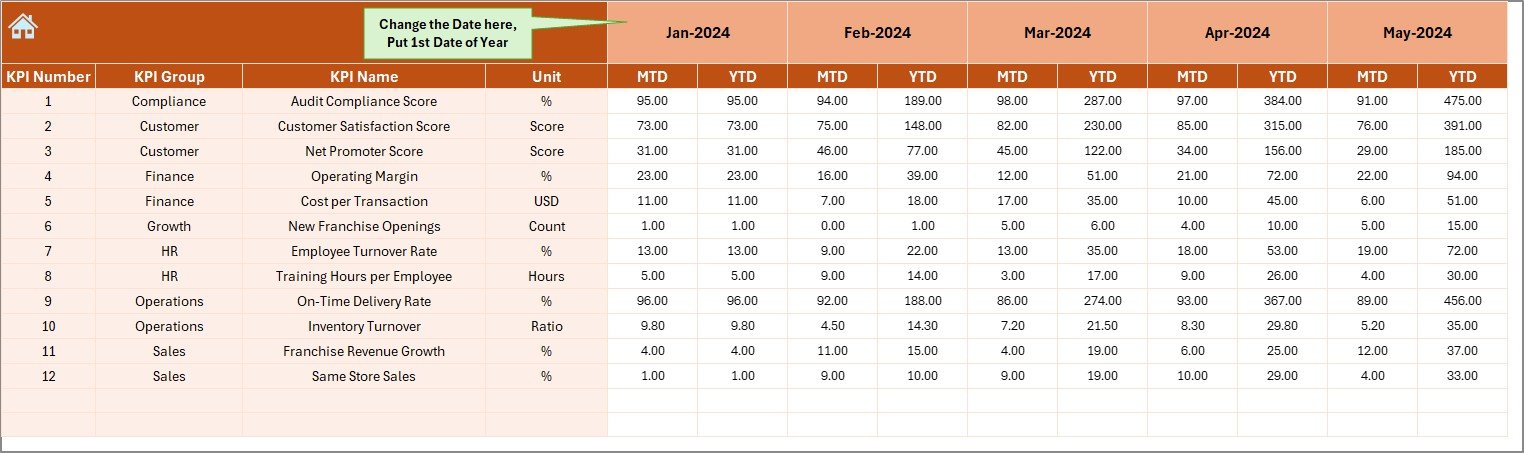
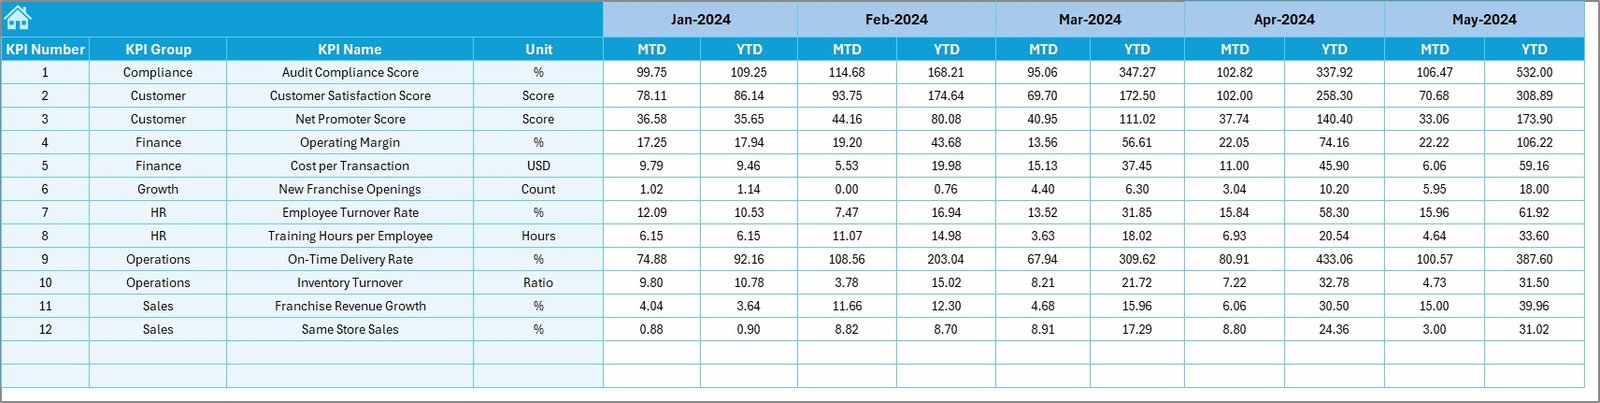
Actual Numbers Input Sheet
- Users enter actual MTD and YTD numbers here.
- A simple input system ensures accuracy and consistency.
- The dashboard automatically updates once the data is entered.
Target Sheet
- Stores the target numbers for each KPI on both MTD and YTD levels.
- Makes it easy to compare actual performance against expectations.
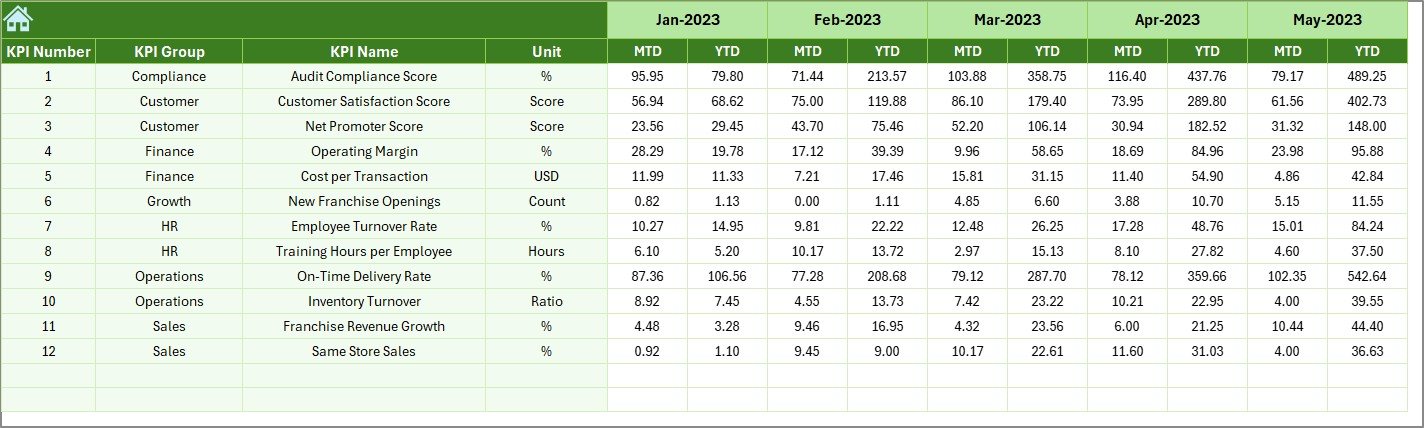
Previous Year Numbers Sheet
- Keeps a record of last year’s MTD and YTD numbers.
- Essential for understanding year-on-year growth or decline.
Click to buy Franchise Performance KPI Dashboard In Excel
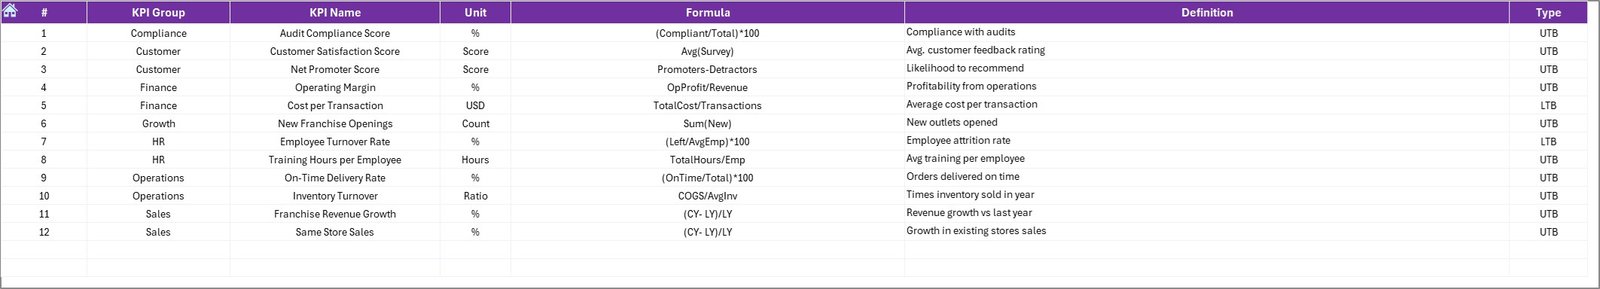
KPI Definition Sheet
- A reference sheet listing all KPIs with their Group, Unit, Formula, and Definition.
- Ensures clarity for all stakeholders by providing precise definitions.
-
KPI Definition Sheet
Why Do Businesses Need a Franchise Performance KPI Dashboard?
Franchise networks face unique challenges such as:
- Ensuring standardized operations across multiple outlets.
- Tracking financial performance against corporate expectations.
- Measuring customer satisfaction and service quality.
- Maintaining consistency while scaling operations.
A Franchise Performance KPI Dashboard addresses these challenges by:
- Centralizing data into one platform.
- Providing real-time insights for decision-making.
- Enabling comparisons between outlets and regions.
- Highlighting areas of improvement with visual alerts.
Advantages of Franchise Performance KPI Dashboard
Using this dashboard provides several benefits:
- Real-time monitoring – Instantly track performance across multiple outlets.
- Target vs. Actual Analysis – Compare performance with defined business goals.
- Year-on-Year Insights – Evaluate growth trends and seasonal performance.
- Data Accuracy – Eliminate human errors from manual reporting.
- Time-Saving – Automated reports reduce time spent preparing presentations.
- Improved Decision-Making – Owners can make data-driven strategies.
Best Practices for Using the Franchise Performance KPI Dashboard
To maximize the potential of this tool, businesses should follow these best practices:
- Define Clear KPIs
- Choose indicators that truly reflect franchise performance, such as Sales Growth, Customer Retention Rate, or Net Profit Margin.
- Standardize Data Entry
- Use consistent formats for input across all outlets to avoid discrepancies.
- Regularly Update Data
- Enter actual numbers promptly to maintain accuracy in the dashboard.
- Encourage Outlet Participation
- Train franchise managers to update and review data themselves.
- Use Trend Analysis
- Review KPI trends monthly to identify patterns and make proactive changes.
- Review Variance Reports
- Pay attention to red flags (negative variances) and address them immediately.
Opportunities for Improvement
While the dashboard is powerful, businesses can further enhance its impact by:
- Integrating Automation – Linking with POS or CRM systems for real-time updates.
- Expanding KPI Coverage – Adding non-financial KPIs such as Employee Engagement or Training Completion Rate.
- Custom Visuals – Using Power BI or Tableau for more advanced visualization if needed.
- Mobile Access – Creating a Google Sheets version for easy mobile use.
Conclusion
The Franchise Performance KPI Dashboard in Excel is an essential tool for franchise owners and managers. It simplifies performance tracking, standardizes reporting, and improves decision-making across the network. By following best practices and updating data regularly, businesses can transform their operations and achieve consistent growth.
Whether you manage a small network or a global franchise, this dashboard helps you stay on top of performance metrics, align franchisees with corporate goals, and drive long-term success.
Frequently Asked Questions (FAQs)
- What is a Franchise Performance KPI Dashboard?
It is an Excel-based tool that tracks key performance indicators across franchise outlets. It provides insights into sales, targets, and yearly comparisons.
- How does the dashboard help franchise owners?
It centralizes performance data, highlights areas of concern, and enables data-driven decision-making.
- Can I customize the KPIs in this dashboard?
Yes, the KPI Definition sheet allows you to define, add, or modify KPIs according to your business needs.
- How often should I update the dashboard?
Ideally, you should update the data monthly to keep track of both MTD and YTD trends.
- Can this dashboard work for non-retail franchises?
Absolutely. The dashboard is flexible and works for any type of franchise—food, education, healthcare, or services.
- Do I need advanced Excel skills to use it?
No, the dashboard is beginner-friendly. Most tasks involve simple data entry and selecting values from drop-down menus.
- Can I compare multiple outlets in this dashboard?
Yes, you can enter data from different outlets and analyze performance trends across them.
- What KPIs should I track in a franchise?
Common KPIs include Revenue Growth, Net Profit, Customer Retention Rate, Sales per Outlet, Employee Turnover, and Operating Costs.
Visit our YouTube channel to learn step-by-step video tutorials
Watch the step-by-step video tutorial:
Click to buy Franchise Performance KPI Dashboard In Excel