In today’s fast-moving logistics industry, data-driven decision-making defines success. Businesses that rely on freight movement — from manufacturing to retail — must monitor delivery efficiency, transit times, fuel costs, and overall shipment performance in real time.
That’s where the Freight Tracking KPI Dashboard in Excel becomes a game-changer.
This ready-to-use Excel dashboard helps logistics managers, operations teams, and supply chain analysts track, compare, and visualize freight performance across months, targets, and previous years. With intuitive charts, KPI cards, and dropdown filters, it brings transparency and control to freight operations like never before.
Click to buy Freight Tracking KPI Dashboard in Excel
What Is a Freight Tracking KPI Dashboard in Excel?
A Freight Tracking KPI Dashboard is a comprehensive Excel-based analytics tool designed to track Key Performance Indicators (KPIs) related to freight management.
It provides a centralized view of critical metrics such as delivery time, shipping cost, damaged shipments, carrier performance, and route efficiency.
By integrating real-time data from your logistics records, this dashboard helps you:
- Identify underperforming routes or carriers
- Compare actual results with targets
- Evaluate progress versus the previous year
- Make quick, data-backed operational decisions
Unlike complex software tools, this Excel dashboard offers simplicity, flexibility, and full customization without the need for technical expertise.
Key Features of the Freight Tracking KPI Dashboard in Excel
The Freight Tracking Dashboard in Excel contains 7 well-structured worksheet tabs, each serving a unique purpose. Let’s explore them in detail:
⃣ Home Sheet — Centralized Navigation Hub
The Home sheet serves as the index page of the dashboard.
It includes six interactive navigation buttons, allowing users to move directly to any key worksheet with a single click.
Purpose:
- Simplifies navigation across multiple sheets
- Provides a professional and organized look
- Reduces time spent scrolling between tabs
The Home sheet ensures that even first-time users can operate the dashboard effortlessly.
Click to buy Freight Tracking KPI Dashboard in Excel
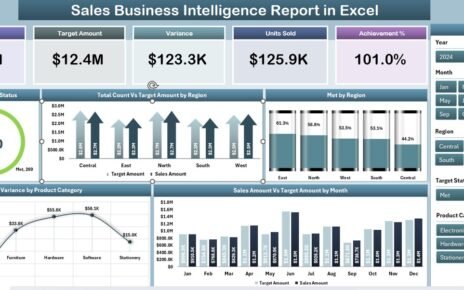
⃣ Dashboard Sheet — The Heart of the Analysis
The Dashboard sheet is the main analytical page where all KPIs are visualized.
On cell D3, users can select the desired month from a dropdown list. The entire dashboard automatically updates to reflect MTD (Month-To-Date) and YTD (Year-To-Date) performance metrics.
Displayed Data Includes:
- MTD Actual, Target, and Previous Year data
- Target vs Actual and PY vs Actual comparisons
- Conditional Formatting with up/down arrows for instant performance interpretation
- YTD Analysis across the same metrics
This dynamic view gives managers the ability to spot trends, identify delays, and act proactively.
⃣ KPI Trend Sheet — Visual Insights at a Glance
The KPI Trend sheet enhances analytical depth through interactive trend charts.
How it works:
- Select any KPI Name from the dropdown in cell C3.
- Instantly view the KPI Group, Unit, Type (UTB – Upper the Better / LTB – Lower the Better), Formula, and Definition.
- Explore MTD and YTD trend charts for Actual, Target, and Previous Year numbers.
These visualizations make it easy to detect upward or downward performance trends and ensure early corrective action.
Actual Numbers Input Sheet — The Core Data Entry Section
This sheet acts as the foundation of the entire dashboard.
Here, users can enter the actual monthly data for both MTD and YTD performance.
Features:
- The month setting in cell E1 defines the start of the year.
- Once the base month is set, all corresponding columns and visuals update dynamically.
- Ensures consistent data entry throughout the year.
Click to buy Freight Tracking KPI Dashboard in Excel
Target Sheet — Define Monthly and Annual Goals
Targets play a key role in performance tracking.
In the Target sheet, users input monthly MTD and YTD targets for each KPI.
Key Benefits:
- Keeps teams aligned with organizational goals
- Enables precise performance comparisons
- Helps management plan resource allocation and process improvements
Click to buy Freight Tracking KPI Dashboard in Excel
Previous Year Numbers Sheet — Benchmarking Made Simple
This sheet allows users to enter last year’s data for each KPI.
By comparing current-year numbers against historical data, users gain valuable context for evaluating growth and operational consistency.
Purpose:
- Track year-over-year improvements
- Identify repeating issues
- Establish performance baselines for forecasting
⃣ KPI Definition Sheet — The Knowledge Repository
The KPI Definition sheet acts as a reference database that defines each KPI’s purpose and measurement logic.
Columns typically include:
- KPI Name
- KPI Group
- Unit
- Formula
- Definition
This ensures every team member understands what each KPI represents, reducing confusion and promoting consistent reporting.
Common KPIs Tracked in the Freight Tracking Dashboard
Why Use Excel for Freight KPI Tracking?
Many organizations wonder why Excel remains the preferred tool for KPI dashboards. Here’s why:
- No Additional Software Required: Excel is widely available and easy to use.
- Complete Customization: Modify formulas, visuals, or KPI logic as per your needs.
- Offline Functionality: Access and analyze data without relying on internet connectivity.
- Integration Ready: Easily import/export data from ERP, TMS, or accounting systems.
- Visual and Interactive: Dynamic charts and conditional formatting make performance tracking simple.
How the Freight Tracking Dashboard Works
The dashboard follows a logical data flow, connecting all sheets through formulas and references:
- Input actual data in the “Actual Numbers” sheet.
- Set targets in the “Target” sheet.
- Add last year’s data for comparison.
- Define KPIs in the “KPI Definition” sheet.
- The Dashboard automatically updates charts, cards, and comparisons.
- Analyze trends using the “KPI Trend” tab.
This system ensures data integrity, automation, and visibility throughout your freight management workflow.
Advantages of Freight Tracking KPI Dashboard in Excel
Implementing this dashboard offers numerous operational, financial, and strategic benefits:
Performance Visibility
Gain a complete, real-time view of freight efficiency across locations, carriers, and timeframes.
Data Accuracy
Automated formulas and structured sheets eliminate manual calculation errors.
Time Savings
Instant monthly and yearly reports without repetitive formatting or recalculations.
Cost Optimization
Compare freight costs against targets to identify overspending and negotiate better carrier rates.
Better Decision-Making
Visual trends and KPI comparisons empower managers to make timely, informed decisions.
Customization
Adaptable to any logistics setup — domestic, international, B2B, or B2C.
Continuous Improvement
Year-over-year comparisons support performance benchmarking and long-term growth.
How to Customize the Dashboard for Your Business
The Freight Tracking Dashboard is flexible and can be tailored for any freight operation. You can:
- Add more KPIs (e.g., route efficiency, customer complaints, fuel variance).
- Include region-based filters for multi-location analysis.
- Modify chart types (bar, line, combo charts) to fit your reporting style.
- Integrate VBA automation for one-click refresh or report export.
- Use Power Query or Power Pivot to connect live data sources.
This adaptability ensures that the dashboard grows with your organization’s needs.
Best Practices for Using the Freight Tracking KPI Dashboard in Excel
To get the most value from your dashboard, follow these proven practices:
- Keep Data Clean: Ensure there are no missing or duplicate entries in Actual and Target sheets.
- Update Monthly: Refresh MTD and YTD data regularly to maintain accuracy.
- Use Consistent KPI Definitions: Ensure that all teams refer to the same calculation logic.
- Leverage Conditional Formatting: Use color indicators to highlight delays or cost overruns.
- Secure the File: Protect formula cells and sheets to prevent accidental changes.
- Automate Where Possible: Use Excel formulas or macros to reduce manual effort.
- Backup Frequently: Keep archived copies for monthly performance reviews.
Adhering to these practices ensures data reliability, efficiency, and long-term usability.
Opportunities for Improvement
Even though this Excel-based dashboard is highly capable, continuous improvement helps enhance its value:
- Add real-time data links with APIs or TMS systems
- Create Power BI integration for advanced analytics
- Automate data import/export using Power Query
- Add report generation macros for PDF summaries
- Implement user-level access for data security
By expanding on these areas, your freight tracking system can evolve into a comprehensive logistics intelligence platform.
Conclusion
The Freight Tracking KPI Dashboard in Excel is more than just a reporting tool — it’s a strategic command center for logistics performance.
It empowers supply chain teams to analyze, optimize, and act on real-time data without needing expensive software or complex systems.
With its 7 smartly designed worksheets, built-in automation, and visual analysis capabilities, this dashboard simplifies performance tracking, improves accuracy, and supports better decision-making across your freight network.
Whether you’re managing 10 shipments or 10,000, this Excel-based solution will help you deliver efficiency, cost control, and continuous improvement.
Frequently Asked Questions (FAQs)
- What is the purpose of a Freight Tracking KPI Dashboard in Excel?
It tracks key logistics metrics like delivery time, freight cost, and carrier performance in a visual, easy-to-read format.
- Can I customize the KPIs and formulas in this dashboard?
Yes. You can edit KPI definitions, formulas, and visual elements as per your business needs.
- Does the dashboard support both MTD and YTD data?
Absolutely. It provides side-by-side comparisons for MTD (Month-To-Date) and YTD (Year-To-Date) performance metrics.
- How can I update the dashboard every month?
Simply input new monthly data into the “Actual Numbers” and “Target” sheets. The Dashboard and Trend pages will update automatically.
- Can I use this dashboard for multiple locations or carriers?
Yes. You can add fields for regions or carrier names to analyze segmented performance.
- Is Excel suitable for professional freight performance tracking?
Yes. Excel remains one of the most versatile tools for logistics analytics, especially for organizations seeking cost-effective solutions.
- What if I want advanced automation?
You can integrate VBA macros or connect Excel with Power BI to create a fully automated freight analytics system.
Visit our YouTube channel to learn step-by-step video tutorials
Watch the step-by-step video tutorial:
Click to buy Freight Tracking KPI Dashboard in Excel