Running a furniture retail business becomes easier when you track the right numbers. Every day, store owners deal with sales volume, customer footfall, inventory turns, delivery issues, returns, and customer satisfaction. Because the furniture market changes quickly, managers need a clear dashboard that shows what works and what needs improvement.
This is where the Furniture Retail KPI Dashboard in Excel helps. It gives a simple way to monitor performance, compare results, set targets, and make the right decisions. In this article, I will explain everything about this dashboard, its features, benefits, best practices, and how you can use it to grow your furniture business.
Click to buy Furniture Retail KPI Dashboard in Excel
What Is a Furniture Retail KPI Dashboard in Excel?
A Furniture Retail KPI Dashboard in Excel shows all the important Key Performance Indicators (KPIs) for your store on one screen. It tracks sales, inventory, operational performance, and customer metrics. Because it works in Excel, you can use it easily, even if you have no technical background.
The dashboard pulls data from your input sheets and converts the numbers into charts, tables, and comparison visuals. You can switch between months, measure progress, compare with targets, and check past performance with a simple click.
Why Do Furniture Retail Stores Need a KPI Dashboard?
Furniture retail runs on multiple variables: seasonal sales, delivery time, material quality, customer choices, inventory cycles, and product trends. If you track these numbers manually, you may make mistakes or lose time.
But when you use a KPI dashboard, you get:
- Clear trends
- Instant insights
- Better decisions
- Accurate forecasting
- Stronger customer experience
Because the dashboard centralizes all KPIs, it becomes a powerful tool for store managers, sales teams, warehouse teams, and business owners.
Key Features of the Furniture Retail KPI Dashboard in Excel
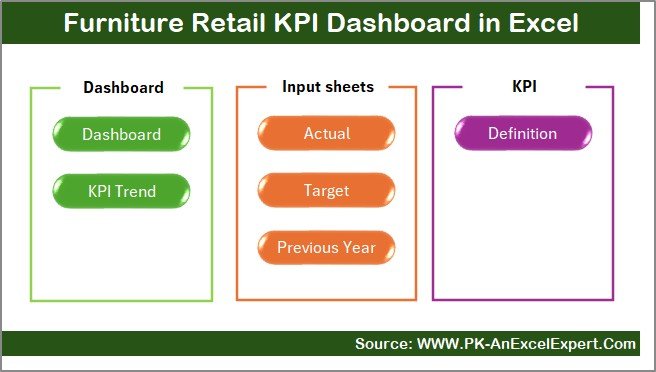
We created this dashboard with seven powerful worksheet tabs. Each tab serves a unique purpose and works together to give a complete view of your business performance.
Summary Page – The Navigation Hub
The Summary Page works like the home screen. You will find six buttons that help you jump directly to the sheet you want. This simple navigation helps you save time and improves the user experience.
You can move quickly between:
- Dashboard
- Trend Analysis
- Actual Input
- Target Sheet
- Previous Year Numbers
- KPI Definition
This page makes the dashboard feel like a ready-to-use application.
Click to buy Furniture Retail KPI Dashboard in Excel
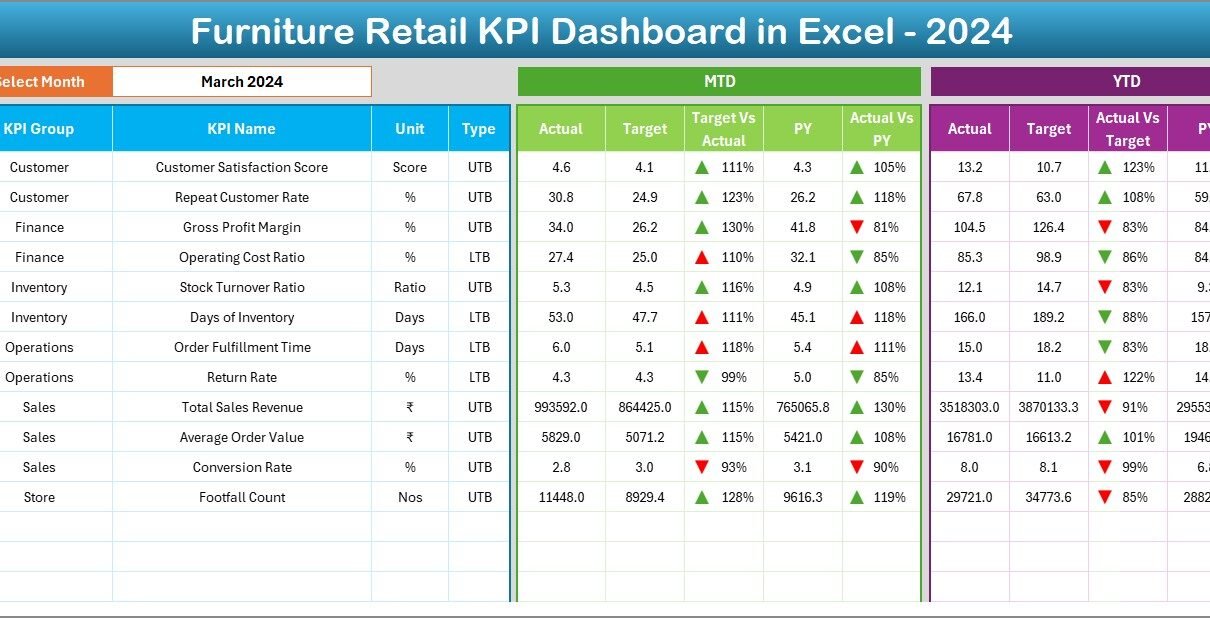
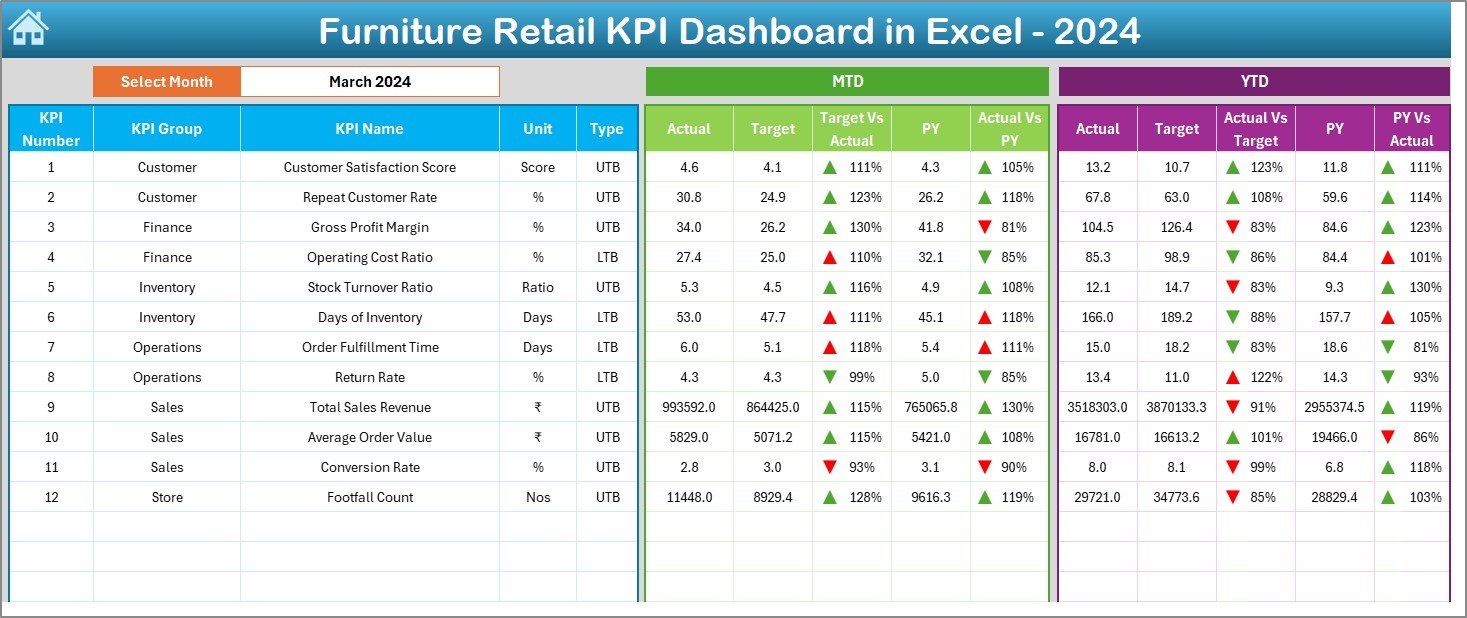
Dashboard Sheet – The Main Performance View
The Dashboard Sheet is the heart of this solution. You can select any month from the drop-down in cell D3, and the entire dashboard updates instantly.
The dashboard shows:
Month-to-Date (MTD) Metrics
- MTD Actual
- MTD Target
- MTD Previous Year
- Target vs Actual
- Previous Year vs Actual
You also see conditional formatting arrows that display whether performance improved or dropped.
Year-to-Date (YTD) Metrics
- YTD Actual
- YTD Target
- YTD Previous Year
- Target vs Actual
- Previous Year vs Actual
This layout helps you understand your short-term and long-term progress in one place.
The visuals are clean, the colors are clear, and the cards show your KPIs in a simple style. You can instantly see which areas need attention, which KPIs meet the target, and which ones require strategy improvement.
Click to buy Furniture Retail KPI Dashboard in Excel
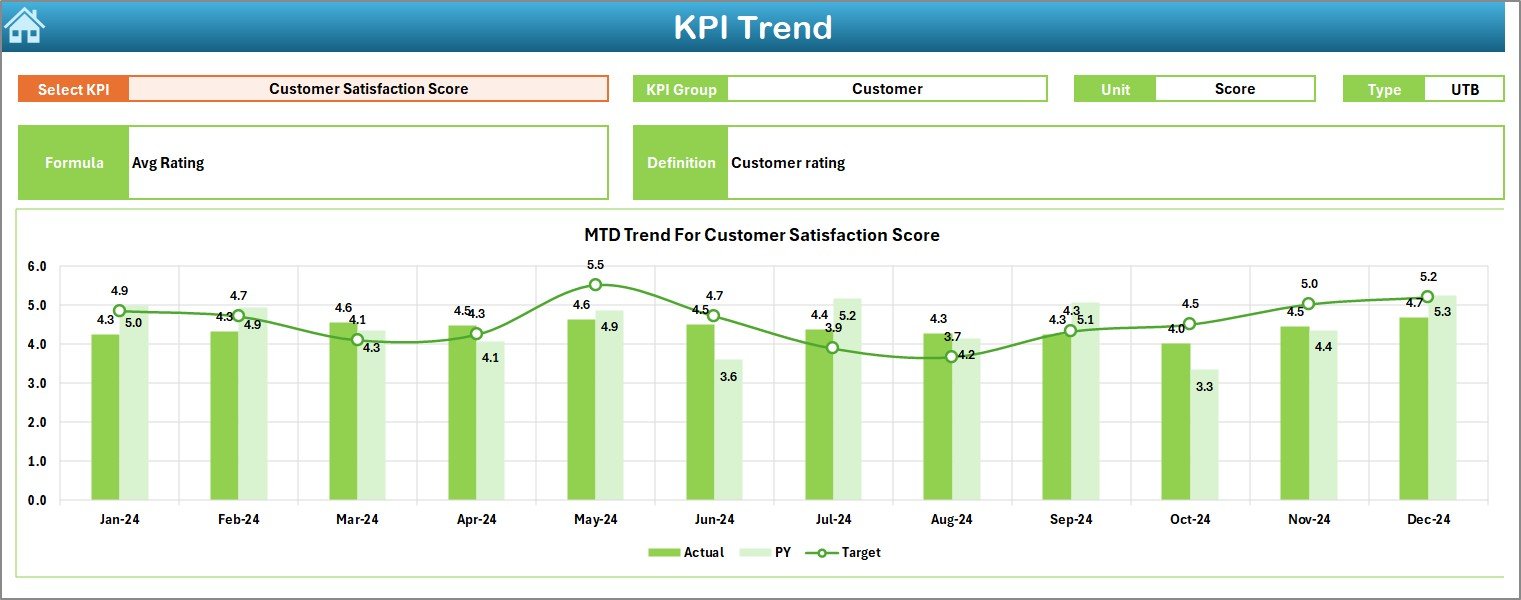
Trend Sheet – View the Performance Over Time
The Trend Sheet gives a deeper look at how each KPI performs across the year. You can pick the KPI from the drop-down in cell C3.
This sheet displays:
- KPI Group
- KPI Unit
- KPI Type (Upper the Better / Lower the Better)
- KPI Formula
- KPI Definition
Below this information, the sheet shows two trend charts:
MTD Trend Chart
Shows Actual, Target, and Previous Year values month-wise.
YTD Trend Chart
Shows how cumulative numbers change across the year.
This sheet helps you understand patterns, spot seasonal trends, check improvements, and identify performance gaps.
Click to buy Furniture Retail KPI Dashboard in Excel
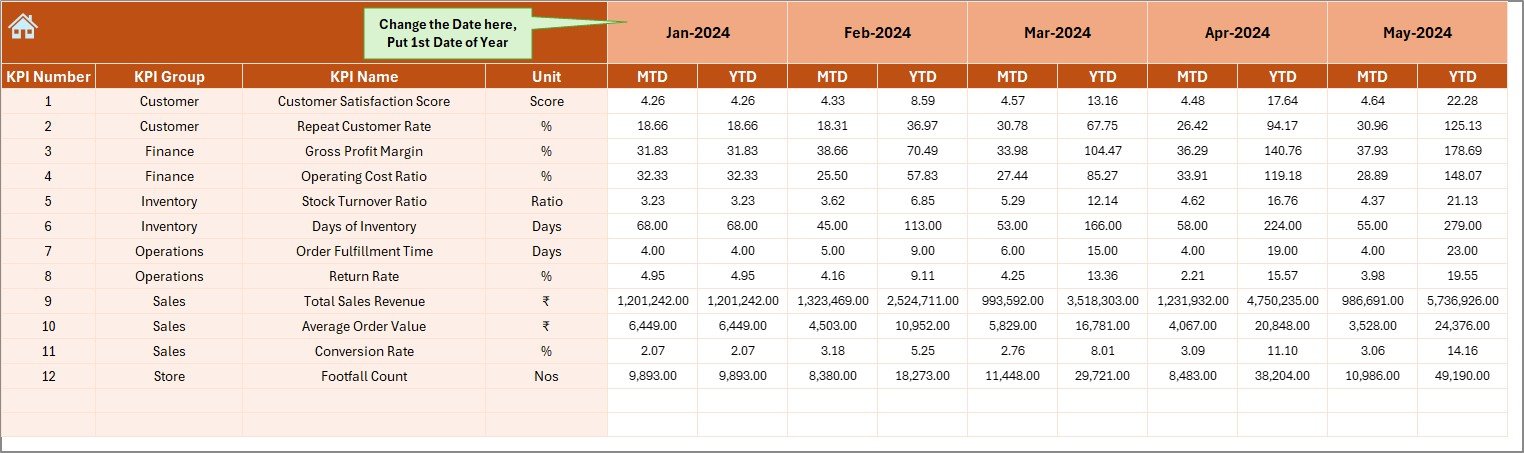
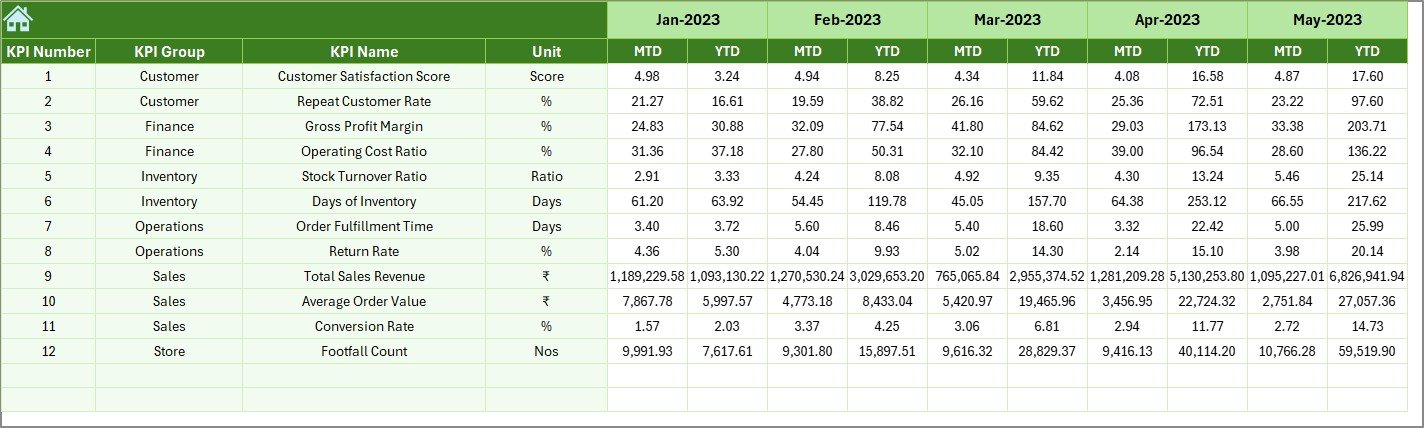
Actual Numbers Input Sheet – Add Your Actual Performance Data
This sheet is simple to use. You can enter your MTD and YTD actual numbers for each KPI. The month appears at the top in cell E1, where you can change the period by entering the first month of the year.
Because the sheet uses a consistent structure, you can add data fast without confusion or duplication.
Click to buy Furniture Retail KPI Dashboard in Excel
Target Sheet – Define Your Monthly Goals
Targets guide performance. In this sheet, you enter:
- MTD Target
- YTD Target
You can prepare realistic goals based on your store capacity, sales history, and seasonal expectations.
When you enter the targets here, the dashboard compares them automatically with actual performance.
Click to buy Furniture Retail KPI Dashboard in Excel
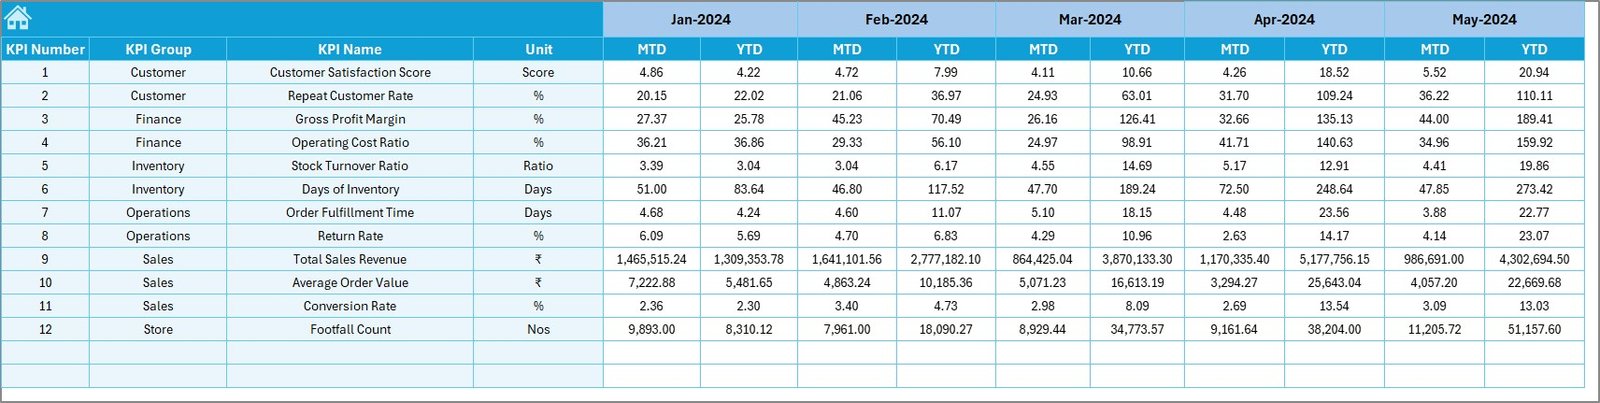
Previous Year Numbers Sheet – Enter Last Year’s Data
You need previous year numbers for comparison. This sheet works just like the Actual Input sheet. You enter the MTD and YTD numbers for the previous year, and the dashboard updates the comparison visuals instantly.
This helps you understand:
- Growth percentage
- Seasonal patterns
- Year-on-year improvement
- Risks or drops
Click to buy Furniture Retail KPI Dashboard in Excel
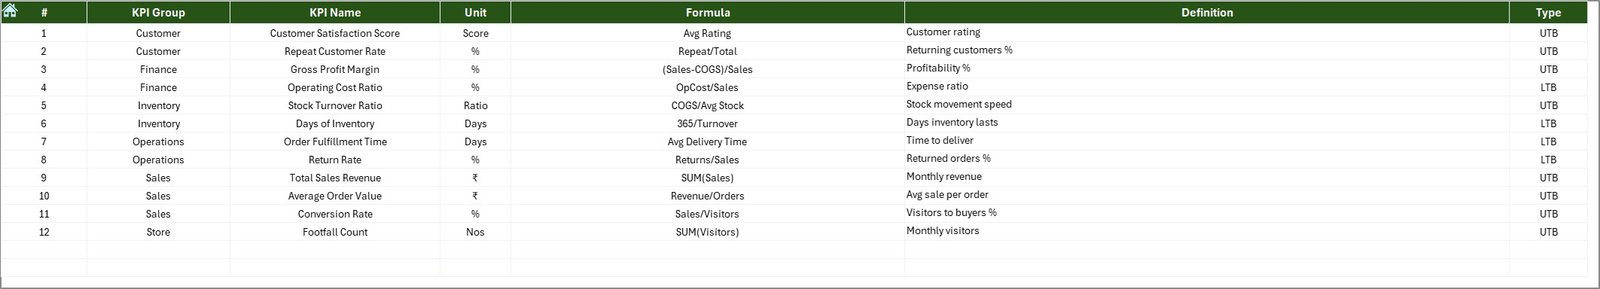
KPI Definition Sheet – Define Your Metrics Correctly
This sheet lists all the KPIs with:
- KPI Name
- KPI Group
- Unit
- Formula
- Definition
This ensures your team understands each KPI clearly. It also helps new users learn the dashboard structure fast.
Click to buy Furniture Retail KPI Dashboard in Excel
What KPIs Should Furniture Retail Stores Track?
Here are the most common KPIs included in this dashboard:
Sales KPIs
- Total Sales
- Sales per Category
- Sales per Store
- Average Order Value
- Conversion Rate
Inventory KPIs
- Inventory Turnover
- Stockout Rate
- Overstock Percentage
- Aging Stock
Customer KPIs
- Customer Footfall
- Customer Satisfaction Score
- Repeat Customer Percentage
- Delivery Rating
Operational KPIs
- On-Time Delivery Rate
- Return Rate
- Damage Rate
Financial KPIs
- Gross Margin
- Net Profit
- Cost per Order
These KPIs help you measure performance across all departments.
Advantages of Using a Furniture Retail KPI Dashboard in Excel
Using this dashboard gives strong benefits. Here are some key advantages:
- You Make Faster Decisions
The dashboard shows trends, gaps, and progress instantly. So, you respond quickly when something drops or improves.
- You Improve Sales Performance
When you track daily, weekly, and monthly sales, you spot opportunities. You also understand which categories perform well.
- You Reduce Inventory Loss
Because the dashboard shows stock performance clearly, you avoid overstock and stockout issues.
- You Improve Customer Experience
You track delivery performance, complaints, return rate, and service quality. So, you improve customer loyalty.
- You Save Time
Excel dashboards are easy to use. You enter numbers, and everything updates instantly.
- You Understand the Business Better
The dashboard gives clarity. Your decisions are based on data, not assumptions.
How to Use the Furniture Retail KPI Dashboard Effectively?
Follow these steps:
- Enter your actual numbers every month.
- Update your target sheet before the new month starts.
- Add previous year numbers for better comparison.
- Review the dashboard daily or weekly.
- Check the trend sheet to understand long-term changes.
- Update KPI definitions when you add new KPIs.
- Share the dashboard with your team.
Best Practices for the Furniture Retail KPI Dashboard
These tips help you get the most out of the dashboard:
Keep Your Data Clean
Use consistent units, formatting, and naming.
Update Data Frequently
Daily, weekly, or monthly updates help you track real performance.
Set Realistic Targets
Use past data and market knowledge to define targets.
Review Trend Charts Weekly
Trends reveal future problems early. This helps you act quickly.
Involve Your Team
Share KPI definitions so everyone works on the same objectives.
Compare with Previous Year Regularly
This helps you understand growth or decline.
Use Conditional Formatting Wisely
Arrows and color coding help you see issues instantly.
Conclusion
The Furniture Retail KPI Dashboard in Excel helps you track, analyze, and improve your store performance. Because it is simple, clear, and powerful, you can use it without learning any new software. The dashboard connects actual numbers, targets, and historical data to give real insights. When you use it consistently, you increase sales, reduce waste, improve customer experience, and run your furniture store in a smarter way.
It is the perfect tool for store owners, managers, sales teams, and operational leaders who want a clear picture of business performance.
Frequently Asked Questions (FAQs)
- What is a Furniture Retail KPI Dashboard?
It is an Excel-based tool that shows all important KPIs for a furniture store in one place. You can track sales, inventory, customer metrics, and operations.
- Can beginners use this dashboard?
Yes. The dashboard uses simple buttons, drop-downs, and input sheets. Anyone can use it without technical knowledge.
- What data do I need to update regularly?
You must update actual numbers, targets, and previous year numbers.
- Does this dashboard work for multiple stores?
Yes. You can add store filters or categories to track performance by location.
- Can I add more KPIs?
Yes, you can add them in the KPI Definition sheet and update the input sheets.
- Why is trend analysis important?
Trend charts show long-term patterns. So, you make better decisions and plan future actions.
- What happens if I don’t track KPIs?
You may lose control over sales, inventory, and customer satisfaction. A dashboard keeps everything organized.
- Can I use this dashboard every day?
Yes. Daily or weekly review helps you respond faster to issues.
Visit our YouTube channel to learn step-by-step video tutorials
Click to buy Furniture Retail KPI Dashboard in Excel
Watch the step-by-step video tutorial: