Graphic design teams handle many activities at the same time. They work on branding, advertising, social media, UI/UX assets, packaging, and many other design tasks. Because the workload increases every month, tracking performance becomes a challenge. Designers want to focus on creativity, but managers need to check timelines, project quality, workload distribution, cost efficiency, and overall output.
Therefore, a Graphic Design KPI Dashboard in Power BI brings clarity, speed, and transparency to the entire design workflow. It organizes design performance data, highlights trends, and shows real-time results. As a result, creative teams make better decisions and deliver projects without delays.
In this detailed guide, you will learn everything about this dashboard, including how it works, its features, advantages, and best practices.
Click to buy Graphic Design KPI Dashboard in Power BI
What Is a Graphic Design KPI Dashboard in Power BI?
A Graphic Design KPI Dashboard in Power BI is an interactive performance-monitoring system that visualizes all important KPIs related to design operations. Power BI converts raw design data into clean visuals, charts, slicers, and meaningful insights. You can view:
- Monthly design performance
- Status of KPIs
- Trends across different KPI Groups
- MTD (Month-to-Date) progress
- YTD (Year-to-Date) achievements
- Comparison with previous year
- Target vs actual numbers
Since the dashboard works along with an Excel data source, updating the numbers becomes simple. You only fill actual and target values in the Excel sheets, and Power BI refreshes everything instantly.
As a result, managers do not waste time preparing reports manually, and designers understand their performance clearly.
Why Do Graphic Design Teams Need a KPI Dashboard?
Graphic design teams face unique challenges. Their work demands speed, creativity, and accuracy at the same time. Many projects run together, and each project has different timelines, complexity levels, and requirements.
A KPI dashboard helps because:
- It removes confusion
- It improves communication
- It highlights delays early
- It shows which KPIs need attention
- It builds transparency in the entire creative process
When teams track the same KPIs, they work with more discipline. And because the dashboard updates automatically, leadership always sees the latest numbers.
Key Features of the Graphic Design KPI Dashboard in Power BI
This dashboard includes three powerful pages, and each page gives a complete view of design performance. Let’s explore them in detail.
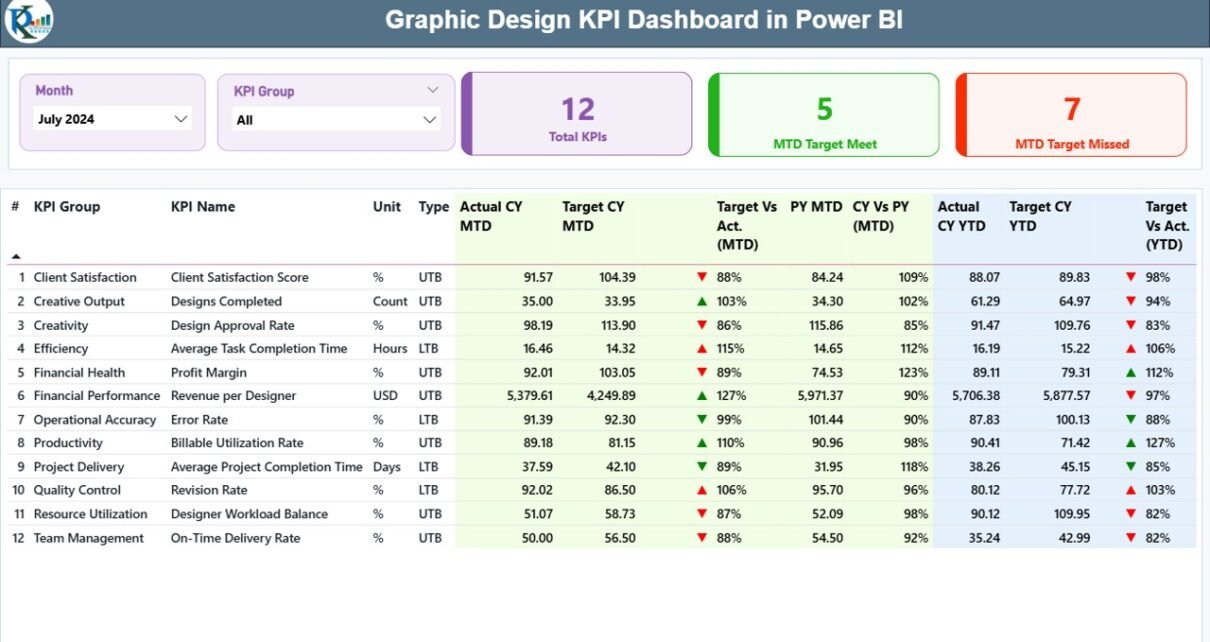
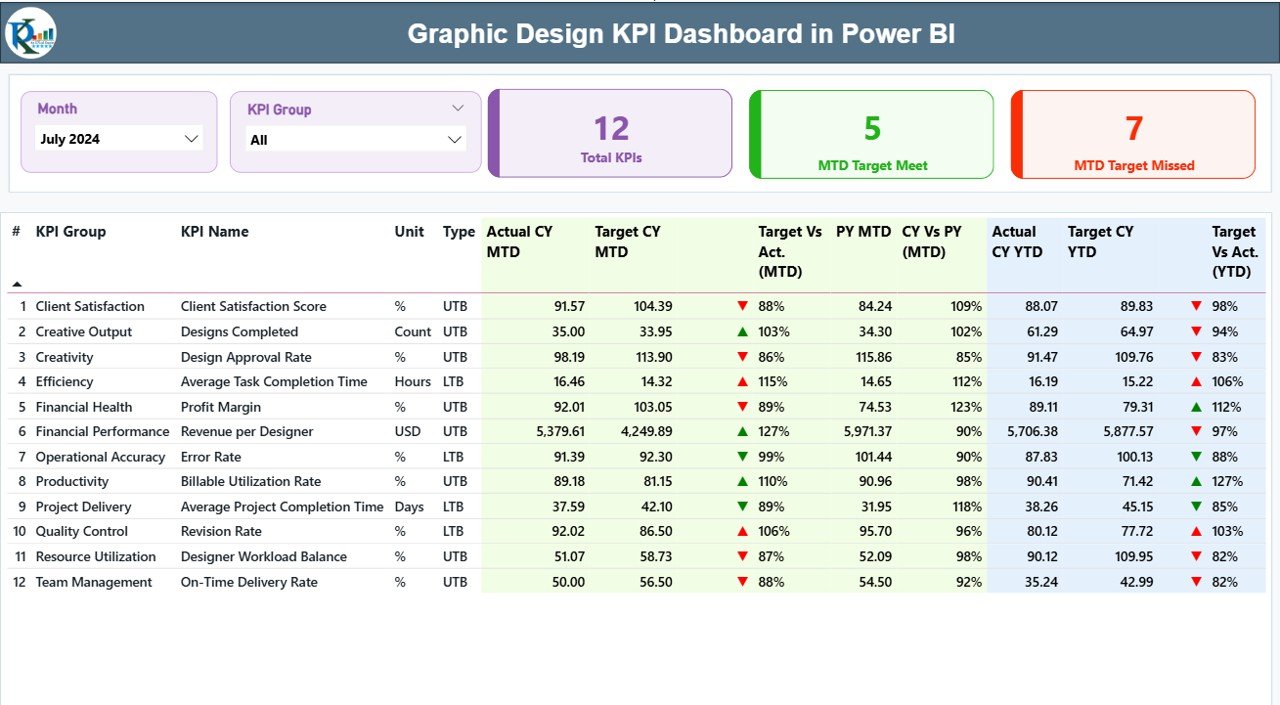
Summary Page: The Main Performance View
The Summary Page is the core of the dashboard. It brings all major KPIs to a single view. It helps design managers understand what is happening right now.
Key Elements of the Summary Page
Month Slicer
You can choose any month, and the dashboard updates all KPIs instantly.
KPI Group Slicer
You can filter KPIs by category such as:
- Productivity KPIs
- Quality KPIs
- Delivery KPIs
- Financial KPIs
- Client Satisfaction KPIs
- Team Performance KPIs
This gives a clear and focused view.
KPI Cards
The top section shows three important KPI cards:
- Total KPIs Count
- MTD Target Met Count
- MTD Target Missed Count
These cards help you understand overall performance within seconds.
Detailed MTD and YTD Table
Below the cards, the dashboard shows a detailed table with KPIs and comparison values.
This table includes:
- KPI Number
A serial number for easy tracking.
- KPI Group
Category of the KPI.
- KPI Name
Name of the performance indicator.
- Unit
Measurement unit (Hour, %, Count, Rating, etc.)
- Type
- UTB: Upper the Better
- LTB: Lower the Better
- Actual CY MTD
- Current year’s MTD actual value.
- Target CY MTD
Monthly target value.
- MTD Icon
- ▲ (Green): KPI met
- ▼ (Red): KPI not met
- Target vs Actual (MTD)
Percentage of achievement (Actual ÷ Target).
- Previous Year MTD (PY MTD)
Last year’s MTD value for comparison.
- CY vs PY (MTD)
Shows improvement or drop compared to last year.
- Actual CY YTD
Total performance from January to selected month.
- Target CY YTD
YTD target values.
- YTD Icon
Same as MTD — Green for success, Red for failure.
Target vs Actual (YTD)
Percentage of YTD performance.
Previous Year YTD
Last year’s YTD number.
CY vs PY (YTD)
Comparison with last year’s cumulative performance.
This detailed structure helps design teams track every KPI with clarity. You understand both monthly and yearly progress without checking multiple sheets or reports.
Click to buy Graphic Design KPI Dashboard in Power BI
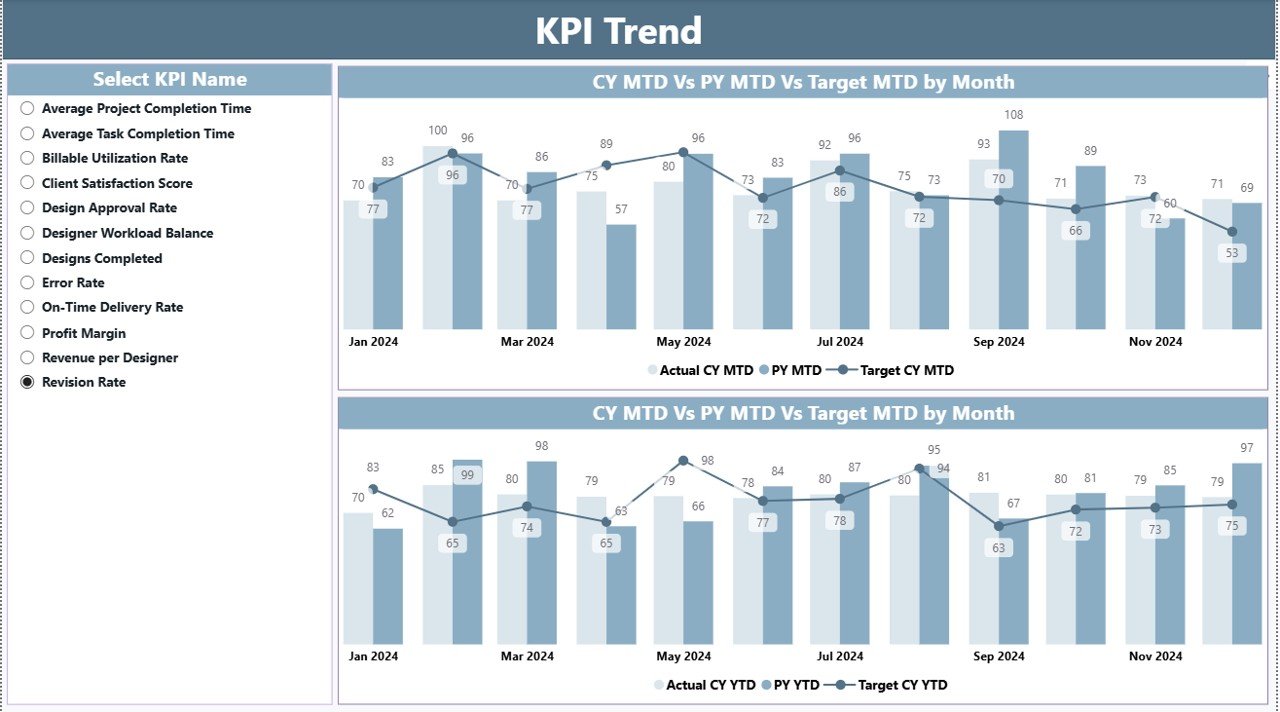
KPI Trend Page: Analyze MTD & YTD Movement
The KPI Trend Page visualizes performance trends for both MTD and YTD. This helps managers study patterns and understand whether the team is improving or declining.
What This Page Includes
KPI Name Slicer
Choose any KPI and see its trend clearly.
Combo Chart for MTD
It shows:
- Current Year Actual
- Target
- Previous Year Actual
Combo Chart for YTD
Same structure as MTD, but cumulative.
This page is extremely useful for design studios that want to track long-term improvements, seasonal behavior, workload variations, or team productivity.
Click to buy Graphic Design KPI Dashboard in Power BI
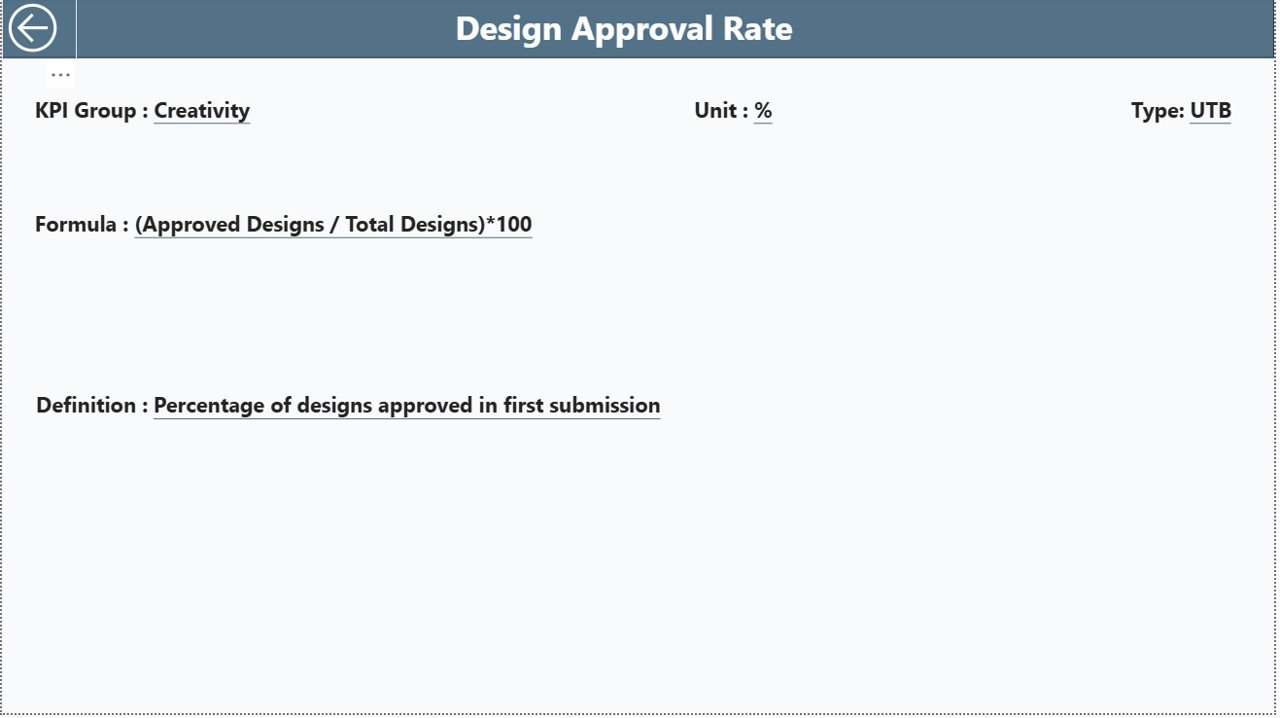
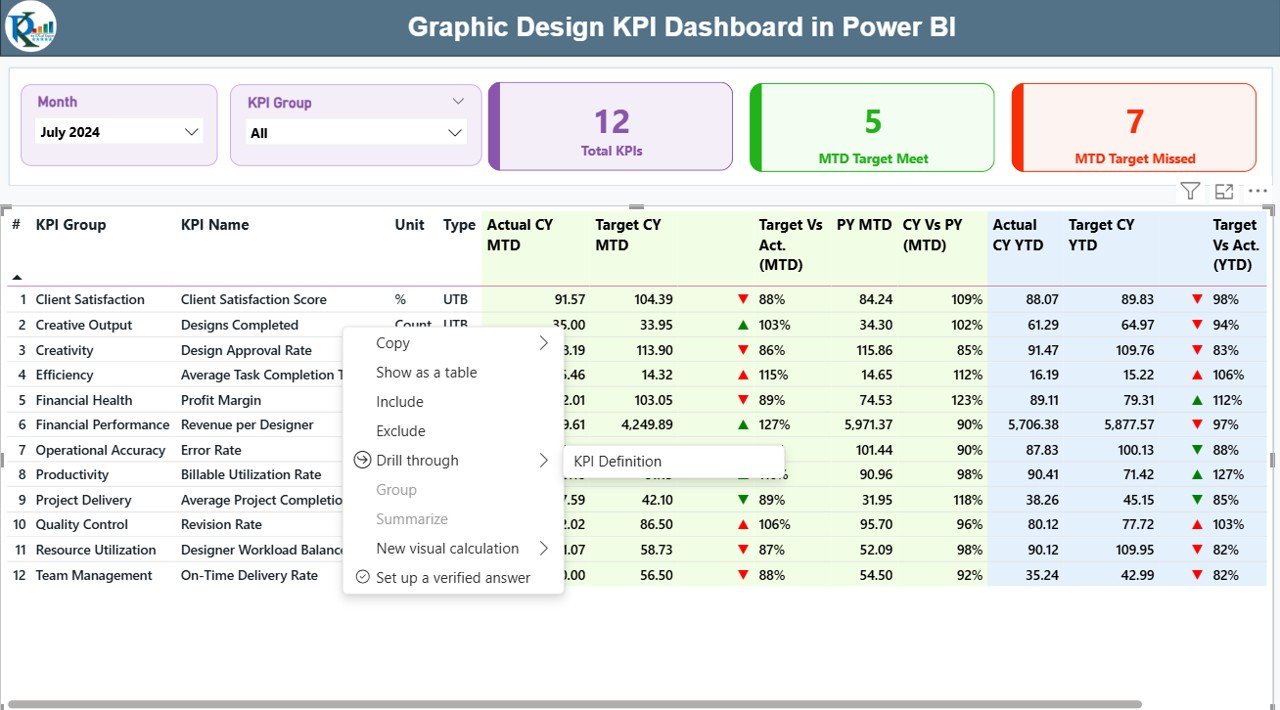
KPI Definition Page (Drill-Through View)
This page is built for clarity and documentation. It is hidden by default, but you can open it by drill-through.
This page shows:
- KPI Number
- KPI Group
- KPI Name
- Unit
- Formula
- Definition
- KPI Type (UTB or LTB)
It ensures everyone understands how KPIs are calculated. Misunderstandings disappear, and the team remains aligned.
To go back to the main page, you only click the back icon.
Click to buy Graphic Design KPI Dashboard in Power BI
How the Excel Data Source Works
The dashboard uses an Excel file with three worksheets. These sheets act as the backend of the dashboard. Every month, you only update these sheets.
Input_Actual Sheet
You fill:
- KPI Name
- Month (First date of the month)
- MTD Actual
- YTD Actual
Input_Target Sheet
You fill:
- KPI Name
- Month
- MTD Target
- YTD Target
KPI Definition Sheet
You maintain:
- KPI Number
- KPI Group
- KPI Name
- Unit
- Formula
- Definition
- KPI Type
Because the Excel file is simple and structured, even beginners update the dashboard easily.
Click to buy Graphic Design KPI Dashboard in Power BI
Important KPIs for Graphic Design Teams
Different design teams use different KPIs. However, the most common KPIs include:
Productivity KPIs
- Designs Completed
- Average Task Completion Time
- Number of Revisions per Project
- Designs Completed per Designer
Quality KPIs
- Client Revision Rate
- Design Accuracy Percentage
- Brand Guideline Compliance
Delivery KPIs
- On-Time Delivery Rate
- Project Delay Count
- Average Turnaround Time
Financial KPIs
- Cost per Design
- Design Budget Utilization
- Profitability per Project
Client KPIs
- Client Satisfaction Score
- Designer Rating
- Net Promoter Score (NPS)
Team KPIs
- Workload Distribution
- Designer Capacity Utilization
- Skill Development Hours
These KPIs give a strong balance between performance, quality, delivery, and customer experience.
Advantages of the Graphic Design KPI Dashboard in Power BI
- Clear and Real-Time Insights
You view all metrics in a single dashboard. This reduces confusion and increases clarity.
- Faster Decision-Making
Managers take faster decisions because the dashboard updates instantly when new data arrives.
- No Manual Reporting
Since Power BI automates visuals, teams save time every month.
- Improved Communication
Designers and managers always work with the same numbers.
- Better Time Management
You track delays early and fix workflow issues quickly.
- Focus on Creative Work
Designers focus more on creativity and less on administration.
- Transparent KPI Tracking
Everyone understands KPI definitions and formulas.
- Easy Data Entry
The Excel source file keeps things simple.
- Accurate Monthly and Yearly Comparison
You see both MTD and YTD numbers with previous year comparisons.
- Better Team Performance Monitoring
You understand who needs training, support, or workload balancing.
Best Practices for Using the Graphic Design KPI Dashboard in Power BI
- Set Clear KPI Definitions
Always define KPIs properly. Use clear units, formulas, and thresholds.
- Update the Excel File Monthly
Refresh actual and target values after completing each month.
- Use Consistent KPI Groups
Group similar KPIs together for easy analysis.
- Review Trends Regularly
Use the KPI Trend page to monitor improvement or decline.
- Focus on Both MTD and YTD
MTD shows short-term results, while YTD reveals long-term performance.
- Track Target Misses Early
If a KPI shows red indicators, fix it quickly.
- Maintain Clean Data
Check for duplicate entries, missing values, or wrong dates.
- Train the Team
Explain how to read the dashboard so the entire team benefits.
- Take Action Based on Insights
Do not just observe data — use it to improve workflow.
- Review KPI List Every 6 Months
Add new KPIs and remove outdated ones based on team growth.
Conclusion
A Graphic Design KPI Dashboard in Power BI transforms how creative teams work. It gives structure to the design process, shows performance clearly, and helps teams stay aligned with targets. Because the dashboard connects directly with Excel, updating data becomes effortless.
The Summary Page gives instant clarity. The KPI Trend Page shows long-term patterns. The KPI Definition Page keeps the entire team aligned. As a result, design managers understand workload, performance, financials, and delivery accuracy without checking different reports.
When design teams use the dashboard regularly, they deliver projects faster, reduce revision cycles, and improve client satisfaction. Therefore, every creative agency, in-house design department, or freelance design team can benefit from this tool.
Frequently Asked Questions (FAQ)
- What is a Graphic Design KPI Dashboard in Power BI?
It is a visual dashboard that tracks design performance, quality, delivery, financials, and client satisfaction using interactive charts and KPIs.
- Do I need Power BI skills to use this dashboard?
No. You only fill the Excel sheets, and Power BI updates automatically.
- What KPIs should design teams track?
You can track on-time delivery, client revision rate, designer productivity, workload, satisfaction score, and cost efficiency.
- Can I add new KPIs to the dashboard?
Yes. You can add more KPIs in the Excel definition sheet.
- How often should I update the data?
Update the actual and target values monthly to keep the dashboard accurate.
- Can this dashboard help freelancers?
Yes. Freelancers can track performance, delivery time, and client satisfaction.
- Can I compare performance with the previous year?
Yes. The dashboard includes PY MTD and PY YTD comparison.
- Does the dashboard include trends?
- Yes. The KPI Trend page shows MTD and YTD movement.
- What is the biggest advantage of this dashboard?
- It brings clarity, removes manual work, and helps design teams make better decisions.
- Is the dashboard customizable?
Yes. You can add new visuals, KPIs, themes, and categories based on your needs.
Visit our YouTube channel to learn step-by-step video tutorials
Watch the step-by-step video tutorial:
Click to buy Graphic Design KPI Dashboard in Power BI