Healthcare procurement involves complex processes, strict compliance requirements, and high-value spending decisions. Hospitals and healthcare organizations manage thousands of purchase orders for medicines, equipment, consumables, and services. Because budgets remain tight and demand continues to rise, procurement teams must track costs, delivery timelines, vendor performance, and order completion accurately.
However, when procurement data stays scattered across multiple spreadsheets or manual reports, visibility drops. As a result, delayed orders increase, cost savings decline, and decision-making becomes reactive. That is exactly why a Health Procurement Dashboard in Excel becomes a powerful and practical solution.
This ready-to-use dashboard converts raw procurement data into clear, visual, and actionable insights. It helps healthcare procurement teams control costs, improve vendor performance, track delivery delays, and ensure timely order completion—all from a single Excel file.
In this article, we will explain the Health Procurement Dashboard in Excel, its structure, key metrics, analytical views, advantages, improvement opportunities, best practices, and common questions.
What Is a Health Procurement Dashboard in Excel?
Click to Buy Health Procurement Dashboard in Excel
A Health Procurement Dashboard in Excel is a centralized reporting and analysis tool designed to monitor procurement performance in healthcare organizations. It tracks planned cost, actual cost, savings, order status, delivery delays, and vendor efficiency across departments and categories.
Because the dashboard is built in Microsoft Excel, it offers:
-
Familiar and user-friendly interface
-
Automated calculations
-
Interactive charts
-
Real-time performance tracking
-
Cost-effective implementation
As a result, procurement managers, finance teams, and hospital administrators gain complete visibility into procurement operations without investing in expensive BI tools.
Key Features of the Health Procurement Dashboard
This dashboard is a ready-to-use Excel template with structured data tables, dynamic charts, and intuitive visuals. It focuses on procurement performance, cost control, and delivery compliance.
The dashboard includes:
-
Overview performance cards
-
Order completion and delay tracking
-
Spend and savings analysis
-
Vendor performance monitoring
-
Category-level insights
-
Department-wise delivery compliance
Let’s explore each dashboard section in detail.
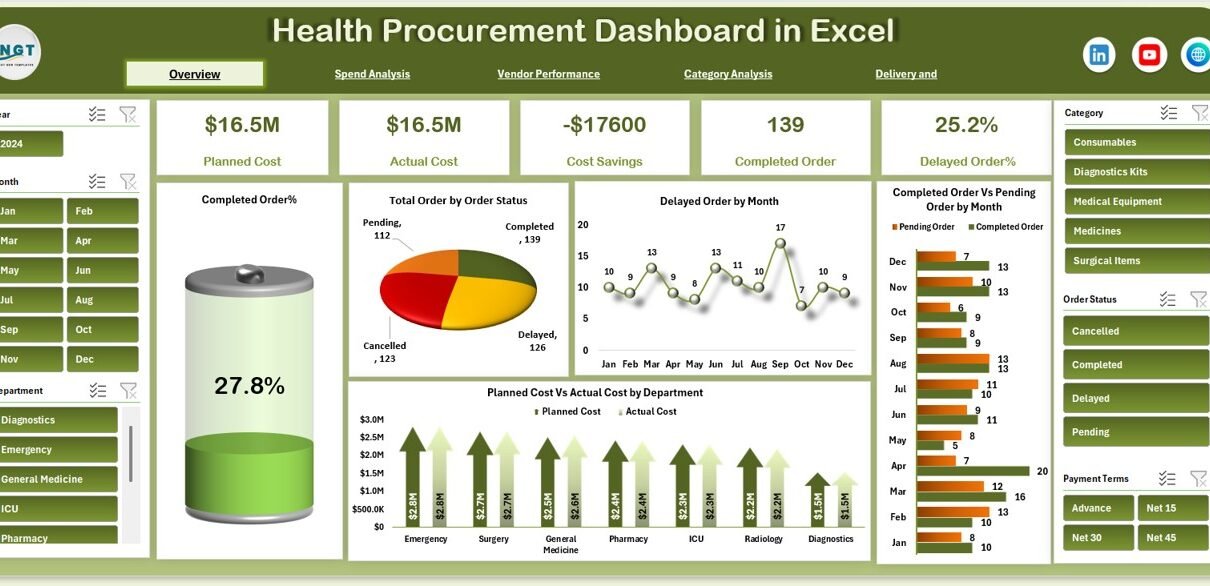
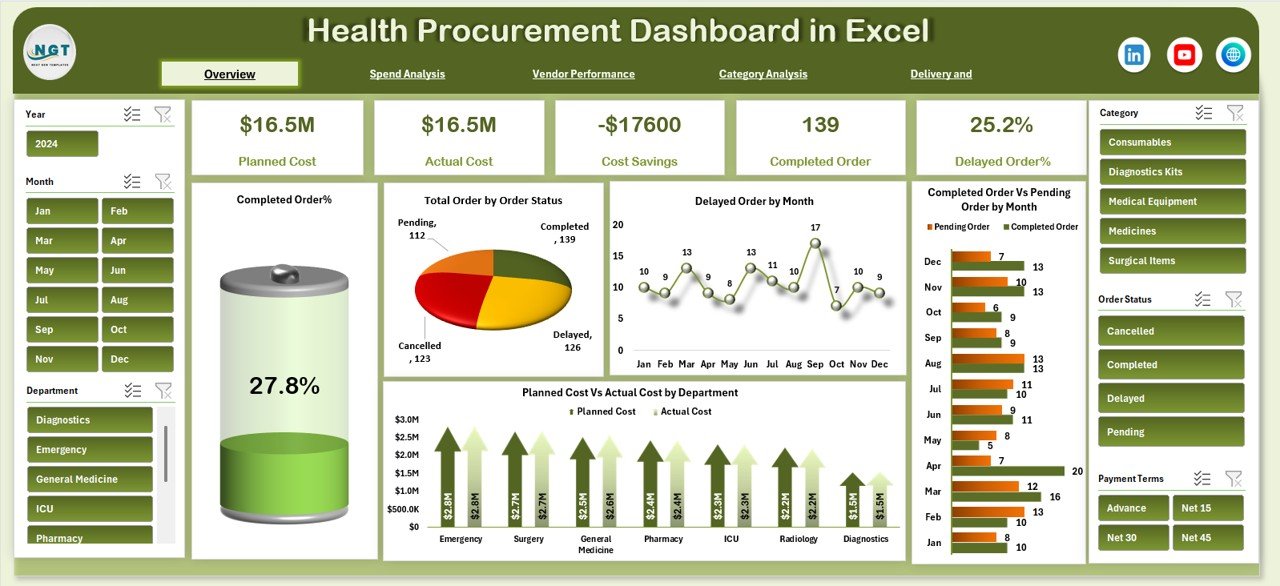
Overview Sheet Tab – Executive Summary
Click to Buy Health Procurement Dashboard in Excel
The Overview sheet acts as the main control panel. It provides a high-level summary of procurement performance for leadership and decision-makers.
Key KPI Cards in the Overview
-
Planned Cost – Total budgeted procurement cost
-
Actual Cost – Actual spending incurred
-
Cost Savings – Difference between planned and actual cost
-
Completed Order – Number of successfully completed orders
-
Delayed Order % – Percentage of orders delayed beyond timelines
These KPI cards give instant clarity on procurement health and financial efficiency.
Charts in the Overview Sheet
Completed Order %
Shows the overall order completion rate, helping teams measure procurement efficiency.
Total Order by Order Status
Displays orders by status such as Completed, Pending, and Cancelled, enabling quick backlog assessment.
Delayed Order by Month
Highlights monthly delay trends, helping teams identify recurring delivery issues.
Completed Order vs Pending Order by Month
Compares completed and pending orders over time to track improvement or deterioration.
Planned Cost vs Actual Cost by Department
Shows departmental spending efficiency and budget adherence.
Click to Buy Health Procurement Dashboard in Excel
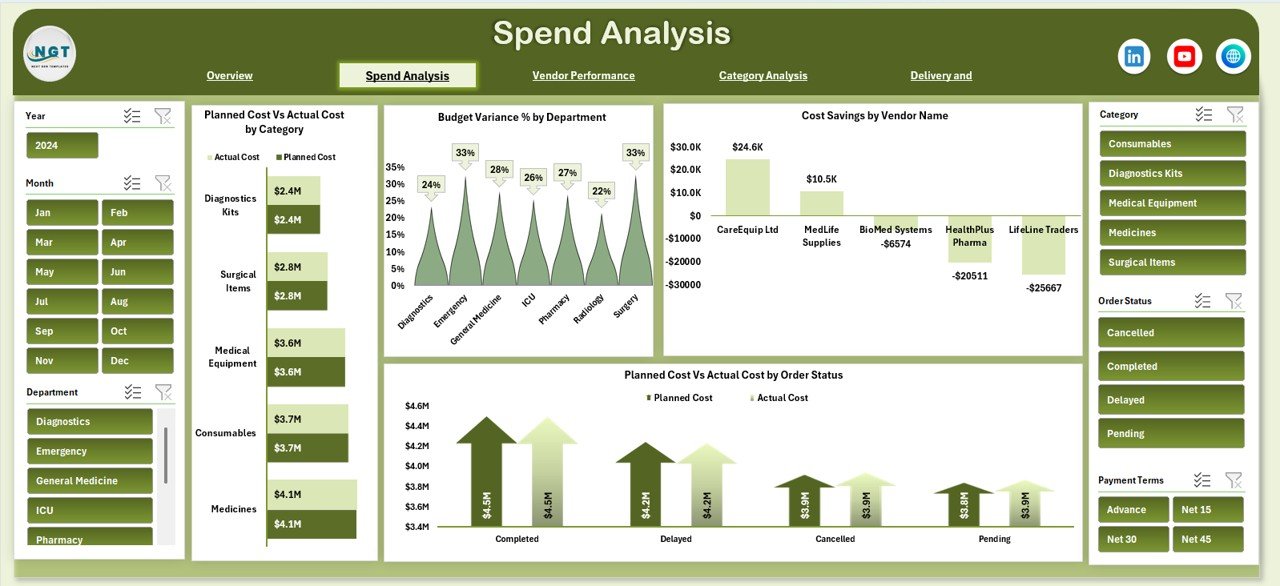
Spend Analysis – Cost Visibility and Budget Control
The Spend Analysis section focuses on financial performance and cost optimization.
Charts in Spend Analysis
Planned Cost vs Actual Cost by Category
Identifies categories where spending exceeds budget and where savings exist.
Budget Variance % by Department
Highlights departments with high variance between planned and actual spend.
Cost Savings by Vendor Name
Shows which vendors contribute the most to cost savings.
Planned Cost vs Actual Cost by Order Status
Reveals how pending or delayed orders impact procurement spending.
This analysis helps procurement leaders tighten cost controls and improve budgeting accuracy.
Click to Buy Health Procurement Dashboard in Excel
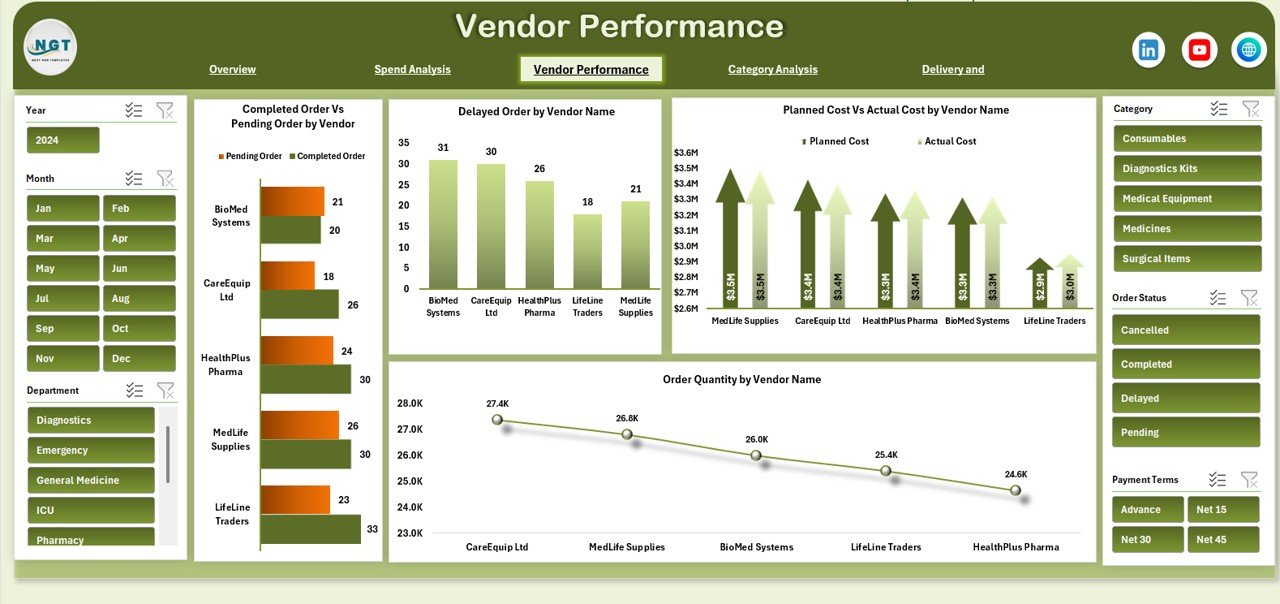
Vendor Performance – Supplier Accountability
Vendor performance directly impacts procurement success. This section helps evaluate supplier reliability and efficiency.
Charts in Vendor Performance
Completed Order vs Pending Order by Vendor
Identifies vendors with strong delivery performance versus those causing delays.
Delayed Order by Vendor Name
Highlights suppliers responsible for late deliveries.
Planned Cost vs Actual Cost by Vendor Name
Shows vendor-wise cost efficiency and negotiation effectiveness.
Order Quantity by Vendor Name
Tracks procurement volume by vendor, helping with vendor consolidation decisions.
This section enables data-driven vendor evaluation and contract optimization.
Click to Buy Health Procurement Dashboard in Excel
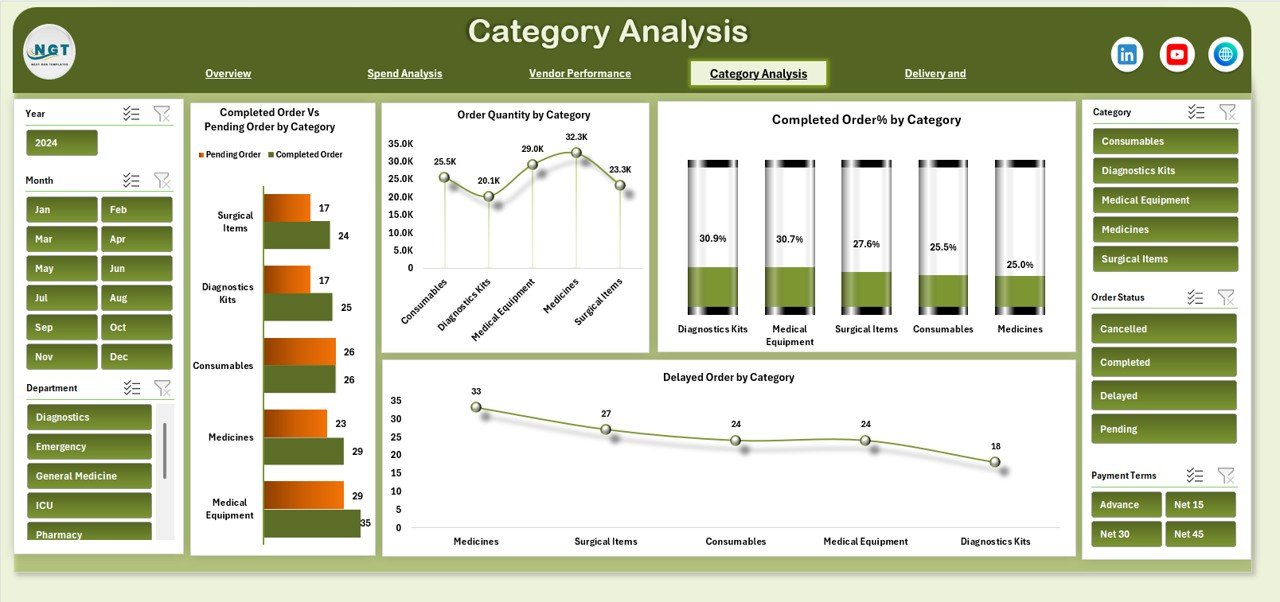
Category Analysis – Item-Level Insights
Healthcare procurement covers diverse categories such as medicines, surgical supplies, equipment, and services. Category-level insights are essential.
Charts in Category Analysis
Completed Order vs Pending Order by Category
Shows order fulfillment performance across procurement categories.
Order Quantity by Category
Identifies high-volume procurement categories.
Completed Order % by Category
Highlights categories with strong or weak completion rates.
Delayed Order by Category
Helps pinpoint categories facing frequent delivery issues.
These insights support better inventory planning and category management.
Click to Buy Health Procurement Dashboard in Excel
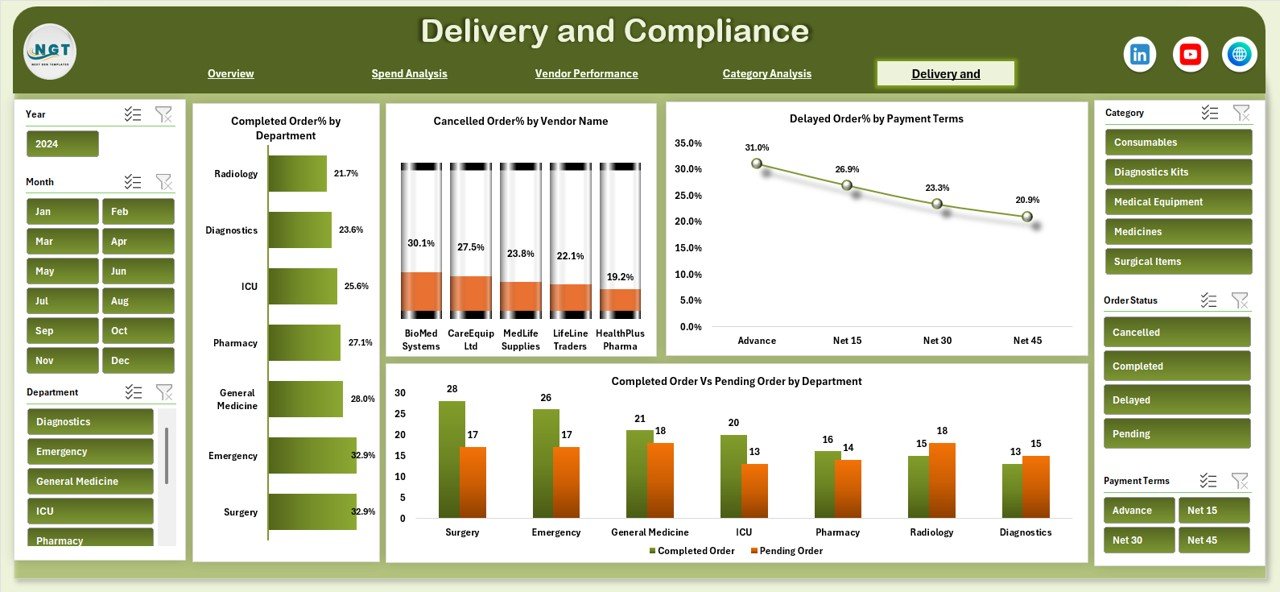
Delivery and Compliance – Operational Reliability
This section focuses on delivery performance and compliance across departments and vendors.
Charts in Delivery and Compliance
Completed Order % by Department
Measures how effectively each department completes procurement orders.
Cancelled Order % by Vendor Name
Highlights vendors with high cancellation rates.
Delayed Order % by Payment Terms
Shows how payment terms influence delivery delays.
Completed Order vs Pending Order by Department
Helps departments understand their procurement execution efficiency.
This view supports operational discipline and accountability.
Click to Buy Health Procurement Dashboard in Excel
Why Healthcare Organizations Need This Dashboard
Healthcare procurement teams face rising costs, regulatory pressure, and increasing demand. This dashboard helps organizations:
-
Improve cost transparency
-
Reduce procurement delays
-
Strengthen vendor accountability
-
Optimize departmental spending
-
Improve order fulfillment rates
-
Enhance compliance and reporting
As a result, procurement becomes proactive instead of reactive.
Advantages of the Health Procurement Dashboard in Excel
Click to Buy Health Procurement Dashboard in Excel
Centralized Procurement Visibility
Track all procurement KPIs in one place instead of managing multiple files.
Better Cost Control
Identify overspending, savings opportunities, and budget variance quickly.
Improved Vendor Management
Use data to negotiate better contracts and remove poor performers.
Faster Decision-Making
Visual dashboards replace long manual reports.
High Flexibility
Customize categories, vendors, and departments easily.
Low Implementation Cost
Use Excel without additional software investments.
Opportunities for Improvement in Health Procurement Tracking
Although the dashboard is powerful, organizations can enhance it further by:
-
Adding SLA compliance metrics
-
Integrating inventory stock levels
-
Tracking emergency procurement separately
-
Including contract expiry alerts
-
Automating data updates from ERP systems
These improvements strengthen long-term procurement governance.
Best Practices for Using the Health Procurement Dashboard
Click to Buy Health Procurement Dashboard in Excel
-
Update procurement data regularly
-
Standardize order status definitions
-
Review vendor performance monthly
-
Analyze delayed orders proactively
-
Use category insights for bulk negotiations
-
Share dashboard insights with finance teams
Consistent usage delivers the best results.
Conclusion
The Health Procurement Dashboard in Excel is a practical and powerful tool for healthcare organizations seeking better cost control, operational efficiency, and procurement transparency. It transforms complex procurement data into clear, actionable insights. Because it is easy to use, flexible, and cost-effective, it fits hospitals, clinics, and healthcare networks of all sizes.
By using this dashboard, procurement teams gain control, improve accountability, and support better patient care through efficient supply management.
Frequently Asked Questions (FAQs)
Click to Buy Health Procurement Dashboard in Excel
Who should use a Health Procurement Dashboard?
Procurement teams, finance departments, hospital administrators, and supply chain managers.
Can this dashboard track multiple hospitals?
Yes, you can add hospital-wise data easily.
Is this dashboard customizable?
Yes, you can modify categories, vendors, KPIs, and charts.
Does it support monthly and yearly analysis?
Yes, it supports both trend and cumulative analysis.
Do I need advanced Excel skills?
No, basic Excel knowledge is sufficient.
Visit our YouTube channel to learn step-by-step video tutorials
Watch the step-by-step video tutorial:
Click to Buy Health Procurement Dashboard in Excel