Healthcare organizations handle large volumes of purchases every month. These purchases include medical supplies, equipment, consumables, and services. Because spending directly impacts patient care and financial stability, healthcare leaders need complete visibility into purchasing performance. However, manual reports and scattered spreadsheets make tracking difficult and slow.
That is exactly why a Health Purchasing Dashboard in Power BI becomes an essential solution. This ready-to-use dashboard converts raw purchasing data into clear, interactive, and actionable insights. It helps healthcare organizations track costs, quantities, payment status, vendor performance, and purchasing efficiency from a single platform.
In this article, we will explain how the Health Purchasing Dashboard in Power BI works, its key features, charts, and how it supports smarter purchasing decisions.
What Is a Health Purchasing Dashboard in Power BI?
A Health Purchasing Dashboard in Power BI is an interactive analytics solution designed to monitor purchasing activities across hospitals and healthcare facilities. It provides real-time insights into planned costs, actual costs, quantities purchased, cost variance, payment status, and purchase completion rates.
Because the dashboard uses Power BI, users gain:
-
Interactive filtering and drill-downs
-
Real-time performance visibility
-
Clear visual comparisons
-
Secure and scalable reporting
-
Faster decision-making
This dashboard supports procurement teams, finance departments, hospital administrators, and senior management.
Key Features of the Health Purchasing Dashboard in Power BI
Click to Buy Health Purchasing Dashboard in Power BI
This is a ready-to-use dashboard that includes structured pages and interactive visuals. Each section focuses on a specific aspect of purchasing performance.
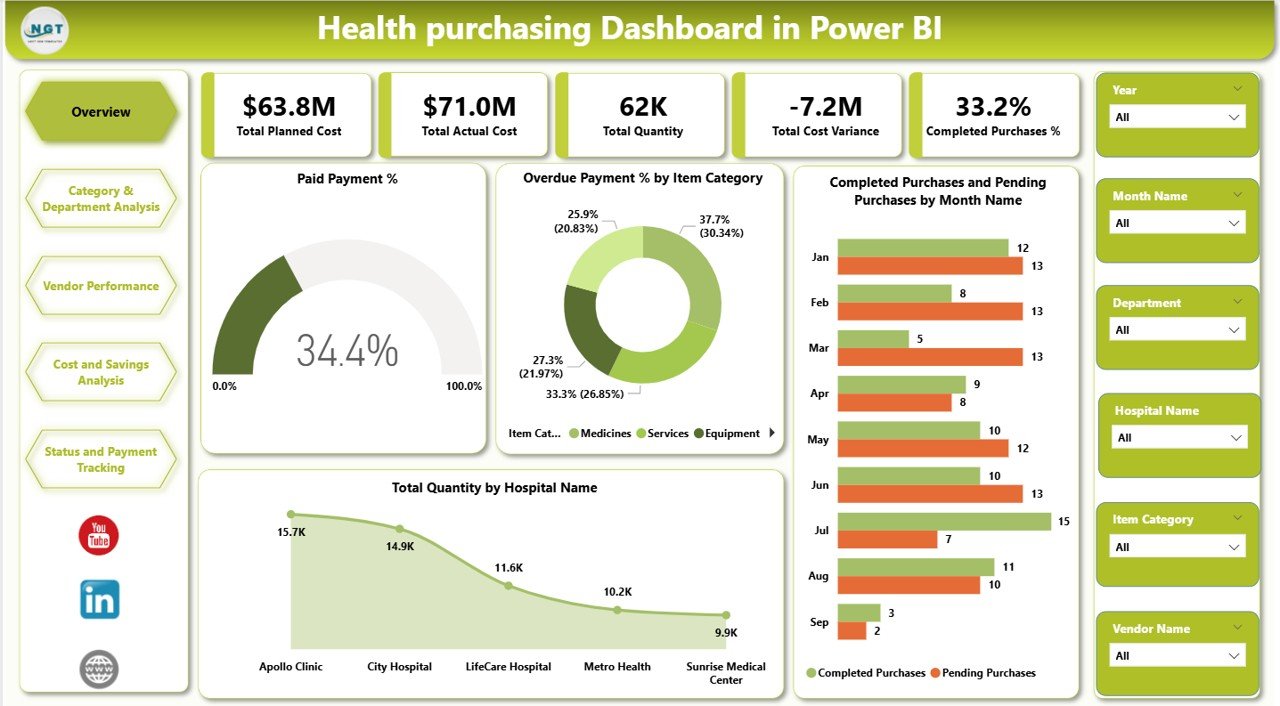
Overview Section
The Overview page provides a quick snapshot of overall purchasing health. It allows decision-makers to understand the situation at a glance before exploring deeper analysis.
KPI Cards in the Overview
The dashboard includes the following KPI cards:
-
Total Planned Cost – Displays the total expected purchasing cost
-
Total Actual Cost – Shows actual spending across all purchases
-
Total Quantity – Indicates total quantity purchased
-
Total Cost Variance – Highlights the difference between planned and actual cost
-
Completed Purchases % – Shows the percentage of completed purchases
These KPIs immediately highlight cost control, execution efficiency, and purchasing progress.
Overview Charts
The Overview section includes the following charts:
Paid Payment %
Shows the proportion of purchases that have been fully paid. This helps finance teams monitor payment compliance.
Overdue Payment % by Item Category
Highlights item categories with delayed payments, helping identify risk areas.
Completed Purchases and Pending Purchases by Month Name
Shows monthly purchasing completion trends, making it easier to spot delays or improvements.
Total Quantity by Hospital Name
Displays how purchase quantities distribute across hospitals, helping with demand analysis and inventory planning.
Click to Buy Health Purchasing Dashboard in Power BI
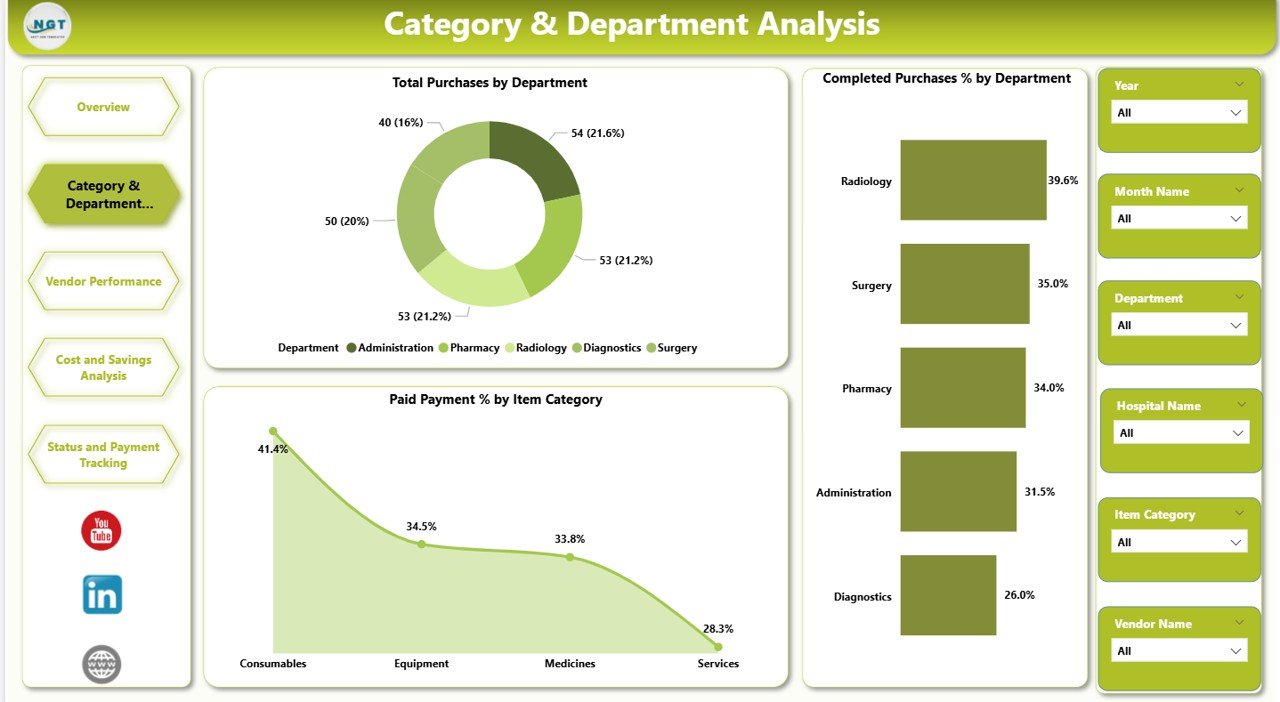
Category & Department Analysis
This section focuses on how purchasing performance varies by department and item category.
Key Charts
Total Purchases by Department
Shows which departments generate the highest purchase volume.
Completed Purchases % by Department
Helps evaluate which departments execute purchases efficiently.
Paid Payment % by Item Category
Identifies categories with strong or weak payment performance.
This analysis supports better budget planning and accountability at the department level.
Click to Buy Health Purchasing Dashboard in Power BI
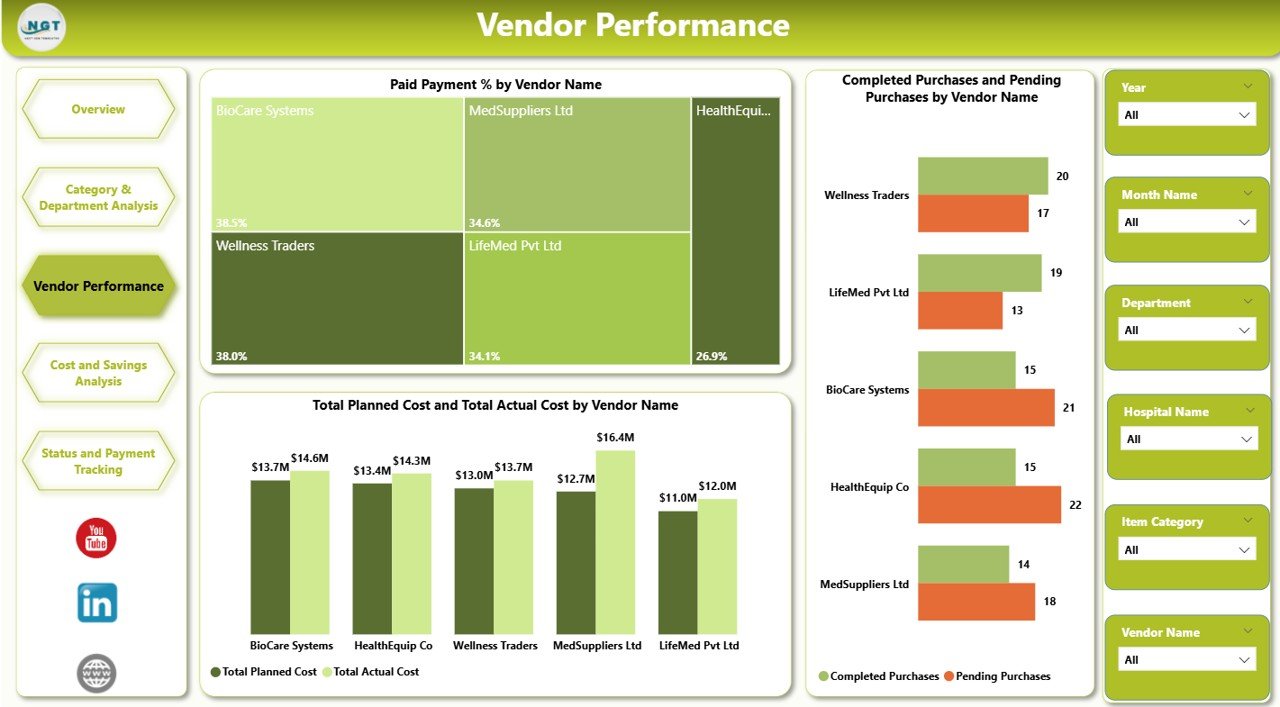
Vendor Performance Analysis
Vendor performance plays a critical role in healthcare purchasing. Delays, pricing issues, or payment problems can disrupt operations.
Vendor Performance Charts
Paid Payment % by Vendor Name
Shows how reliably vendors receive payments.
Completed Purchases and Pending Purchases by Vendor Name
Highlights vendors with execution delays.
Total Planned Cost and Total Actual Cost by Vendor Name
Helps evaluate cost efficiency and vendor pricing accuracy.
This section enables procurement teams to negotiate better contracts and strengthen vendor relationships.
Click to Buy Health Purchasing Dashboard in Power BI
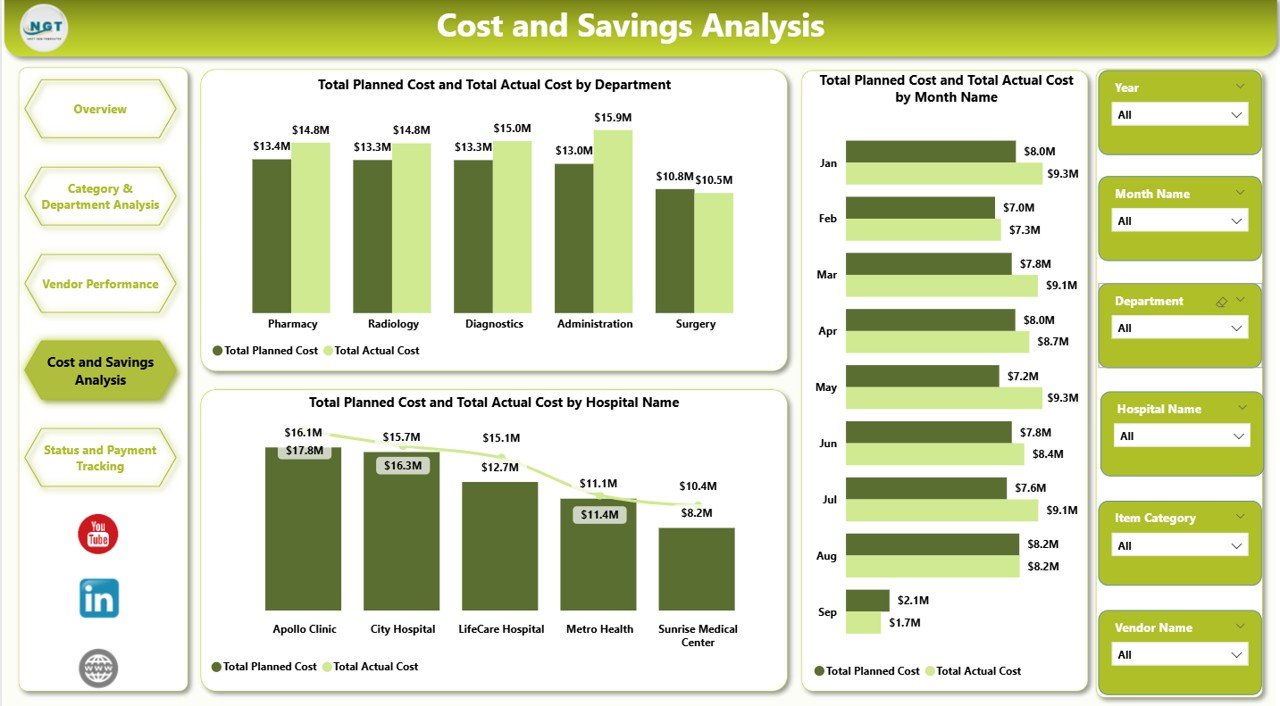
Cost and Savings Analysis
This section focuses on cost control and financial efficiency.
Key Charts
Total Planned Cost and Total Actual Cost by Department
Shows budget adherence by department.
Total Planned Cost and Total Actual Cost by Month Name
Tracks monthly spending trends.
Total Planned Cost and Total Actual Cost by Hospital Name
Helps compare purchasing efficiency across hospitals.
These insights help healthcare leaders control overspending and optimize budgets.
Click to Buy Health Purchasing Dashboard in Power BI
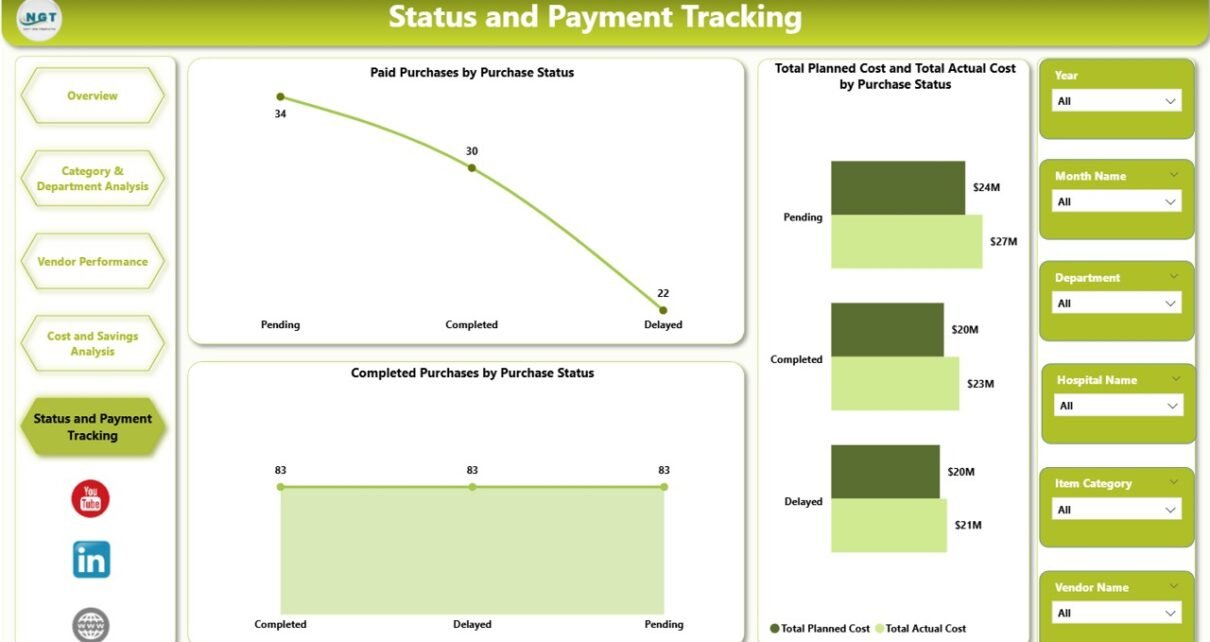
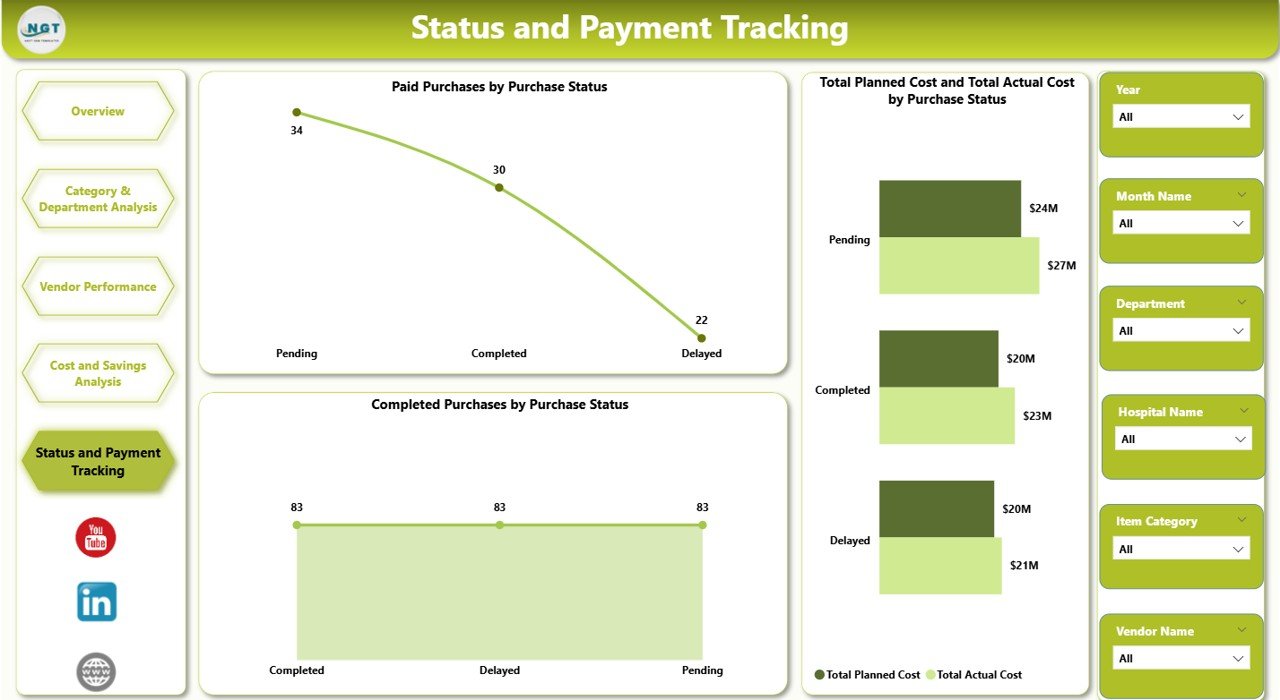
Status and Payment Tracking
Payment and status tracking ensures financial discipline and timely processing.
Key Charts
Paid Purchases by Purchase Status
Shows how payment completion aligns with purchase status.
Completed Purchases by Purchase Status
Helps identify bottlenecks in purchase processing.
This section improves transparency between procurement and finance teams.
Click to Buy Health Purchasing Dashboard in Power BI
Why Healthcare Organizations Need This Dashboard
Healthcare purchasing involves strict budgets, compliance requirements, and high operational risk. A Health Purchasing Dashboard in Power BI helps organizations:
-
Track spending accurately
-
Improve purchase completion rates
-
Reduce delayed payments
-
Strengthen vendor accountability
-
Improve budgeting and forecasting
-
Support data-driven decisions
By using a centralized dashboard, healthcare leaders gain control, clarity, and confidence.
Advantages of the Health Purchasing Dashboard in Power BI
Click to Buy Health Purchasing Dashboard in Power BI
-
Real-time insights into purchasing performance
-
Improved cost control through variance analysis
-
Better vendor management using performance metrics
-
Faster reporting without manual spreadsheets
-
Clear accountability across departments and hospitals
-
Scalable design for growing healthcare networks
Opportunities for Improvement
Although the dashboard is powerful, organizations can enhance it further by:
-
Adding SLA tracking for vendors
-
Including inventory integration
-
Tracking emergency purchases separately
-
Adding predictive cost forecasting
-
Integrating approval workflows
These enhancements can further strengthen purchasing governance.
Best Practices for Using the Dashboard
Click to Buy Health Purchasing Dashboard in Power BI
-
Update purchasing data regularly
-
Review cost variance weekly
-
Monitor overdue payments closely
-
Compare department performance monthly
-
Use vendor insights during negotiations
-
Share dashboard insights with finance and operations teams
Consistent usage ensures long-term value and better outcomes.
Conclusion
Click to Buy Health Purchasing Dashboard in Power BI
The Health Purchasing Dashboard in Power BI provides a clear, structured, and powerful way to monitor healthcare purchasing performance. It combines cost tracking, quantity analysis, vendor evaluation, and payment monitoring into a single interactive dashboard. Because it is ready to use and highly visual, it supports faster decisions and stronger financial control.
Visit our YouTube channel to learn step-by-step video tutorials
Watch the step-by-step video tutorial:
Click to Buy Health Purchasing Dashboard in Power BI