Managing healthcare tenders requires precision, transparency, and timely decision-making. Hospitals and healthcare organizations handle multiple tenders across departments, vendors, and time periods. Because of complex approval processes, large budgets, and strict compliance requirements, tracking tenders using manual reports or scattered spreadsheets often leads to delays, cost overruns, and missed savings opportunities.
That is exactly why a Health Tender Dashboard in Power BI becomes a powerful and essential solution. This ready-to-use Power BI dashboard converts raw tender data into clear, interactive, and actionable insights. It helps healthcare leaders monitor tender performance, control costs, track awarded tenders, and improve vendor and manager accountability.
In this article, we will explain how the Health Tender Dashboard in Power BI works, what insights each section provides, and how healthcare organizations can use it to improve tender governance and financial efficiency.
What Is a Health Tender Dashboard in Power BI?
A Health Tender Dashboard in Power BI is a centralized analytical solution designed to monitor and analyze healthcare tender activities. It tracks estimated values, awarded values, savings, open tenders, vendor performance, and managerial effectiveness—all in one interactive dashboard.
Because it is built in Power BI, the dashboard offers:
-
Real-time visual insights
-
Interactive filtering and drill-downs
-
Department-wise and vendor-wise analysis
-
Clear trend tracking across months
-
Faster and more confident decision-making
This dashboard is ideal for hospital procurement teams, finance departments, compliance officers, and senior management.
Key Benefits of Using a Health Tender Dashboard
Click to Buy Health Tender Dashboard in Power BI
Healthcare organizations use this dashboard because it helps them:
-
Monitor open and awarded tenders in real time
-
Track cost savings across departments and vendors
-
Improve tender transparency and governance
-
Identify high-performing vendors and managers
-
Reduce procurement risks and delays
-
Support data-driven tender decisions
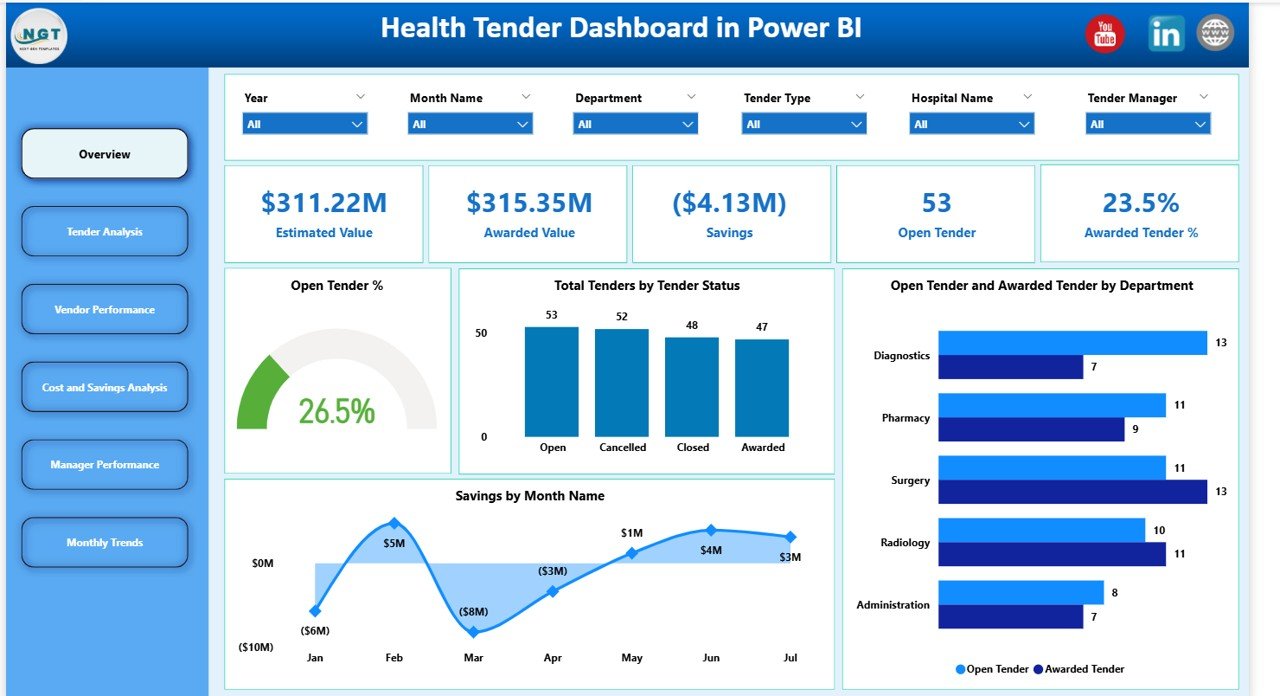
Overview Section – High-Level Tender Snapshot
The Overview section gives decision-makers an instant understanding of tender performance using KPI cards and summary charts.
Overview Cards (KPIs)
Estimated Value
Shows the total expected value of all tenders.
This helps organizations understand overall procurement exposure.
Awarded Value
Displays the total value of tenders that have been successfully awarded.
It reflects actual committed spending.
Savings
Calculates the difference between estimated and awarded values.
This KPI highlights cost efficiency and negotiation success.
Open Tender
Shows the number of tenders still open or under evaluation.
It helps track workload and pending decisions.
Awarded Tender %
Represents the percentage of tenders awarded out of total tenders.
A higher percentage indicates efficient tender processing.
Overview Charts
Open Tender %
Visualizes the proportion of tenders that remain open.
It helps management focus on bottlenecks and pending approvals.
Total Tenders by Tender Status
Breaks down tenders by status such as Open, Awarded, or Cancelled.
This chart improves operational visibility.
Open Tender and Awarded Tender by Department
Compares open and awarded tenders across hospital departments.
It highlights departments with delays or strong performance.
Savings by Month Name
Tracks monthly savings trends.
This chart helps assess procurement improvement over time.
Click to Buy Health Tender Dashboard in Power BI
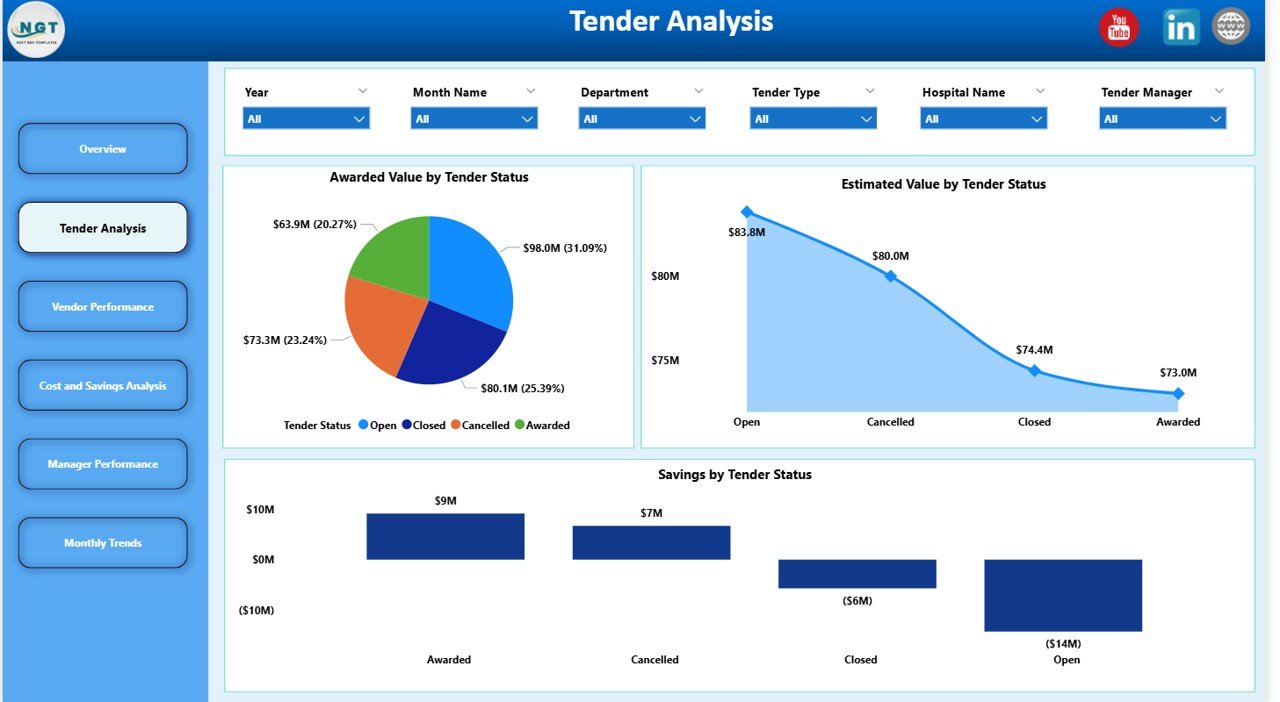
Tender Analysis – Understanding Tender Outcomes
The Tender Analysis section focuses on tender performance by status and value.
Tender Analysis Charts
Awarded Value by Tender Status
Shows how awarded values differ across tender statuses.
It helps identify where most financial commitments occur.
Estimated Value by Tender Status
Displays planned tender values across statuses.
It supports risk and pipeline assessment.
Savings by Tender Status
Highlights savings achieved at different tender stages.
This helps refine tender strategies.
Click to Buy Health Tender Dashboard in Power BI
Vendor Performance – Measuring Supplier Effectiveness
Vendor performance plays a critical role in healthcare procurement success. This section evaluates suppliers based on value, savings, and award rates.
Vendor Performance Charts
Awarded Value by Vendor Name
Shows total awarded contract value per vendor.
It identifies top suppliers by financial impact.
Awarded Tender % by Vendor Name
Measures how often vendors win tenders.
It reflects vendor competitiveness and reliability.
Savings by Vendor Name
Tracks savings generated by each vendor.
This insight supports vendor negotiations and future sourcing decisions.

Click to Buy Health Tender Dashboard in Power BI
Cost and Savings Analysis – Financial Control
This section focuses on how costs and savings distribute across departments and tender types.
Cost and Savings Charts
Estimated Value by Department
Displays planned tender values by department.
It helps in budget planning and control.
Awarded Value by Tender Type
Shows spending patterns across different tender categories.
It supports strategic sourcing decisions.
Awarded Tender % by Tender Type
Measures success rates across tender types.
It highlights which tender formats perform best.

Click to Buy Health Tender Dashboard in Power BI
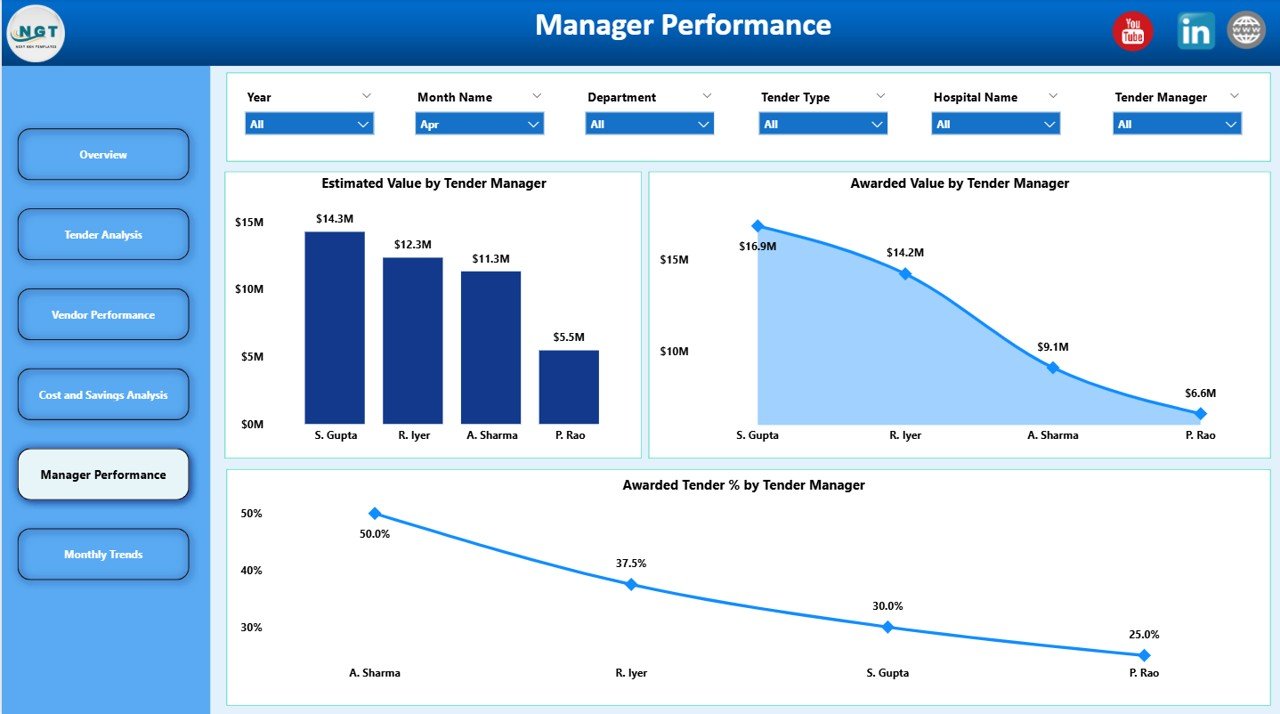
Manager Performance – Accountability and Governance
Tender managers play a crucial role in driving procurement outcomes. This section tracks managerial effectiveness.
Manager Performance Charts
Estimated Value by Tender Manager
Shows total tender value handled by each manager.
It reflects responsibility and workload distribution.
Awarded Value by Tender Manager
Tracks successfully awarded values by manager.
It highlights execution effectiveness.
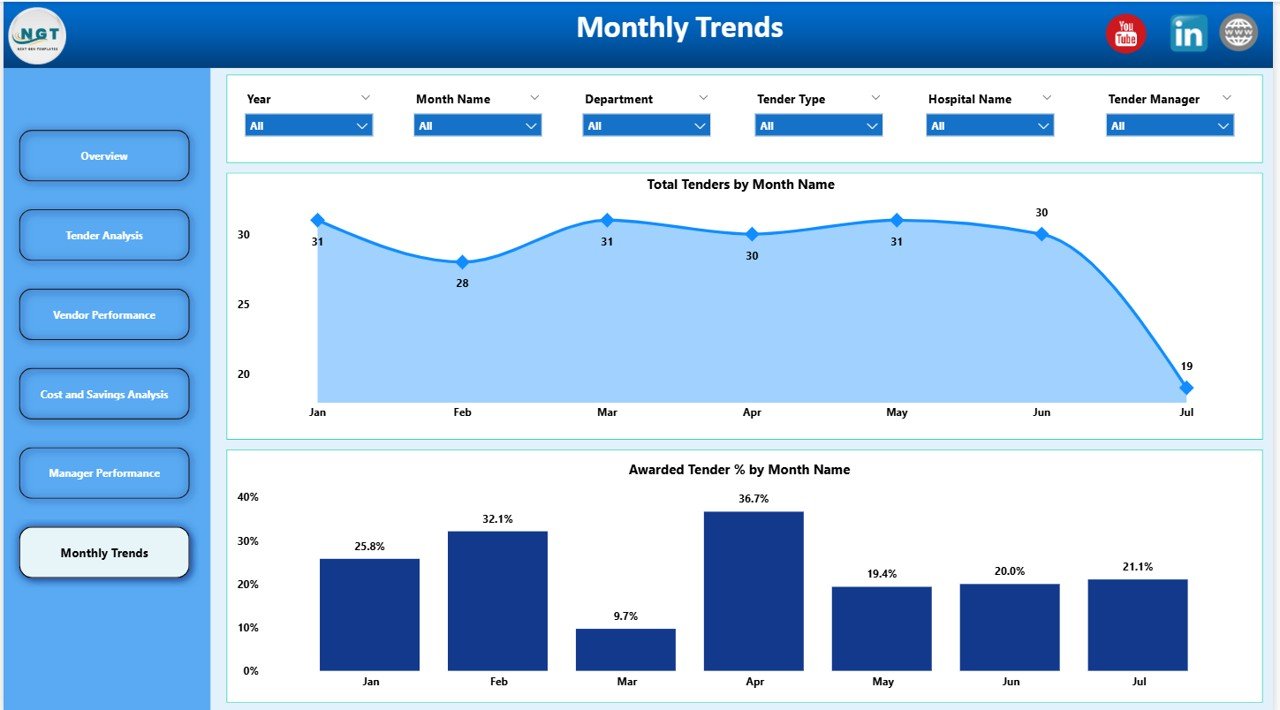
Monthly Trends – Time-Based Performance Tracking
This section helps organizations understand how tender activity evolves over time.
Monthly Trend Charts
Total Tenders by Month Name
Tracks tender volume each month.
It helps identify seasonal procurement patterns.
Awarded Tender % by Month Name
Shows monthly award efficiency.
It highlights process improvements or delays over time.
Click to Buy Health Tender Dashboard in Power BI
Why Healthcare Organizations Need This Dashboard
Healthcare procurement teams face constant pressure to reduce costs while maintaining compliance and service quality. This dashboard helps by:
-
Centralizing all tender data
-
Improving transparency and audit readiness
-
Supporting faster and better decisions
-
Highlighting savings opportunities
-
Enhancing vendor and manager accountability
Advantages of the Health Tender Dashboard in Power BI
Click to Buy Health Tender Dashboard in Power BI
-
Real-time tender visibility
-
Interactive and drill-down analysis
-
Strong cost and savings control
-
Improved procurement governance
-
Easy department, vendor, and manager comparison
-
Professional reporting for leadership reviews
Opportunities for Improvement
Organizations can further enhance this dashboard by:
-
Adding SLA tracking for tender timelines
-
Including compliance and risk scores
-
Integrating contract lifecycle data
-
Automating data refresh from ERP systems
-
Adding forecasted savings metrics
Best Practices for Using the Health Tender Dashboard
Click to Buy Health Tender Dashboard in Power BI
-
Update tender data regularly
-
Review open tenders weekly
-
Monitor savings trends monthly
-
Use vendor insights during negotiations
-
Align manager performance with KPIs
-
Share dashboard insights with leadership
Conclusion
The Health Tender Dashboard in Power BI empowers healthcare organizations to manage tenders with clarity, control, and confidence. By combining financial metrics, vendor analysis, and performance tracking in one interactive dashboard, it transforms tender management into a strategic advantage.
Visit our YouTube channel to learn step-by-step video tutorials
Watch the step-by-step video tutorial:
Click to Buy Health Tender Dashboard in Power BI