Managing housing and urban development activities takes continuous tracking, smart decision-making, and timely actions. You handle several KPIs such as project completion rates, budget utilization, resident satisfaction, occupancy performance, and monthly development progress. Because this information spreads across multiple files, it becomes hard to gain a quick and clear picture.
However, a Housing & Urban Development KPI Dashboard in Excel solves this problem. It brings all crucial KPIs into a single, simple, and interactive dashboard. As a result, you make faster decisions, improve planning, and monitor development trends in real time.
In this detailed guide, you will explore what this dashboard is, how it works, its benefits, key features, best practices, and common questions.
Click to buy Housing & Urban Development KPI Dashboard in Excel
What Is a Housing & Urban Development KPI Dashboard in Excel?
A Housing & Urban Development KPI Dashboard in Excel is a ready-to-use performance management tool that tracks all important KPIs for housing authorities, real estate teams, development boards, municipal corporations, construction departments, and community development teams.
It shows monthly and yearly KPI progress in one view so that leaders understand what works well and what needs improvement. Most importantly, Excel makes the dashboard flexible, affordable, and easy to customize.
This dashboard supports tasks such as:
- Monitoring project timelines
- Tracking occupancy results
- Measuring customer satisfaction
- Analyzing budget vs actual
- Reviewing development progress
- Comparing monthly and yearly performance
- Tracking compliance and operational KPIs
Because everything stays organized in one place, teams do not waste time searching for scattered files or reports.
Why Do You Need a Housing & Urban Development KPI Dashboard in Excel?
Housing and urban development teams manage long-term projects, multiple units, different stakeholders, service requests, compliance requirements, and financial planning. Without a structured dashboard, it becomes difficult to stay updated.
Therefore, this dashboard helps you:
- Track monthly performance
- Identify project delays early
- Compare actual numbers with targets
- Observe year-to-year progress
- Improve planning accuracy
- Reduce manual reporting
- Make confident decisions
- Maintain transparency
Since the dashboard uses Excel formulas, drop-downs, and conditional formatting, you get visual and dynamic insights in seconds.
Key Features of the Housing & Urban Development KPI Dashboard in Excel
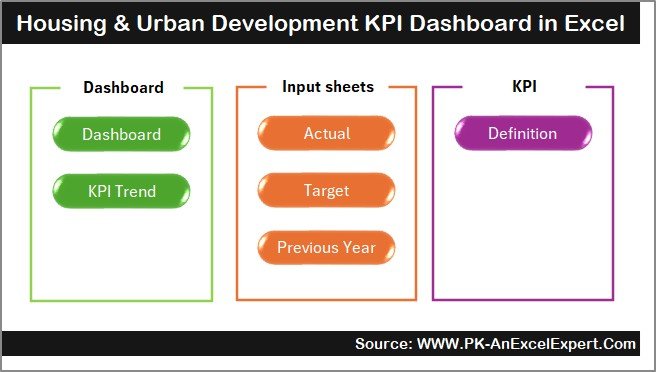
We designed this dashboard with 7 fully functional worksheets, each serving a unique purpose. Together, they create a complete KPI tracking system. Let’s explore each sheet in detail.
Summary Page – Your Main Navigation Hub
The Summary Page acts as the index of the dashboard.
Instead of searching for sheet names, you use six navigation buttons to jump directly to the required worksheet.
This page improves:
- Ease of use
- Dashboard navigation
- User experience
- Presentation quality
Because everything stays accessible from one page, you save time and move through the dashboard smoothly.
Click to buy Housing & Urban Development KPI Dashboard in Excel
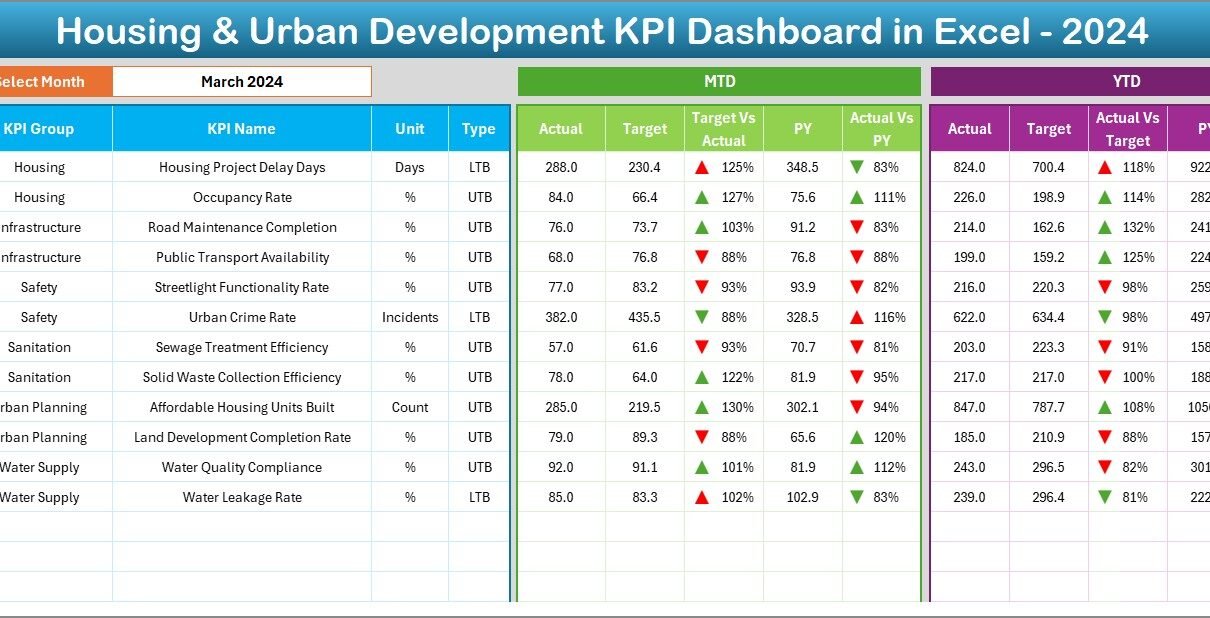
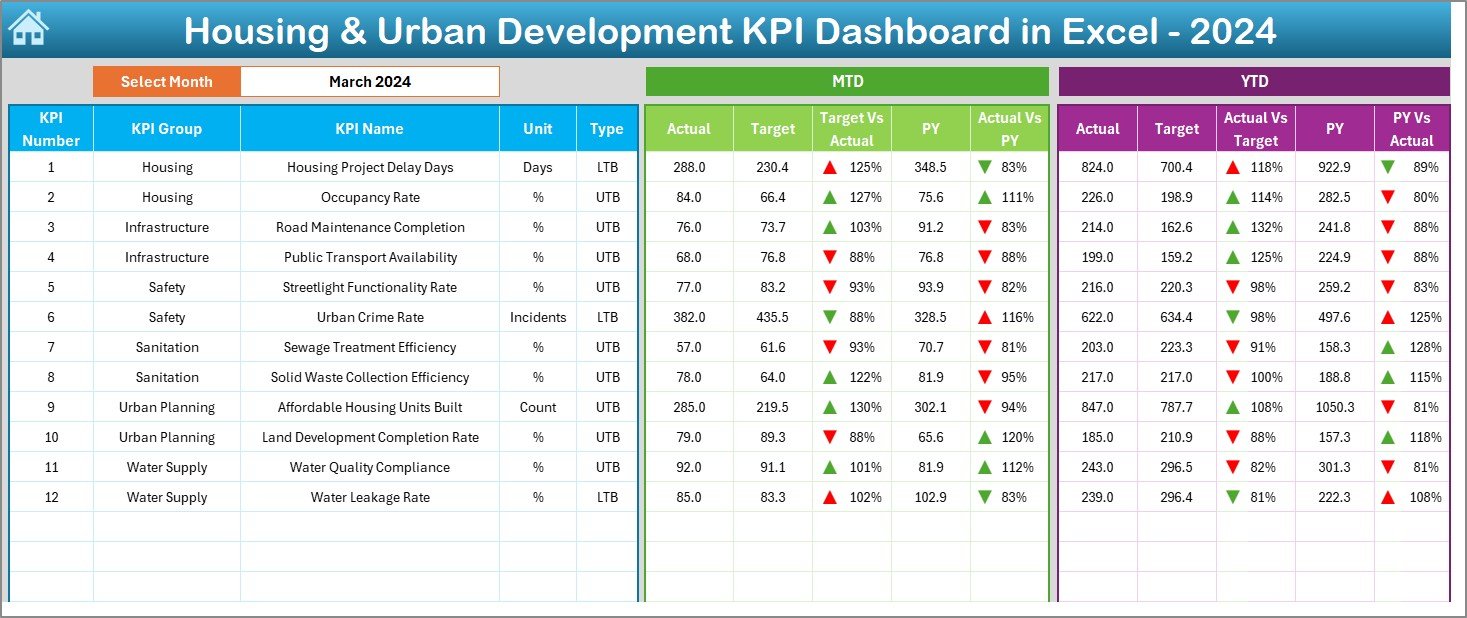
Dashboard Sheet – Complete KPI Overview
The Dashboard sheet is the heart of the entire file. You get every KPI in one visual layout.
Key Highlights
- Choose the Month from a drop-down in cell D3
- Dashboard numbers change automatically
- View MTD Actual, Target, and Previous Year (PY) data
- Compare Target vs Actual with up/down arrows
- Compare Actual vs PY with conditional formatting arrows
- Track YTD Actual, YTD Target, and YTD PY side-by-side
Because the sheet shows everything in one place, you understand performance instantly.
Click to buy Housing & Urban Development KPI Dashboard in Excel
Insights you can track include:
- Occupancy rates
- Project completion percentages
- Budget utilization
- Resident satisfaction
- Compliance performance
- Housing quality indicators
- Maintenance turnaround time
- Revenue and cost KPIs
This sheet supports real-time decision-making and helps leaders act before problems grow.
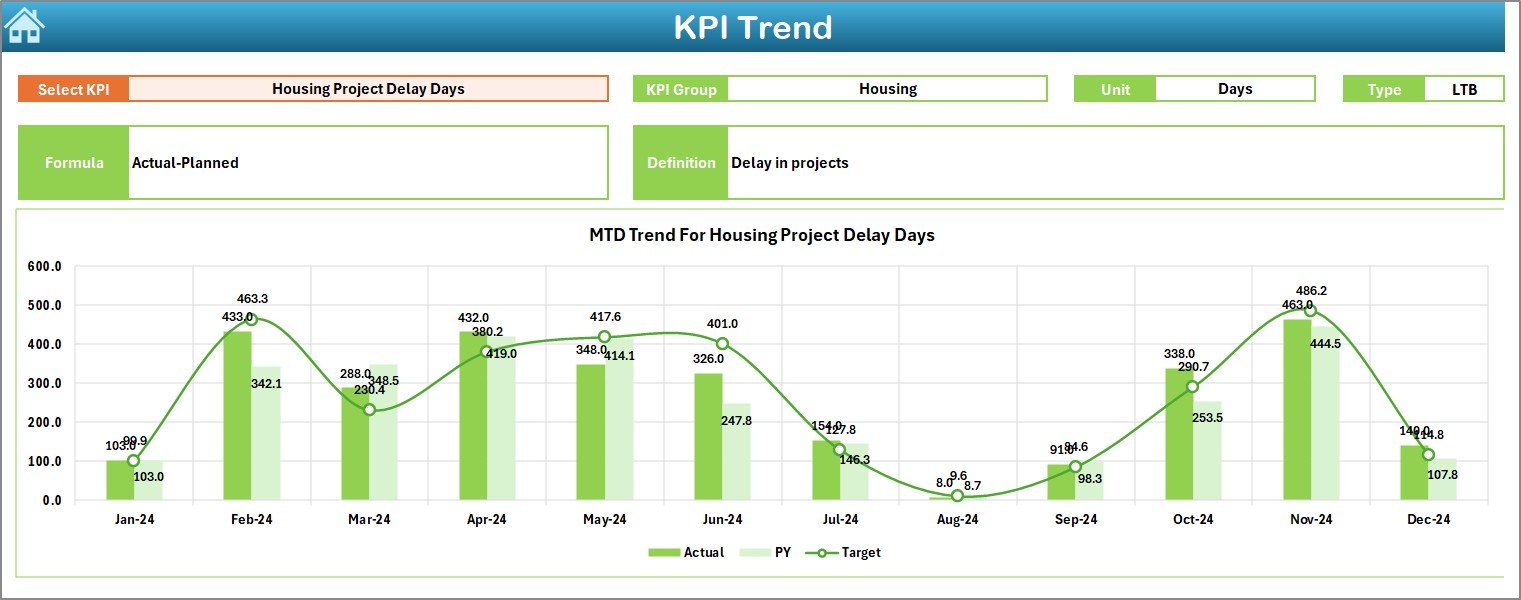
Trend Sheet – Monthly and Yearly KPI Trends
The Trend sheet helps you analyze each KPI in depth.
You select the KPI Name from a drop-down located at cell C3. After that, the dashboard displays:
- KPI Group
- Unit of Measurement
- Type of KPI (Lower the Better or Upper the Better)
- Formula of KPI
- Definition of KPI
- MTD trend chart
- YTD trend chart
This sheet shows Actual, Target, and Previous Year values for each KPI. Because the charts update automatically, you clearly see performance direction and patterns.
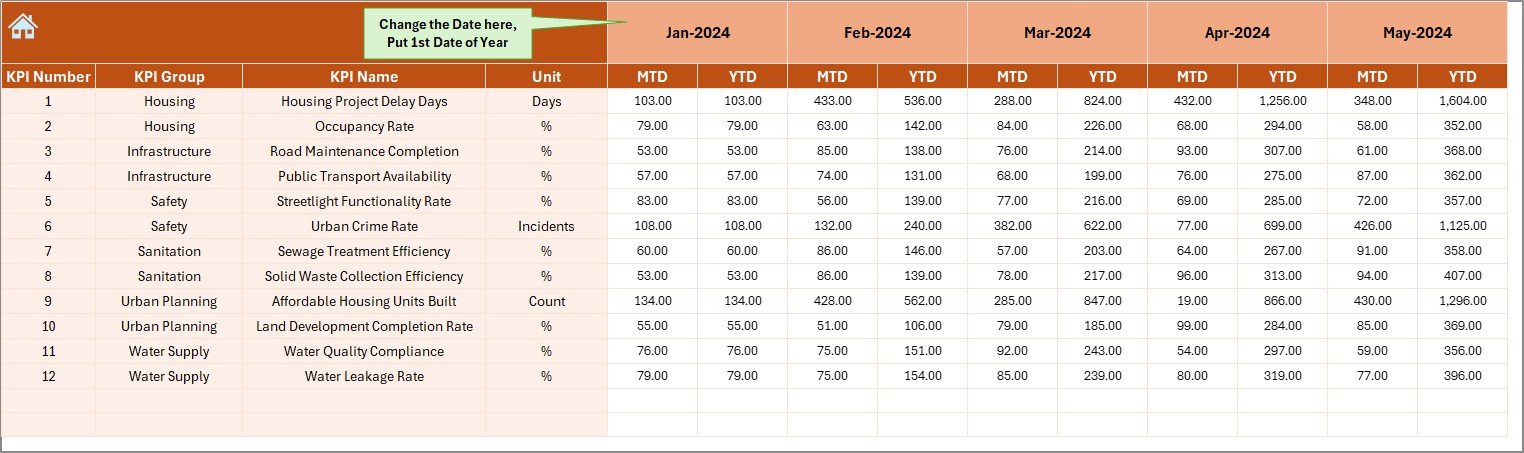
Actual Numbers Input Sheet – Enter Actual Monthly Results
This sheet keeps your monthly and yearly actual numbers organized.
How it works:
- Select the first month of the year in cell E1
- Enter MTD actual results
- Enter YTD actual results
Because the sheet uses structured tables, the dashboard reads your entries accurately.
This makes actual performance data clean, organized, and ready for reporting.
Click to buy Housing & Urban Development KPI Dashboard in Excel
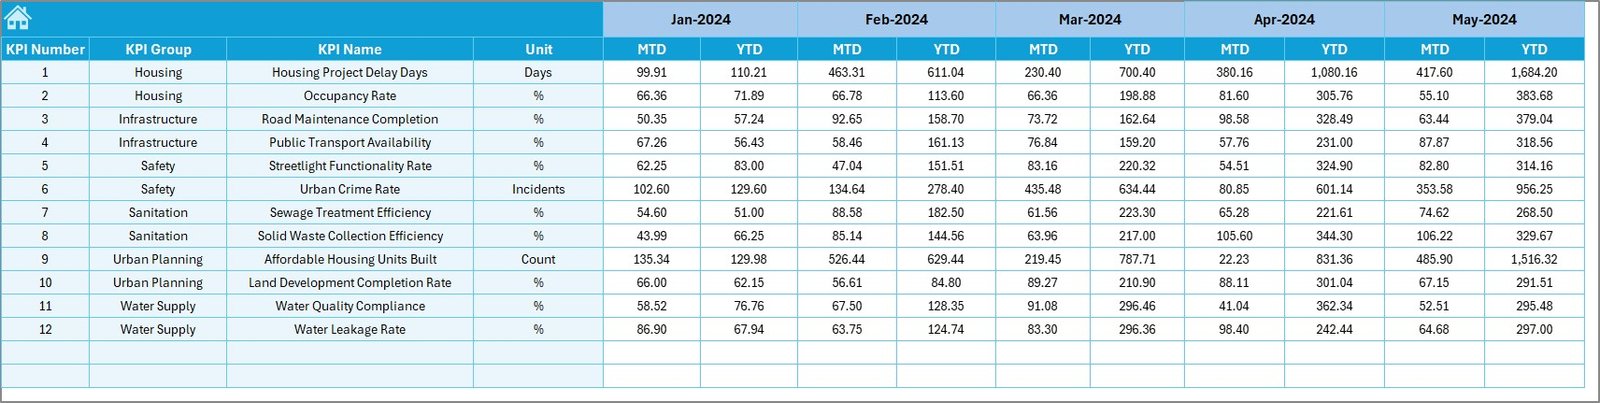
Target Sheet – Add MTD and YTD Targets
This sheet stores monthly and yearly target values for every KPI.
You enter both:
- Target MTD
- Target YTD
This helps the dashboard calculate:
- Target vs Actual comparison
- Achievement percentage
- Variance
- Trend direction
Because targets guide performance, this sheet plays a vital role in development planning.
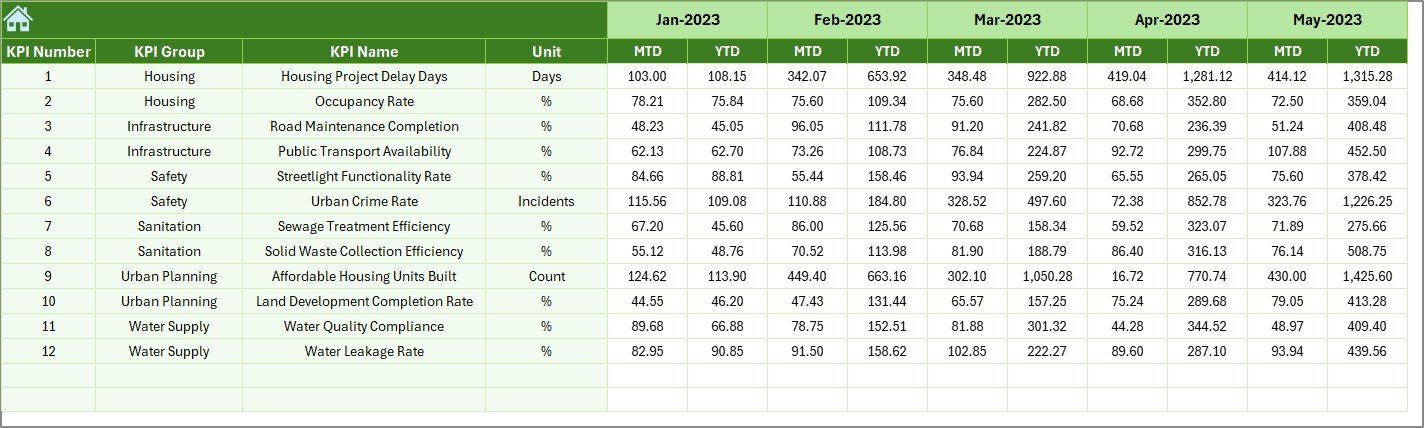
Previous Year Numbers Sheet – Compare with Last Year
This sheet keeps all Previous Year KPIs so that the dashboard can show progress over time.
You enter PY values in the same format used for current year entries. As a result, the dashboard presents historical insights that help leaders understand improvements or declines.
This comparison helps you understand if your development projects grow as expected.
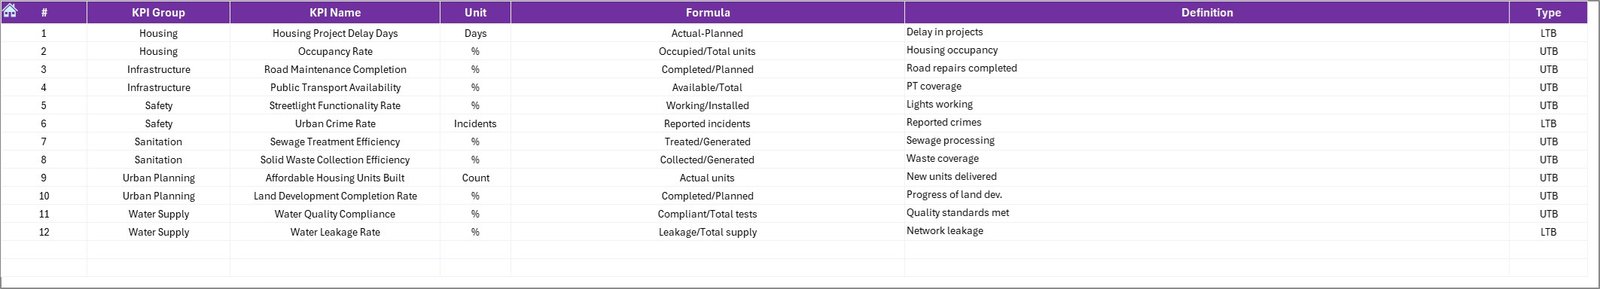
KPI Definition Sheet – Complete KPI Dictionary
Every KPI must be clear and well-defined. That is why the dashboard includes a KPI Definition sheet.
You enter:
- KPI Name
- KPI Group
- Unit
- KPI Formula
- KPI Definition
- KPI Type (UTB or LTB)
This sheet improves transparency and ensures everyone understands each KPI the same way. It supports training, communication, and team alignment.
Advantages of Using the Housing & Urban Development KPI Dashboard in Excel
Using this dashboard gives you several practical advantages. Below are the most important ones.
- You Track Everything in One Place
The dashboard centralizes all KPIs. Because it uses structured worksheets, you do not search for different reports.
- You Make Decisions Faster
Real-time charts and up/down arrows give immediate insights. As a result, you act quickly and avoid delays.
- You Improve Project Planning
Since the dashboard compares Actual, Target, and PY values, you identify gaps and plan better resource allocation.
- You Reduce Manual Work
The dashboard automates trend analysis, calculations, and comparisons. Therefore, you save time and reduce errors.
- You Increase Transparency Across Teams
Clear KPI definitions and organized tracking improve communication among departments.
- You Can Customize It Easily
Excel makes everything flexible. You add new KPIs, update units, change formats, or modify charts with ease.
- You Understand Long-Term Development Trends
YTD and PY comparisons help you measure progress across months and years. This improves long-term planning accuracy.
- You Enhance Accountability
When every KPI is visible, teams take responsibility for performance.
Best Practices for Using the Housing & Urban Development KPI Dashboard
To use this dashboard effectively, follow these best practices:
- Update Actual Numbers Every Month
Always enter monthly MTD and YTD values on time. Because the dashboard depends on data accuracy, this step is important.
- Review KPI Definitions Regularly
Ensure that each KPI definition stays updated and relevant to current development goals.
- Set Realistic and Achievable Targets
Targets drive performance. Therefore, keep them realistic based on past performance and current goals.
- Always Compare Actual vs PY
PY numbers help you measure progress over time. Do not skip this comparison.
- Use Trend Charts for Monthly Reviews
Trend charts show patterns. Use them in meetings to explain performance clearly.
- Train Your Team to Use the Dashboard
When everyone understands the dashboard, performance tracking becomes smoother.
- Protect Formula Cells
Lock formula cells to avoid accidental changes.
- Back Up the Dashboard Regularly
Keep a copy of the file every month for safety and historical analysis.
Conclusion
A Housing & Urban Development KPI Dashboard in Excel is one of the most effective tools to monitor performance, improve planning, and support smart decisions. It organizes all KPIs in one structured format and makes reporting simple, accurate, and visual. Because the dashboard tracks MTD, YTD, Target, and PY values with dynamic charts, you understand performance instantly.
Whether you manage housing projects, construction timelines, budget planning, occupancy management, or community development activities, this dashboard will help you stay in control and improve results continuously.
Frequently Asked Questions
- What KPIs can I track in this dashboard?
You can track occupancy, construction progress, budget utilization, customer satisfaction, project completion, compliance performance, revenue, and many more KPIs.
- Can I add more KPIs to this dashboard?
Yes. You can add new KPIs in the KPI Definition sheet and update actual, target, and PY values.
- Does this dashboard require advanced Excel skills?
No. The dashboard is simple and uses drop-downs, formulas, and charts that beginners can understand.
- Can I customize the charts and colors?
Yes. Because the dashboard runs in Excel, you can modify chart styles, colors, and formats anytime.
- Does the dashboard support YTD and PY analysis?
Yes. You can compare YTD and PY values through dynamic charts and variance indicators.
Visit our YouTube channel to learn step-by-step video tutorials
Watch the step-by-step video tutorial:
Click to buy Housing & Urban Development KPI Dashboard in Excel