In today’s competitive manufacturing world, data is the key driver of efficiency, profitability, and decision-making. Every process — from production and inventory to quality control and delivery — generates valuable data. However, without a proper way to visualize and analyze that data, it’s easy to lose track of performance trends.
That’s where the Manufacturing KPI Dashboard in Power BI comes in. This ready-to-use dashboard allows manufacturers to monitor, analyze, and optimize every aspect of their operations using real-time data. With a structured Power BI dashboard linked to Excel data, you can easily transform complex manufacturing metrics into actionable insights.
Let’s explore everything about this powerful dashboard — from its structure and features to its advantages, best practices, and most frequently asked questions.
Click to buy Manufacturing KPI Dashboard in Power BI
What Is a Manufacturing KPI Dashboard in Power BI?
A Manufacturing KPI Dashboard in Power BI is an interactive data visualization tool designed to help manufacturers track key performance indicators (KPIs) such as production output, machine downtime, defect rates, and resource utilization. Built in Microsoft Power BI, it connects directly to Excel data sources, making it both flexible and easy to update.
The dashboard consolidates your most important metrics into a single, dynamic interface, allowing you to measure current performance, compare it against targets, and analyze historical trends — all in one place.
This Power BI solution is ideal for:
- Factory managers monitoring daily production efficiency
- Quality control teams tracking defect trends
- Operations heads evaluating performance against goals
- Executives analyzing productivity across plants and departments
By using Power BI, the dashboard eliminates manual data entry and brings automation, interactivity, and deep analytical insights to your manufacturing data.
Key Features of the Manufacturing KPI Dashboard in Power BI
This ready-to-use dashboard contains three primary pages that display manufacturing KPIs and trends in a clean, organized format.
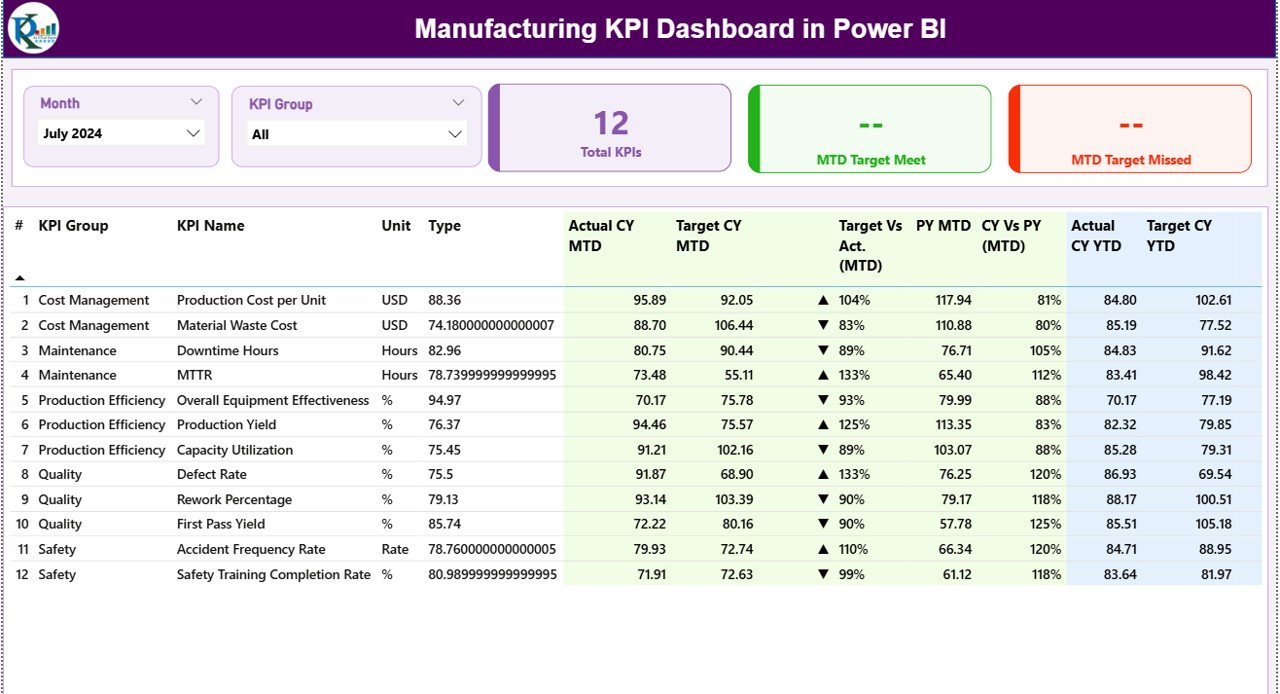
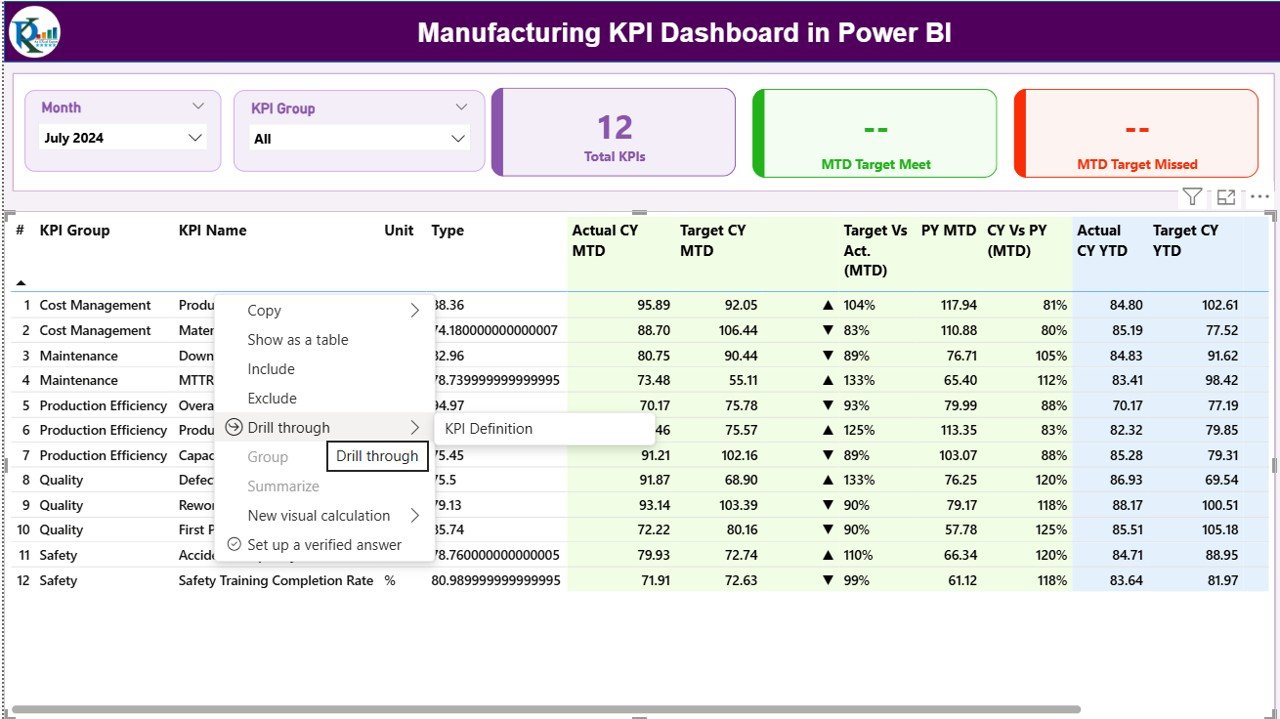
Summary Page
The Summary Page is the main interface of the dashboard — your command center for performance insights.
At the top, you’ll find slicers that allow you to filter by:
- Month
- KPI Group
Below the filters, three dynamic KPI Cards display at a glance:
- Total KPIs Count — Total number of KPIs being tracked.
- MTD Target Met Count — How many KPIs have met or exceeded their monthly target.
- MTD Target Missed Count — How many KPIs are underperforming for the month.
Click to buy Manufacturing KPI Dashboard in Power BI
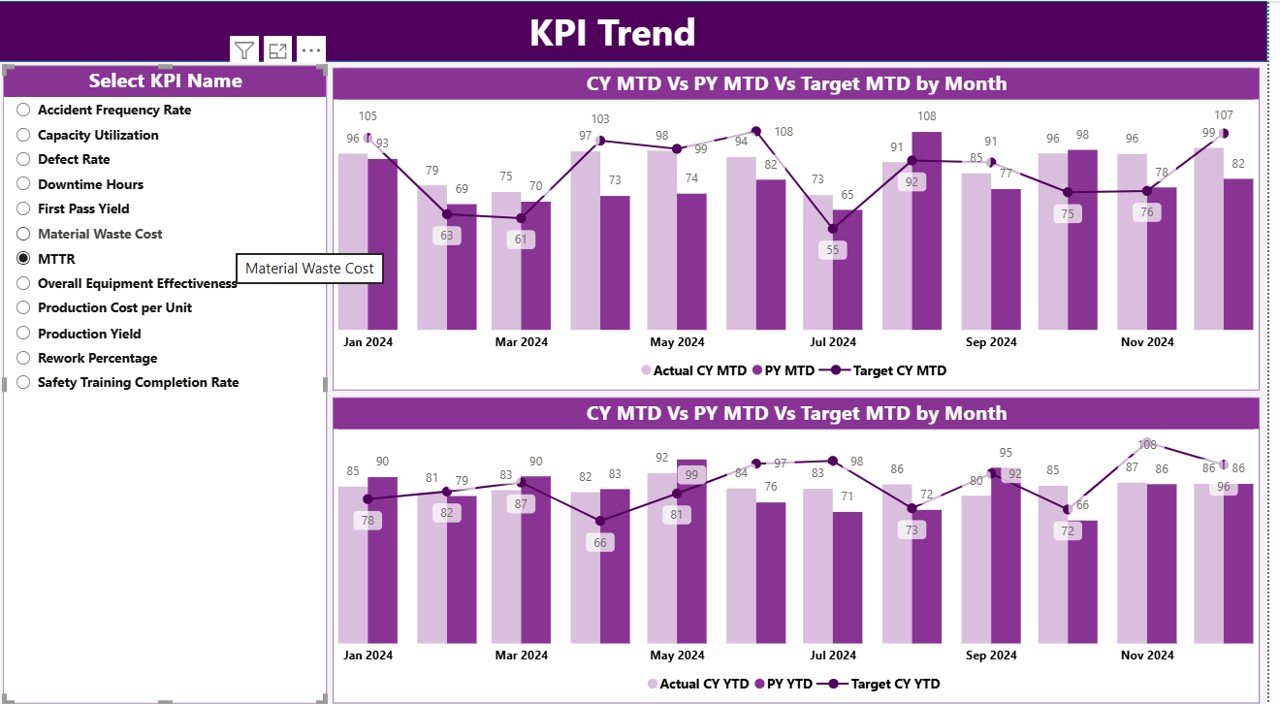
KPI Trend Page
The KPI Trend Page provides visual analytics through combo charts that compare:
- Current Year Actuals
- Previous Year Actuals
- Target Values
You can select any specific KPI from a slicer on the left to see its monthly performance trend. This view makes it easy to visualize growth patterns, seasonal trends, and areas for improvement.
The side-by-side MTD and YTD charts empower managers to track both short-term fluctuations and long-term performance consistency.
Click to buy Manufacturing KPI Dashboard in Power BI
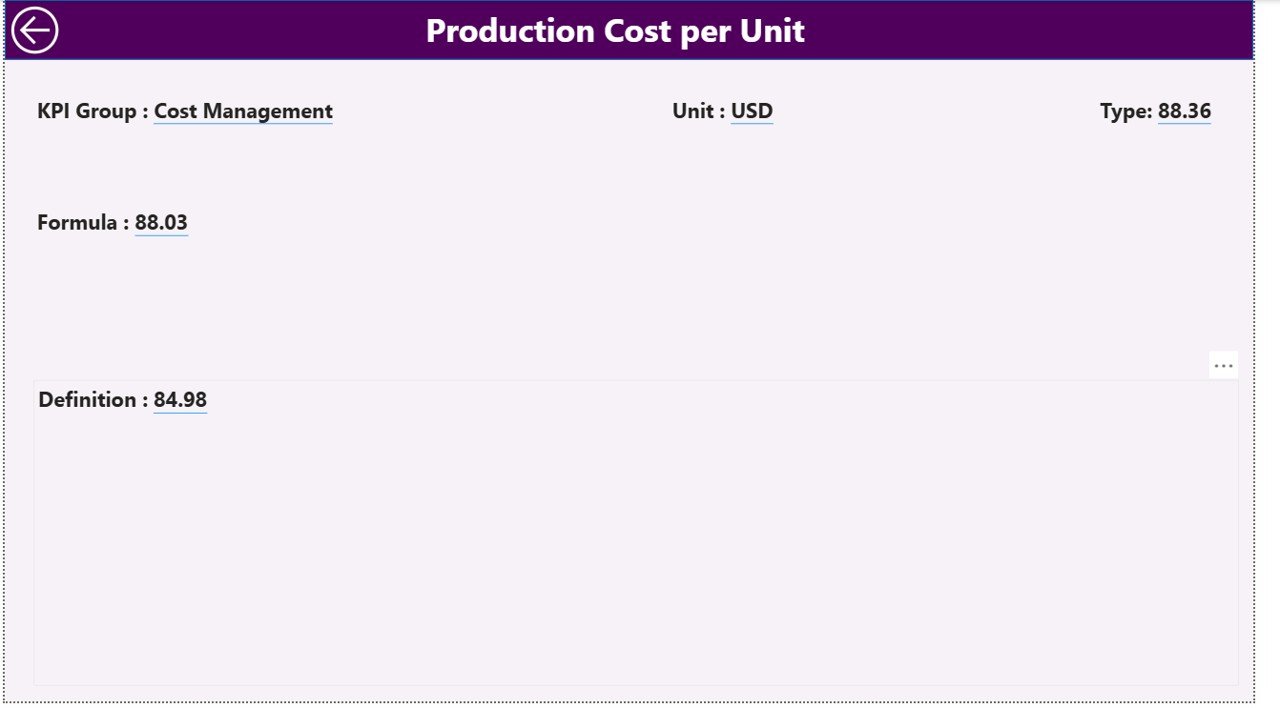
KPI Definition Page
The KPI Definition Page acts as a drill-through page — accessible directly from the summary table.
When you select a KPI and drill through, it opens a detailed view containing:
- The Formula used for calculation
- The Definition or explanation of the KPI
- The Type (LTB/UTB)
- Associated business logic
This page helps stakeholders understand exactly how each KPI is derived and ensures data transparency across teams.
You can easily navigate back to the main dashboard using the Back button located in the top-left corner.
Click to buy Manufacturing KPI Dashboard in Power BI
Excel Data Source Structure
The Manufacturing KPI Dashboard in Power BI pulls all its data from an Excel workbook. This approach provides simplicity and flexibility — you can modify, add, or remove data without technical expertise.
The Excel file includes three main worksheets:
Input_Actual Sheet
Enter your actual performance data here.
- Columns include KPI Name, Month (using first day of month), MTD value, and YTD value.
- Each record represents a KPI’s performance for a given period.
Input_Target Sheet
Input your target values for each KPI.
- Similar structure to the Actual sheet — includes KPI Name, Month, MTD target, and YTD target.
KPI Definition Sheet
Define all KPIs with their details:
- KPI Number
- KPI Group
- KPI Name
- Unit of Measurement
- Formula
- Definition
- Type (LTB/UTB)
This setup makes it simple for Power BI to refresh automatically, keeping your dashboard current with minimal effort.
Click to buy Manufacturing KPI Dashboard in Power BI
Why Manufacturers Need a KPI Dashboard
Manufacturing operations involve numerous interdependent processes. Without clear visibility, inefficiencies can go unnoticed. A Power BI-based dashboard helps by providing:
- Real-time monitoring of production and performance.
- Centralized data for multiple departments and plants.
- Faster decision-making with visual analytics.
- Automated performance tracking without manual reporting.
- Historical comparisons to assess long-term progress.
With this tool, plant managers and executives can make informed decisions that drive efficiency, reduce waste, and boost output.
Advantages of Manufacturing KPI Dashboard in Power BI
Implementing this dashboard brings multiple benefits across operational, financial, and strategic areas:
Real-Time Insights
Get instant visibility into production performance, allowing quick responses to issues like equipment downtime or bottlenecks.
Improved Decision-Making
Use interactive visuals to compare actual performance against targets and identify trends that impact efficiency.
Error Reduction
Automated data connections from Excel eliminate manual entry errors and ensure consistent data accuracy.
Enhanced Productivity
Identify underperforming areas, track KPI trends, and allocate resources efficiently for better output.
Cross-Functional Alignment
The dashboard unites operations, finance, and quality teams around a single data source, improving collaboration and accountability.
Customizable Interface
Easily adjust visuals, filters, and data points to suit your organization’s unique manufacturing goals.
Historical Performance Tracking
Analyze how each KPI evolves over months or years to forecast trends and plan better for the future.
How the Dashboard Supports Continuous Improvement
Continuous improvement is the heart of modern manufacturing, and the Power BI dashboard facilitates it through:
- Trend analysis: Visual charts help track how processes evolve.
- Root cause identification: KPI variances reveal performance gaps.
- Goal alignment: Departmental KPIs stay aligned with corporate targets.
- Instant feedback loops: Managers can take corrective actions based on current data, not outdated reports.
By converting performance data into actionable insights, this dashboard becomes a core tool for operational excellence.
Use Cases of Manufacturing KPI Dashboard
Here are a few real-world scenarios where this dashboard delivers measurable value:
- Production Planning: Compare planned vs actual output across shifts.
- Quality Assurance: Track defect percentages and root causes over time.
- Maintenance: Monitor machine uptime, downtime, and maintenance costs.
- Supply Chain: Evaluate on-time delivery rates and supplier performance.
- Inventory Control: Manage stock levels and turnover ratios efficiently.
- Safety Management: Monitor incident rates and compliance scores.
Each of these use cases demonstrates how Power BI transforms raw data into meaningful insights for smarter decision-making.
Best Practices for the Manufacturing KPI Dashboard in Power BI
To get the most out of your Manufacturing KPI Dashboard, follow these proven best practices:
Define Clear KPIs
Start by listing measurable and meaningful KPIs such as Overall Equipment Effectiveness (OEE), Production Yield, and Scrap Rate. Ensure each KPI aligns with strategic goals.
Maintain Data Consistency
Keep data formatting consistent in your Excel files — especially date formats and KPI names — to avoid mismatches during Power BI refresh.
Update Regularly
Refresh data frequently (daily or weekly) to keep your dashboard accurate and up to date.
Leverage Conditional Formatting
Use color indicators like red, green, and yellow to make it easy to spot underperformance or improvement trends instantly.
Protect Data Integrity
Limit editing access in your Excel source files to authorized personnel only.
Automate Data Refresh
Use Power BI’s scheduled refresh feature to automate updates from Excel or your ERP system.
Train Your Team
Ensure that all users understand how to interpret the dashboard metrics to make informed decisions.
How to Use the Manufacturing KPI Dashboard
- Connect the Excel Data Source:
Import the provided Excel file into Power BI. - Refresh Data:
Update MTD and YTD data in the Excel sheets and refresh Power BI. - Explore Dashboard Pages:
- Use filters on the Summary Page to analyze performance by Month or KPI Group.
- Open the KPI Trend Page to see historical charts.
- Drill through to the KPI Definition Page for formula details.
- Export or Share Reports:
Share dashboards securely across your organization using Power BI Service or embed them in SharePoint or Teams.
Conclusion
The Manufacturing KPI Dashboard in Power BI is a game-changing analytics solution for modern manufacturing businesses. It combines automation, visualization, and interactivity to help you track performance, set realistic goals, and make smarter decisions — all from a single dashboard.
Whether you’re a plant manager tracking daily production or a CEO evaluating company-wide efficiency, this dashboard gives you a unified, data-driven perspective on operations. It’s more than just a reporting tool — it’s your path to continuous improvement and operational excellence.
Frequently Asked Questions (FAQs)
What is a Manufacturing KPI Dashboard?
It’s a visual analytics tool that tracks key performance indicators such as production efficiency, defect rates, and machine downtime to monitor manufacturing performance.
How does the Power BI dashboard connect to Excel data?
The dashboard links directly to Excel sheets for Actual, Target, and Definition data. When you update the Excel file, the Power BI dashboard refreshes automatically.
What KPIs can I track with this dashboard?
You can track KPIs like Production Output, OEE, Yield, Downtime, Defects per Unit, On-Time Delivery, and more — fully customizable to your needs.
Do I need advanced Power BI skills to use it?
Not at all. The dashboard is pre-built and user-friendly. You only need to update your Excel sheets; everything else updates automatically.
Can I customize the visuals?
Yes. You can change colors, chart types, or KPI cards in Power BI Desktop to match your brand or reporting style.
How often should I update my data?
Weekly updates are ideal for most plants, though high-volume manufacturers may prefer daily refreshes for real-time monitoring.
Can this dashboard integrate with ERP systems?
Yes, Power BI allows integration with ERP systems like SAP, Oracle, or Microsoft Dynamics to automate data collection.
Is this dashboard suitable for small manufacturers?
Absolutely. The dashboard is scalable — perfect for both small factories and large enterprises.
Visit our YouTube channel to learn step-by-step video tutorials
Watch the step-by-step video tutorial:
Click to buy Manufacturing KPI Dashboard in Power BI