In today’s fast-paced manufacturing environment, monitoring production efficiency, cost, and quality is essential for success. The Manufacturing Process Report in Excel is a ready-to-use tool designed to help managers, supervisors, and analysts track and analyze manufacturing data effectively. With interactive dashboards, charts, and pivot views, this Excel report provides a comprehensive overview of your manufacturing operations.
Key Features of the Manufacturing Process Report
This report contains three sheet tabs: Summary, Report, and Data, each designed to serve a specific purpose for monitoring and decision-making.
1. Summary Sheet Tab
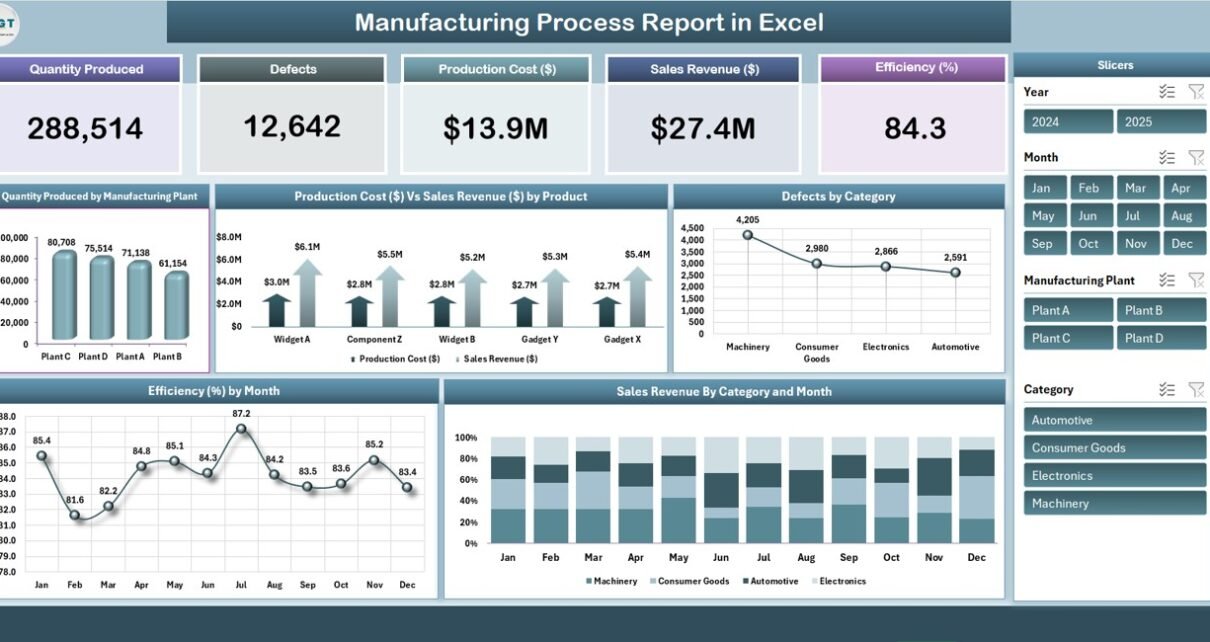
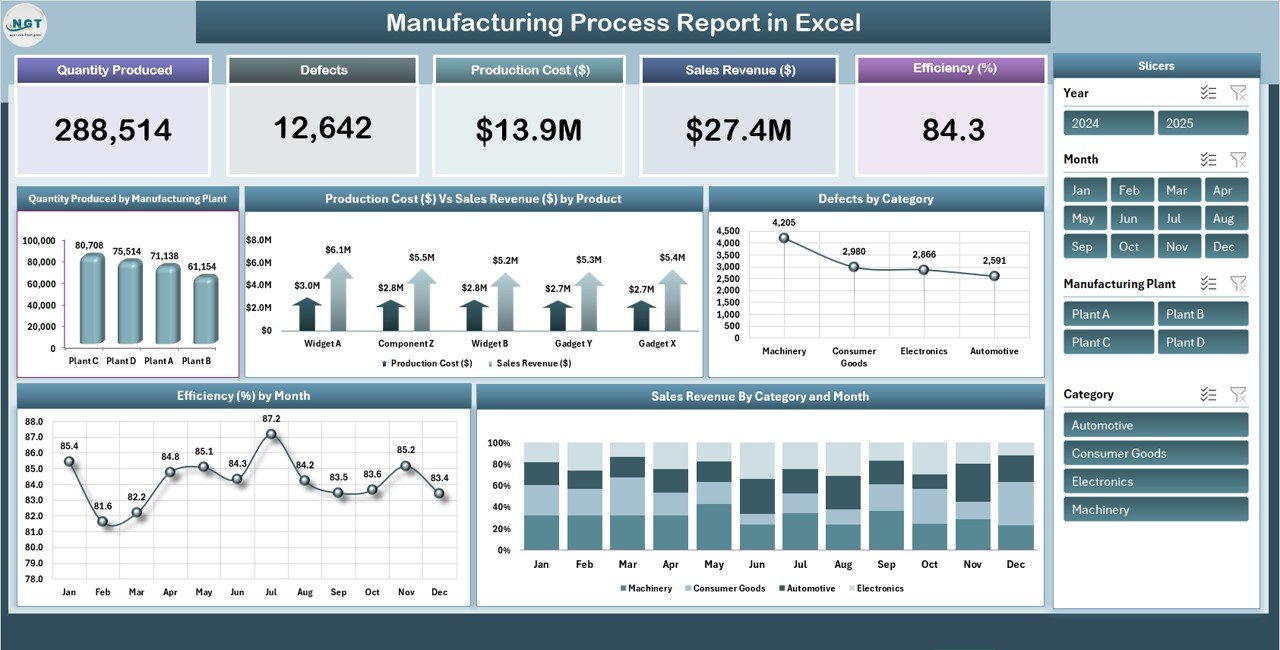
The Summary sheet is the main dashboard, offering a quick snapshot of your manufacturing performance. It contains key cards and charts:
Cards Include:
-
Quantity Produced – Total units produced over the selected period.
-
Defects – Total defective units, helping to track quality issues.
-
Production Cost ($) – Overall production expenditure.
-
Sales Revenue ($) – Revenue generated from sold products.
-
Efficiency (%) – Measures production efficiency against target.
Charts Include:
-
Quantity Produced by Manufacturing Plant – Compare production across multiple plants.
-
Production Cost ($) vs Sales Revenue ($) by Product – Visualize profitability and cost-effectiveness.
-
Defects by Category – Identify recurring quality issues by defect type.
-
Sales Revenue by Category and Month – Track revenue trends for different product categories.
-
Efficiency (%) by Month – Monitor monthly production efficiency.
Click to Buy Manufacturing Process Report in Excel
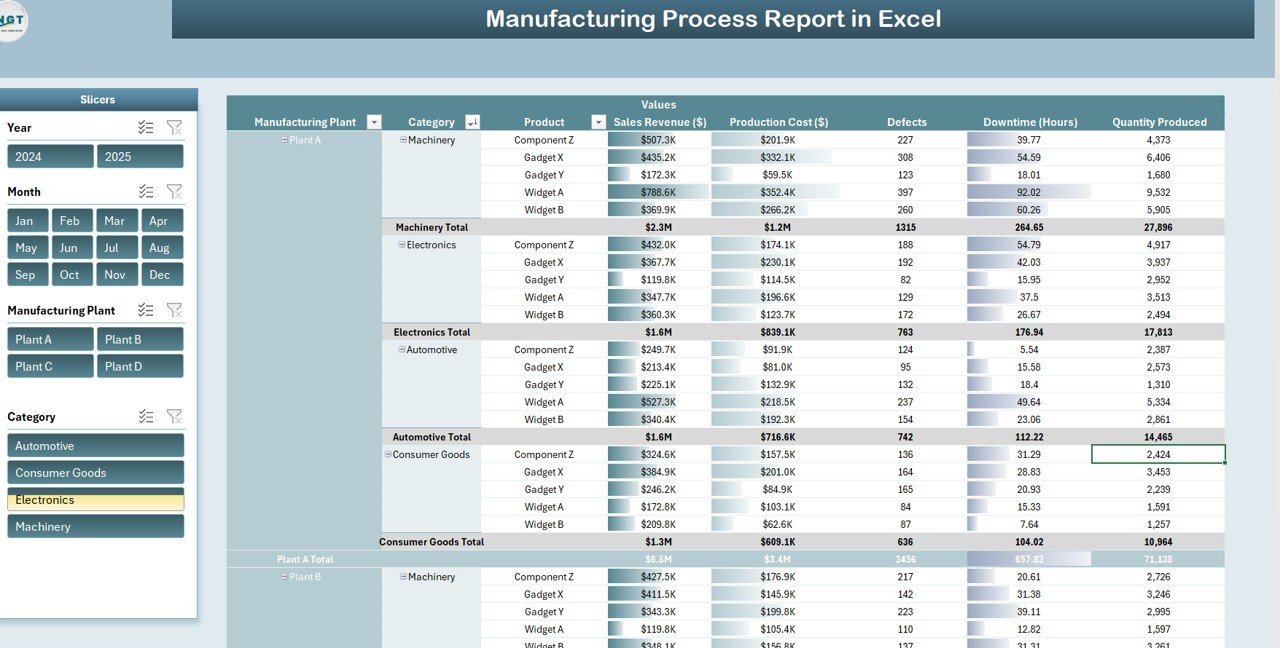
2. Report Sheet Tab
The Report sheet provides a Power Pivot view for detailed data analysis. Users can filter by plant, product, or time period to identify trends, bottlenecks, and areas for improvement. This sheet is perfect for managers who need granular insights into production performance and efficiency metrics.
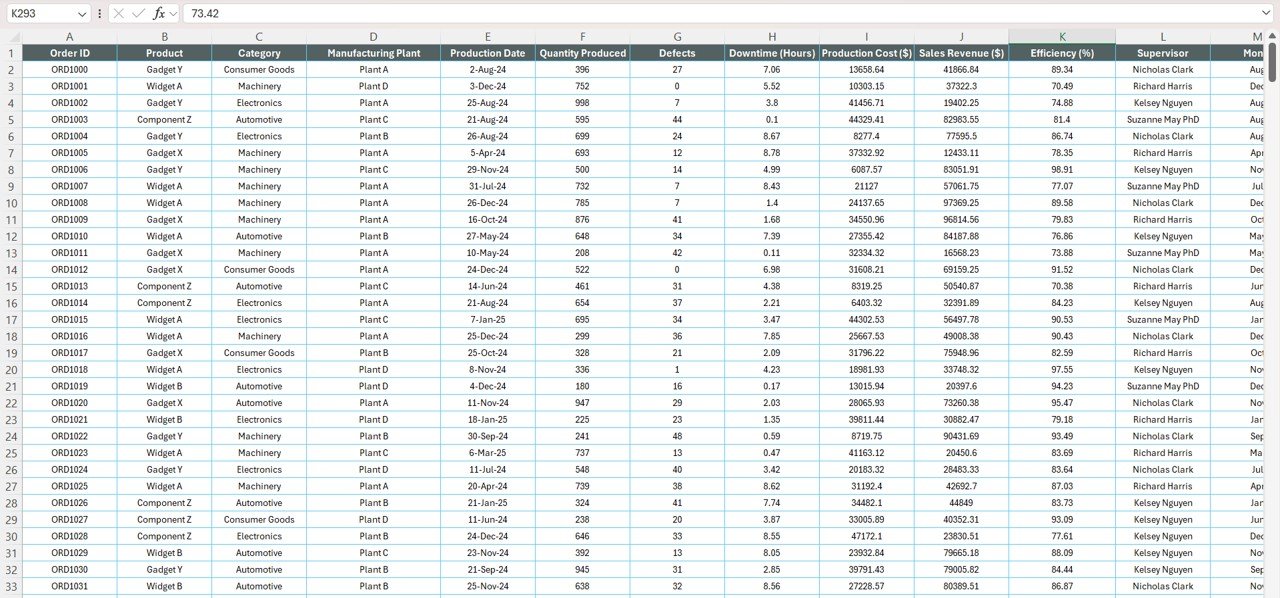
3. Data Sheet Tab
The Data sheet is the input hub where all manufacturing records are stored. Users can add daily production data, defects, costs, and sales figures. This centralized dataset ensures the Summary and Report tabs update automatically, providing real-time insights.
Click to Buy Manufacturing Process Report in Excel
Benefits of Using This Report
-
Improved Visibility: Get a clear picture of production trends, costs, and efficiency in one place.
-
Better Decision-Making: Use data-driven insights to improve production planning and reduce defects.
-
Time-Saving: Automated dashboards eliminate the need for manual calculations and reporting.
-
Customizable: Easily update data, charts, and KPIs to suit your manufacturing process.
Opportunities for Improvement
Click to Buy Manufacturing Process Report in Excel
-
Integrate with ERP systems for automated data collection.
-
Add predictive analytics to forecast production and defects.
-
Include employee productivity metrics to identify training needs.
Best Practices
-
Update the Data sheet daily to maintain accuracy.
-
Regularly review Efficiency and Defect trends to catch issues early.
-
Customize charts to highlight key KPIs relevant to your plant or department.
Frequently Asked Questions (FAQ)
Click to Buy Manufacturing Process Report in Excel
Q1: Can this report handle multiple manufacturing plants?
Yes, the report is designed to track data for multiple plants and compare their performance.
Q2: Is it suitable for large datasets?
Absolutely. Using Excel’s Power Pivot functionality, it can handle large datasets efficiently.
Q3: Can I add new KPIs?
Yes, you can customize the report by adding new metrics or KPIs to match your requirements.
Q4: Do I need advanced Excel skills to use this report?
No, this report is user-friendly and ready-to-use. Basic Excel skills are sufficient to input data and view dashboards.
Q5: Can I export reports for presentations?
Yes, all charts and dashboards can be exported to PowerPoint or PDF for sharing with stakeholders.
Conclusion
The Manufacturing Process Report in Excel is a powerful tool for tracking production, monitoring defects, analyzing costs, and improving efficiency. By using this report, manufacturing managers can make informed decisions, identify operational bottlenecks, and boost overall productivity.
With real-time insights, interactive dashboards, and detailed reporting, this Excel report is an indispensable tool for modern manufacturing operations.
Visit our YouTube channel to learn step-by-step video tutorials
Youtube.com/@NeotechNavigators
Watch the step-by-step video Demo:
Click to Buy Manufacturing Process Report in Excel