Running a nonprofit organization requires passion, transparency, and measurable impact. However, when teams manage several projects, donors, and programs, tracking performance becomes a major challenge. Without clear insights, leaders can’t evaluate what’s working and where improvement is needed.
That’s where the Nonprofit Organizations KPI Dashboard in Excel becomes an essential tool. This ready-to-use template provides a structured and visual way to track key performance indicators (KPIs), monitor progress, and ensure accountability. Built entirely in Microsoft Excel, it helps nonprofit managers, analysts, and executives measure their organization’s effectiveness with data-driven clarity.
Click to buy Nonprofit Organizations KPI Dashboard in Excel
What Is a Nonprofit Organizations KPI Dashboard in Excel?
A Nonprofit Organizations KPI Dashboard is an analytical Excel-based tool that consolidates all your key metrics—financial, operational, and programmatic—into a single interactive file. It turns complex data into visual insights through KPI cards, trend charts, and variance comparisons.
Unlike traditional spreadsheets, this dashboard updates automatically when you change the month or KPI. You can compare Actual, Target, and Previous Year (PY) values instantly and view performance at a glance using conditional formatting arrows that highlight progress or shortfalls.
This ready-to-use Excel dashboard provides a transparent way to communicate performance with your team, board members, and donors—helping everyone stay aligned with the organization’s mission.
Core Objective of the Dashboard
The main goal of this dashboard is to simplify performance management for nonprofit teams. It helps you:
- Monitor KPIs across different projects and programs.
- Measure monthly and yearly progress toward set targets.
- Identify areas that need improvement through data visualization.
- Provide accountability and transparency in reporting to stakeholders.
- Streamline planning, forecasting, and performance reviews.
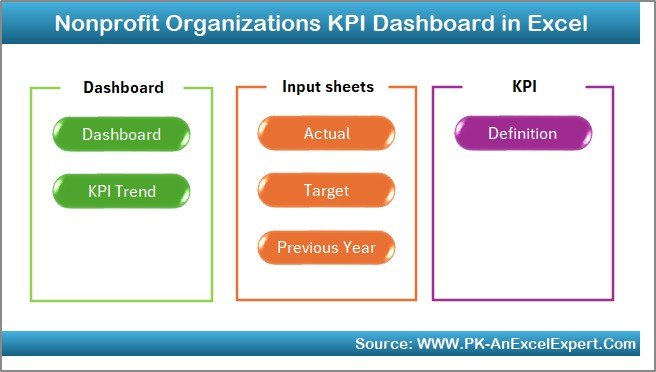
Key Features of the Nonprofit Organizations KPI Dashboard in Excel
This dashboard includes seven carefully structured worksheets, each designed to handle a specific task. Let’s explore each one in detail:
Home Sheet – The Command Center
The Home sheet serves as the dashboard’s main navigation hub. It includes six easy-to-use buttons that take you directly to the corresponding sheets, such as Dashboard, KPI Trend, Actuals, Targets, and KPI Definitions.
This design makes it simple for users—especially non-technical staff—to move across pages without scrolling or searching. With a single click, you can view the latest performance report or update data inputs, making the dashboard both user-friendly and efficient.
Click to buy Nonprofit Organizations KPI Dashboard in Excel
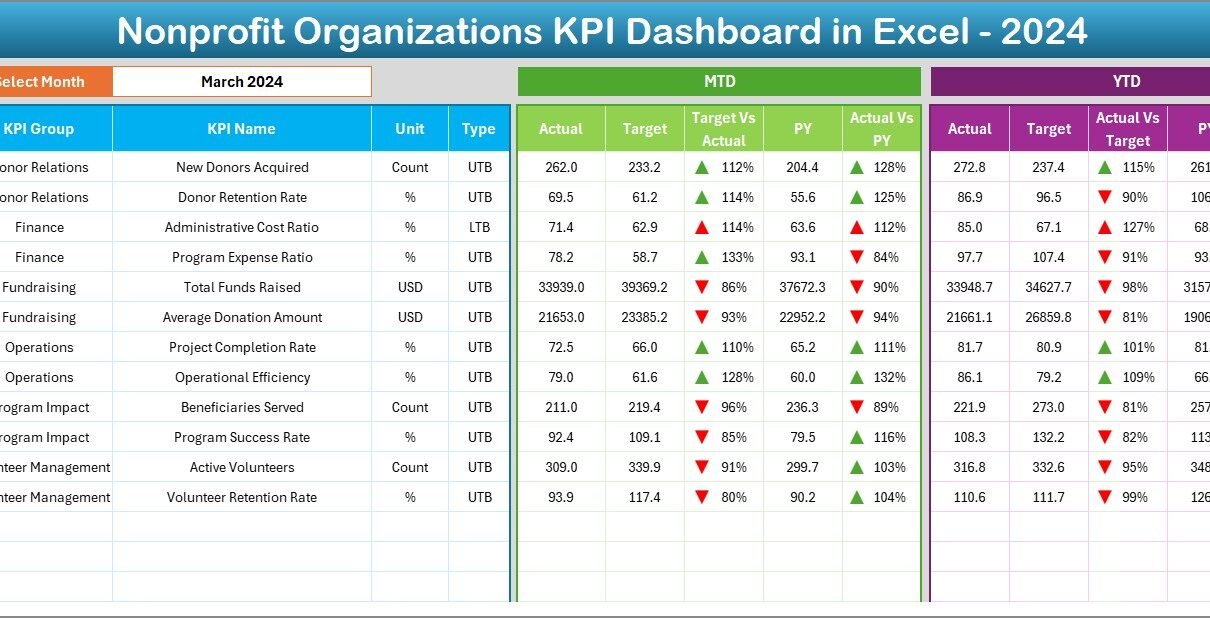
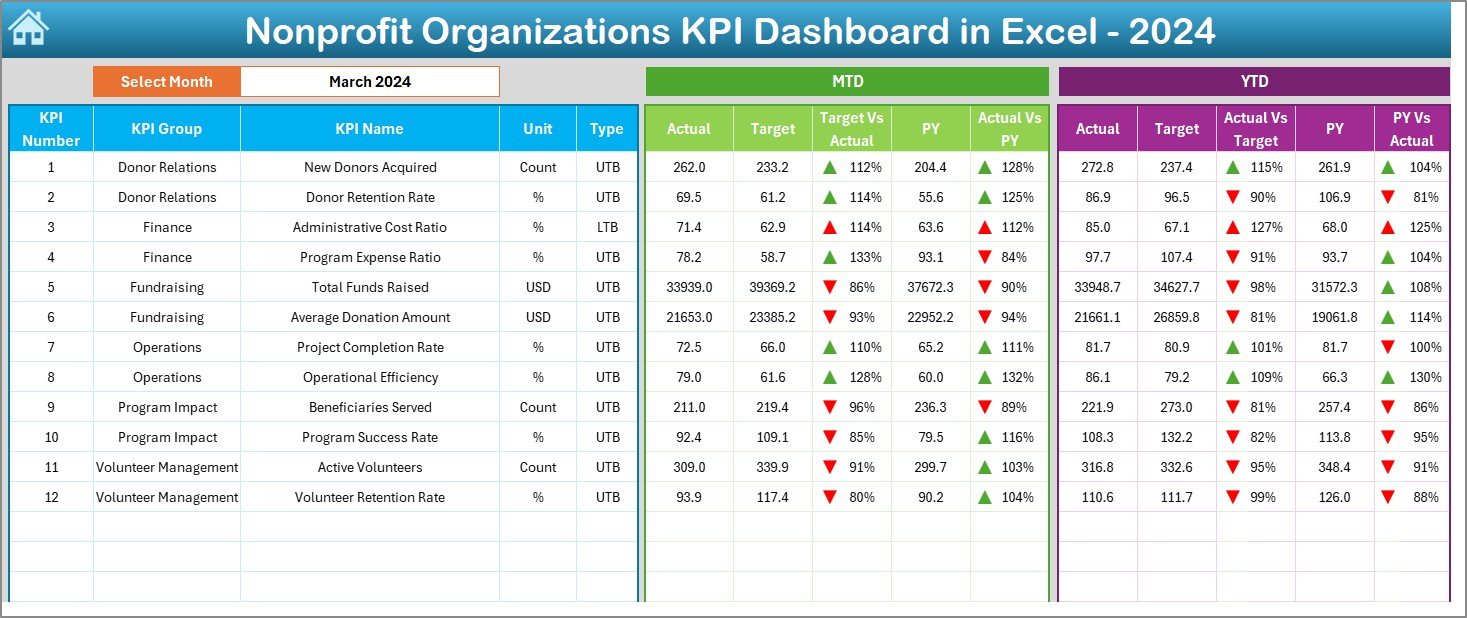
Dashboard Sheet – The Analytical Core
The Dashboard sheet tab is the central part of this Excel system. It provides a complete view of all KPIs with side-by-side comparisons for MTD (Month-to-Date), YTD (Year-to-Date), Target, and Previous Year (PY) data.
At cell D3, you can select the month from a dropdown list. As soon as you select a different month, all numbers and charts update automatically.
Each KPI includes performance comparisons:
- Target vs. Actual
- Previous Year vs. Actual
The results appear with up-down arrows, where colors and icons instantly reveal whether performance has improved or declined.
This visual approach eliminates guesswork, allowing leadership teams to understand the health of the organization in seconds.
Click to buy Nonprofit Organizations KPI Dashboard in Excel
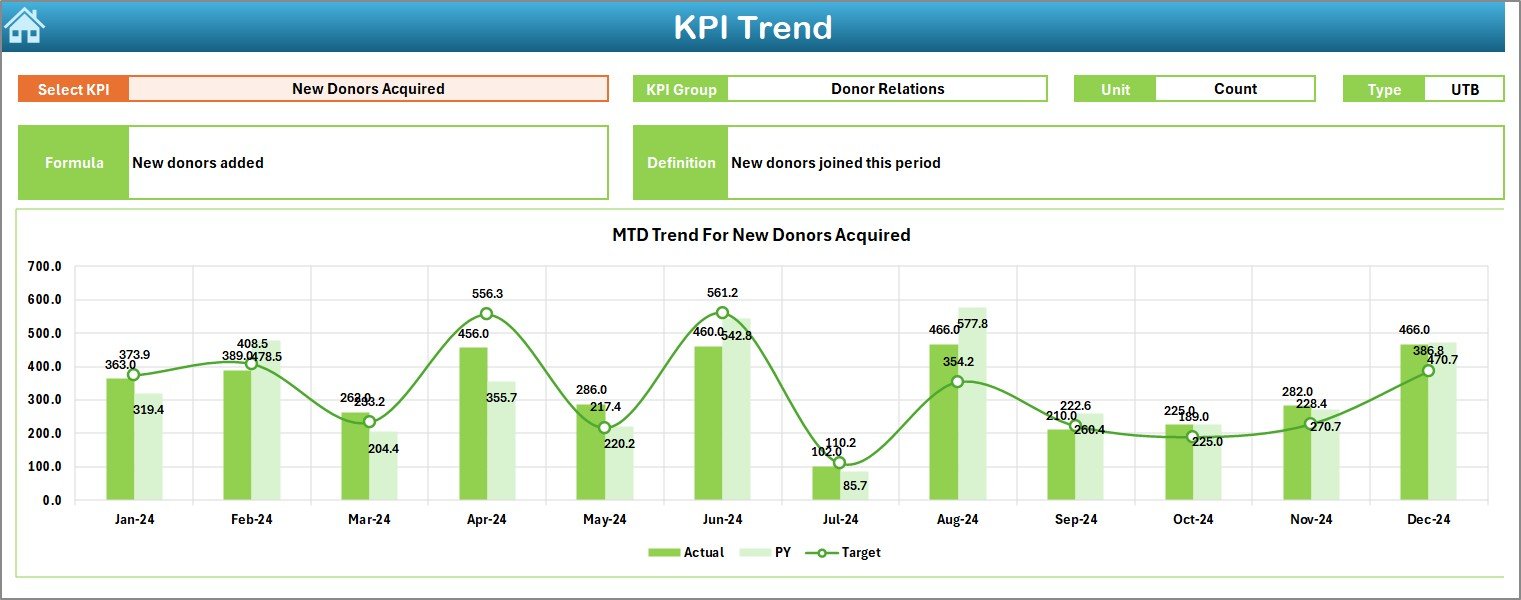
KPI Trend Sheet – Track the Progress Over Time
In the KPI Trend sheet, users can dive deeper into the performance of a specific KPI. From the dropdown in cell C3, you can choose a KPI name, and the dashboard instantly shows:
- KPI Group
- Unit of Measurement
- Type (Upper the Better – UTB or Lower the Better – LTB)
- Formula used to calculate the KPI
- Definition for easy understanding
Below this section, you’ll find two beautifully designed trend charts showing MTD and YTD movements of Actual, Target, and Previous Year data.
These visual trends help managers spot consistent improvement, identify seasonal patterns, and take corrective actions early.
Click to buy Nonprofit Organizations KPI Dashboard in Excel
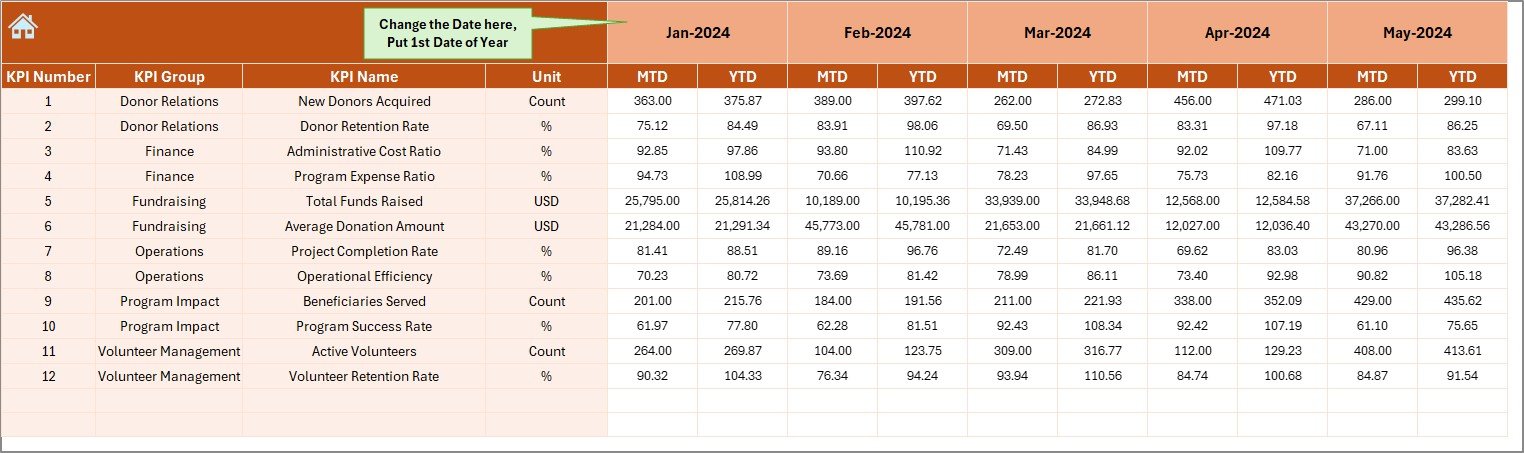
Actual Numbers Input Sheet – Capture the Real Data
The Actual Numbers Input sheet is where you record actual monthly performance data.
Here’s how it works:
- You can change the month in cell E1 to define the starting point of your reporting year.
- Enter MTD and YTD numbers for each KPI, ensuring accurate monthly tracking.
By entering data only once, you allow all connected sheets (Dashboard, Trend, and Reports) to update automatically, saving hours of manual effort.
Click to buy Nonprofit Organizations KPI Dashboard in Excel
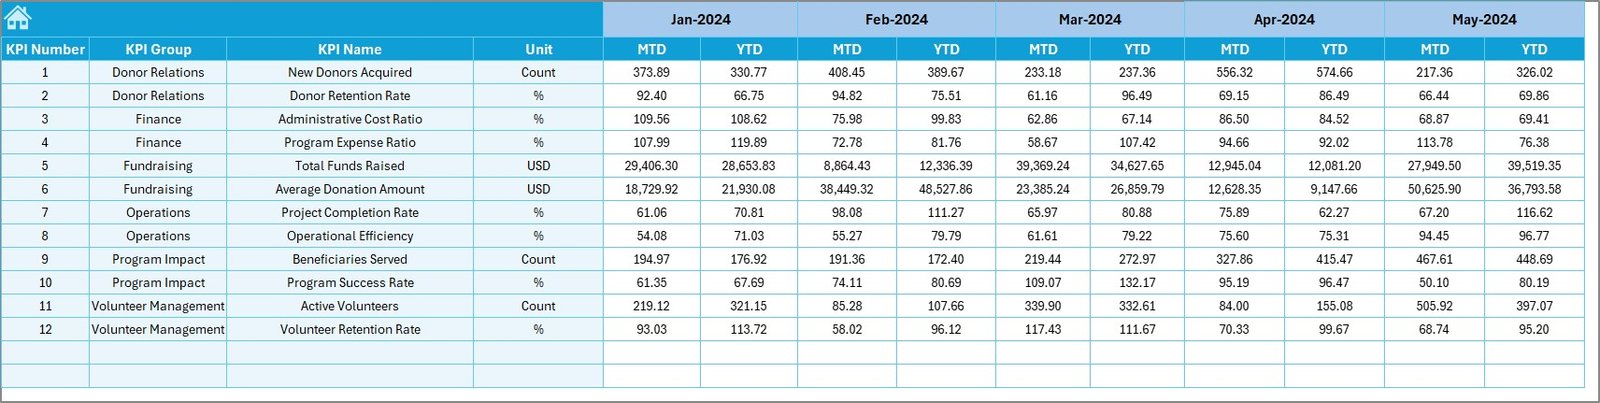
Target Sheet – Set the Benchmark
The Target Sheet tab helps you define realistic and measurable goals. For each KPI, you can enter both MTD and YTD targets for every month.
When you set clear targets, the dashboard compares them against actual results and highlights whether performance is on track or behind.
This process encourages continuous improvement and ensures every team member understands organizational expectations.
Click to buy Nonprofit Organizations KPI Dashboard in Excel
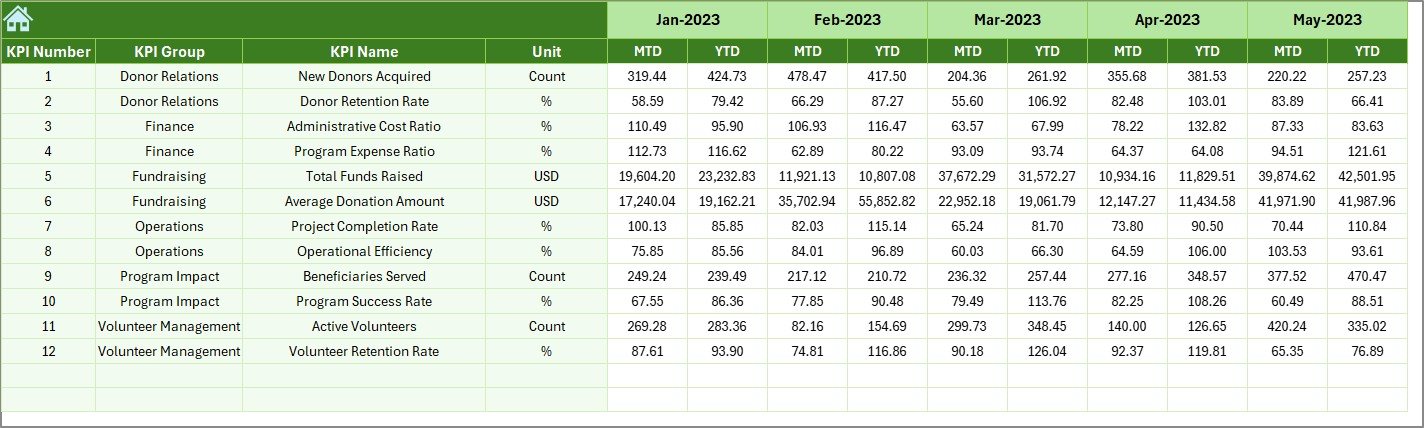
Previous Year Number Sheet – Compare with the Past
To measure growth, you need a benchmark. The Previous Year Number sheet stores historical data for the same KPIs used in the current year.
By comparing Actual vs. Previous Year, nonprofits can evaluate year-over-year performance. This comparison is crucial for understanding long-term impact, program stability, and funding effectiveness.
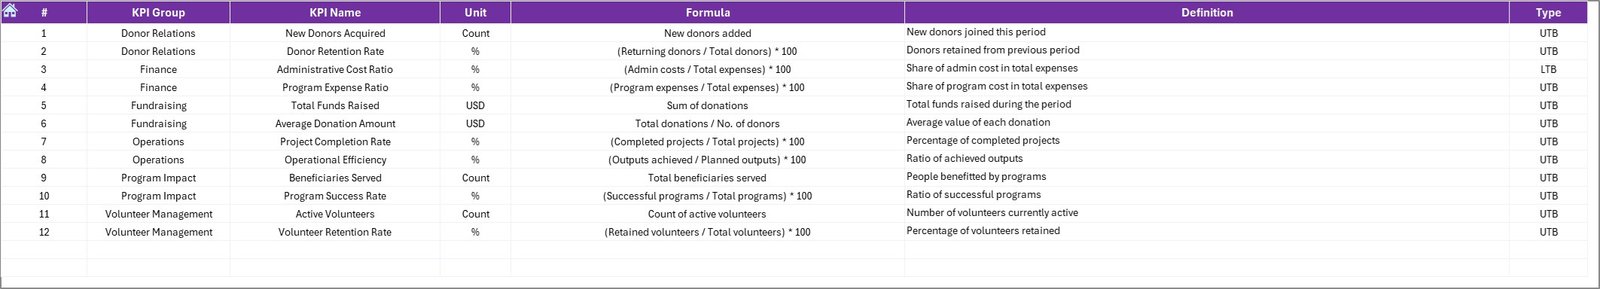
KPI Definition Sheet – Build Clarity and Transparency
The KPI Definition sheet acts as a reference table. It includes important details such as:
- KPI Name
- KPI Group
- Unit of Measurement
- Formula
- KPI Definition
This section ensures everyone interprets metrics consistently. For example, “Donor Retention Rate” or “Volunteer Utilization” is clearly defined so all departments report the same way.
Click to buy Nonprofit Organizations KPI Dashboard in Excel
Why Should Nonprofits Use a KPI Dashboard in Excel?
Managing a nonprofit organization is more than fundraising—it’s about delivering measurable results. The KPI Dashboard in Excel helps transform raw data into actionable insights.
Here’s why nonprofits love this solution:
- Affordable and Accessible: Built in Excel, it doesn’t require expensive software or training.
- Fully Customizable: Add or remove KPIs as per your organization’s focus areas.
- Transparent Reporting: Perfect for presenting data to donors and boards.
- Data-Driven Decisions: Understand what drives your outcomes and where to allocate resources.
- Improved Collaboration: Shareable Excel files make it easy to align different departments.
Advantages of the Nonprofit Organizations KPI Dashboard in Excel
This dashboard brings several tangible benefits to nonprofit teams.
- Real-Time Performance Monitoring
Leaders can instantly view up-to-date data and make faster, more informed decisions.
- Clear and Interactive Visuals
Conditional formatting, charts, and comparison arrows make interpretation simple—even for non-technical users.
- Centralized Data Management
All relevant KPIs, targets, and results stay in one file, eliminating scattered reports and data duplication.
- Improved Accountability
With transparent reporting, every department becomes responsible for achieving its goals.
- Historical and Comparative Insights
Comparing Actual vs. Target and Actual vs. Previous Year helps identify consistent performers and areas needing support.
- Easy to Customize
You can tailor KPIs, formulas, and layouts without needing advanced technical skills.
How to Use the Dashboard Effectively
Follow these steps to make the most of your Nonprofit KPI Dashboard:
- Start by defining KPIs relevant to your mission.
- Enter KPI details in the Definition Sheet for clarity.
- Input monthly Actuals in the Actual Numbers sheet.
- Set realistic Targets based on previous results.
- Update Previous Year data for comparison.
- Navigate to the Dashboard sheet and review trends.
- Use arrows and colors to identify problem areas and act quickly.
When you maintain this habit monthly, your data becomes a powerful management tool.
Best Practices for Using a Nonprofit KPI Dashboard
To get consistent value from your Excel KPI Dashboard, follow these best practices:
- Keep KPIs mission-aligned: Only track metrics that contribute to your strategic goals.
- Use simple visualizations: Avoid clutter—clarity drives better decisions.
- Review monthly: Set a recurring date to review and update data.
- Involve teams: Encourage departments to take ownership of their KPIs.
- Document definitions: Maintain consistent interpretation across reports.
- Regularly back up data: Store a copy to protect historical performance.
- Continuously improve: Add new KPIs or remove irrelevant ones as your nonprofit evolves.
How This Dashboard Supports Donor Transparency
Donors and partners expect accountability. The dashboard simplifies donor reporting by visually showcasing:
- Program outcomes
- Fund utilization ratios
- Efficiency percentages
- Year-over-year improvement
Instead of long written reports, nonprofits can share clear dashboards that speak through visuals—building donor trust and confidence.
How This Dashboard Helps in Strategic Planning
When nonprofit leaders meet to discuss strategy, they often need reliable performance data. This dashboard acts as the foundation for:
- Annual planning and budgeting
- Grant applications and donor presentations
- Board meeting updates
- Staff performance assessments
Having a consistent reporting tool ensures alignment between short-term actions and long-term objectives.
Conclusion
Every nonprofit aims to make a difference—but impact without measurement is only an assumption. The Nonprofit Organizations KPI Dashboard in Excel transforms how nonprofits monitor success, track programs, and communicate results.
By combining structure, simplicity, and analytical depth, this tool ensures that nonprofit leaders always have the right data at their fingertips. It helps turn insights into actions, and actions into measurable change.
Whether you run a small charity, an educational foundation, or a large NGO, this Excel dashboard empowers you to track your journey toward greater impact.
Frequently Asked Questions (FAQs)
- What is a Nonprofit Organizations KPI Dashboard in Excel?
It’s a ready-to-use Excel template that helps nonprofits track key performance indicators (KPIs) such as fundraising efficiency, donor retention, and program performance in one interactive file.
- Why should nonprofits track KPIs?
Tracking KPIs helps measure organizational impact, improve decision-making, and demonstrate transparency to donors and stakeholders.
- Can this dashboard be customized for any nonprofit?
Yes. You can add, modify, or remove KPIs, categories, and charts based on your organization’s unique goals and structure.
- Do I need advanced Excel skills to use it?
Not at all. The dashboard uses simple formulas and dropdowns, so even basic Excel users can manage it easily.
- What are some essential KPIs for nonprofits?
Important KPIs include Donation Growth Rate, Volunteer Retention, Program Expense Ratio, and Beneficiary Reach.
- How often should I update the dashboard?
Ideally every month, to keep MTD and YTD values current and ensure decision-makers always have fresh insights.
- How does it help in reporting to donors?
The dashboard visually summarizes performance, making it easier to show donors exactly how their contributions create impact.
- Can I integrate this Excel dashboard with other systems?
Yes. You can link it with Google Sheets or import CSV data from donor management tools or accounting systems.
- Does this dashboard work on all Excel versions?
It works best on Excel 2016 or later, though it can function on earlier versions with slight design adjustments.
- How can I get this dashboard?
You can download the ready-to-use Nonprofit Organizations KPI Dashboard in Excel from NextGenTemplates.com, along with sample data and setup instructions.
Visit our YouTube channel to learn step-by-step video tutorials
Watch the step-by-step video tutorial:
Click to buy Nonprofit Organizations KPI Dashboard in Excel